CANGAROO-III Search for Gamma Rays from Centaurus A and the Centauri Region
Abstract
We have observed the giant radio galaxy Centaurus A and the globular cluster Centauri in the TeV energy region using the CANGAROO-III stereoscopic system. The system has been in operation since 2004 with an array of four Imaging Atmospheric Cherenkov Telescopes (IACT) with 100-m spacings. The observations were carried out in March and April 2004. In total, approximately 10 hours data were obtained for each target. No statistically significant gamma-ray signal has been found above 420 GeV over a wide angular region (a one-degree radius from the pointing center) and we derive flux upper limits using all of the field of view. Implications for the total energy of cosmic rays and the density of the cold dark matter are considered.
Subject headings:
gamma rays: search — galaxy: individual (Centaurus A) — globular cluster: individual ( Centauri)1. Introduction
Centaurus A (Cen A, NGC 5128, J13254301) is one of the best examples of a radio-loud AGN. Viewed at 60∘ from the jet axis (Graham et al., 1979; Dufour et al., 1979; Jones et al., 1996), it has been classified as a “misaligned” BL Lac type AGN (Morganti et al., 1992). Estimates of the distance to Cen A range from 2 to 8 Mpc. In this paper, we adopt a value of 3.5 Mpc (Hui et al., 1993). Due to its proximity and high luminosity, Cen A has long been considered a good TeV gamma-ray candidate. A detection of high energy gamma-rays from Cen A was reported in the 1970s, however many subsequent attempts have not been successful.
First, the Stellar Interferometer, located near Narrabri, reported a positive detection with a flux of (Grindlay et al., 1975).
At higher energies, the Buckland Park array and the JANZOS Observatory also reported the detection of gamma-rays. The Buckland Park flux, measured between 1984 and 1989, was (Clay et al., 1994) and the JANZOS flux, during the period Apr–Jun 1990, was (Allen et al, 1993). Given the significant attenuation expected in the gamma-ray flux during interactions with the cosmic microwave background at these energies, these measured fluxes imply much greater intrinsic fluxes (Protheroe, 1986).
However, CANGAROO-I (Rowell et al., 1999), JANZOS (long-term) (Allen et al, 1993, 1993b), and Durham (Carramiñana et al., 1990) observed the Cen A nuclear region and set upper limits on the emission in the VHE range. Recently, the H.E.S.S. group observed Cen A for 4.2 hours in 2004 (Aharonian et al., 2005c). Their upper limit was 5.68 10-12 (1.9% of the Crab flux) at 190 GeV. They only investigated the region close to the center of Cen A, i.e., the inner jet region. Cen A has a large structure revealed by the radio observations, with inner lobes extending over 10 arcmin, a middle lobe extending over 1 degree, and outer lobes extending over more than 5 degrees (Burns, Feigelson, & Schreier, 1983). The fluxes obtained in those observations are plotted in Fig. 1. The details of the observations are listed in Table 1.
| markaaMark in Fig. 1. | reference | epoch | threshold | significance | method |
|---|---|---|---|---|---|
| G | Grindlay et al. (1975) | 1972–1974 | 300 GeV | 4.5 | CherenkovbbNo imaging Cherenkov telescope. ccSpectral index consistent with =-1.7. |
| J3 | Allen et al (1993) | Apr-Jun 1990 | 110 TeV | 2%ddChance probability. | Shower Array |
| J2 | Allen et al (1993) | 1987–1992 | 110 TeV | 95% CL. UL. | Shower Array |
| B | Clay et al. (1994) | 1984–1989 | 100 TeV | 99.4% CL. | Shower Array |
| J1 | Allen et al (1993b) | 1988 & 1989 | 1 TeV | 95% CL. UL. | CharenkovbbNo imaging Cherenkov telescope. |
| D | Carramiñana et al. (1990) | 1987 & 1988 | 300 GeV | 3 UL. | CherenkovbbNo imaging Cherenkov telescope. |
| CI | Rowell et al. (1999) | Mar–Apr 1995 | 1.5 TeV | 3 UL. | IACT |
| H | Aharonian et al. (2005c) | Apr 2004 | 190 GeV | 99% CL. UL. | stereoscopic IACT |
Cen A has displayed pronounced variability at X-ray energies over the last 35 years, with the Grindlay et al. detection coinciding with the peak of the X-ray flux over this period (see, e.g., Turner et al., 1997). Data from the ROSAT All Sky Monitor (ASM, 2007), indicate that in recent years, including the period of the H.E.S.S. observations, Cen A has been near its historical minimum X-ray state (MJD from 53111 to 53113).
CANGAROO-III has data outside of this minimum period (MJD from 530080 to 530107). We also report the results over a wide region. Part of the southern outer lobe of Cen A was located within the field of observations made of Centauri ( Cen). We, therefore, include the results of the latter observation in this report. Located at a distance of 4.9 kpc, Cen is one of the oldest, heaviest globular clusters in our Galaxy. As globular clusters have been found to contain large numbers of millisecond pulsars, they are interesting objects for high-energy gamma ray observations.
2. CANGAROO-III Stereoscopic System
The use of imaging atmospheric Cherenkov telescopes (IACTs) was established with the statistically unassailable detection of the Crab nebula at TeV energies by the Whipple group (Weekes et al., 1989). This technique enables TeV gamma-rays to be selected from the huge background of cosmic rays with the use of the “image moments” of the shower images (Hillas, 1985). Stereoscopic observations, which allow the signal-to-noise ratio to be significantly improved, were pioneered by the HEGRA group (Aharonian et al., 1999). The H.E.S.S. group has recently reported the detection of faint gamma-ray sources with an angular resolution as fine as a few arc-minutes (Aharonian et al., 2005).
CANGAROO-III is one of two major IACTs located in the southern hemisphere. The CANGAROO-III stereoscopic system consists of four imaging atmospheric Cherenkov telescopes located near Woomera, South Australia (31∘S, 137∘E). Each telescope has a 10 m diameter segmented reflector, consisting of 114 spherical mirrors made of FRP (Kawachi et al., 2001), each of 80 cm diameter, mounted on a parabolic frame with a focal length of 8 m. The total light collecting area is 57.3 m2. The first telescope, T1, which was the CANGAROO-II telescope, is not presently in use due to its smaller field of view and higher energy threshold. The second, third, and fourth telescopes (T2, T3, and T4) were used for the observations described here. The camera systems for T2, T3, and T4 are identical and their details are given in Kabuki et al. (2003). The telescopes are located at the east (T1), west (T2), south (T3) and north (T4) corners of a diamond with sides of 100 m (Enomoto et al., 2002b).
3. Observations
The observations were carried out in the period from 2004 March 16 to April 19 using “wobble mode” in which the pointing position of each telescope was shifted in declination between 0.5 degree every 20 minutes (Daum et al., 1997) from each target: (RA, dec [J2000]) = (201.365∘, 43.019∘) for Cen A, (RA, dec [J2000]) = (201.691∘, 47.477∘) for Cen. One of the reason why we took ”wobble” observation is to enlarge the effective FOV, the other is to average the responses of individual pixels. We, therefore, took LONG OFF source run of ”wobble” mode for background subtractions in the later analysis.
Data with GPS time stamps were recorded for T2, T3 and T4 individually when more than four photomultiplier (PMT) signals exceeded 7.6 photoelectrons (p.e.). In the offline analysis stage we combine all these data when the three telescope’s GPS times coincide. The typical trigger rate was 11 Hz for three-fold coincidences. Each night was divided into two or three periods, i.e., ON–OFF, OFF–ON–OFF, or OFF–ON observations. ON-source observations were timed to contain the meridian passage of the target. On average the OFF source regions were located with an offset in RA of +30∘ or 30∘ from the target. The OFF-source observations were also made in wobble mode. One day was dedicated to ON and OFF source observations of one target, with the following day dedicated to the other target. The images in all three telescopes were required to have clusters of at least five adjacent pixels exceeding a 5 p.e. threshold (three-fold coincidence). The event rate was reduced to 7.5 Hz by this criterion. Looking at the time dependence of these rates, we can remove data taken in cloudy conditions. This procedure is the same as the “cloud cut” used in the CANGAROO-II analysis (Enomoto et al., 2002). The effective observation times for ON and OFF source observations were 639.4 and 586.9 min for Cen A, and 600.8 and 429.4 min for Cen. The mean zenith angles were 17.4∘ and 20.6∘, respectively.
The light collecting efficiencies, including the reflectivity of the segmented mirrors, the light guides, and the quantum efficiencies of photomultiplier tubes were monitored by a muon-ring analysis (Enomoto et al., 2006) with the individual trigger data in the same periods. The light yield per unit arc-length is approximately proportional to the light collecting efficiencies. The average ratios of these at the observation period with respect to the mirror production times (indicating the amount of deterioration) were estimated to be 70, 70, and 80% for T2, T3, and T4, respectively. The measurement errors are considered to be at less than the 5% level. Deterioration is mostly due to dirt and dust settling on the mirrors.
4. Analysis
Most of the analysis procedures used are identical with those described in Enomoto et al. (2006b). As a full instrumental description was given in Enomoto et al. (2006), we omit a detailed discussion here. There are some improvements in the analysis procedure from that in the previous paper and so we concentrate on those points here.
At first, the image moments (Hillas, 1985) were calculated for the three telescopes’ images. The gamma-ray’s incident directions were determined by minimizing the sum of squared widths (: weighted by the photon yield) of the three images seen from the assumed position (fitting parameter) with a constraint on the distances from the intersection point to each image center (). The can be estimated from the ratio . The prediction curve () and its error ( were estimated using Monte-Carlo simulations. The constraint is;
In order to balance dimensions between and , we need to multiply by , where has the units of number of photo-electrons (p.e.) and is optimized by Monte-Carlo simulations (=10 p.e. for this analysis). Finally the minimizing variable is;
For large images, the former term dominates and for small images (for example, events at large zenith angles), the latter dominates. With this fit, we can improve uniformity of resolution especially with respect to zenith angle.
In order to derive the gamma-ray likeliness, we used the Fisher Discriminant (hereafter ) (Fisher, 1936; Enomoto et al., 2006). Input parameters were
where are energy corrected and for the T2, T3, and T4. has a small dependence on the zenith angle, i.e., as the zenith becomes larger, images become smaller ( larger). We corrected for this using Monte-Carlo simulations.
We rejected events with any hits in the outermost layer of the cameras (“edge cut”). These rejected events cause finite deformations especially in the distribution which results in deformations of the . In this analysis, we allowed less energetic hit pixels on the ”edge” layer if their pulse heights were less than that of highest 15 pixels. This cut was improved in order to increase acceptance.
Since we have distributions for OFF-source data and the Monte-Carlo gamma-ray events, we can assume these are background and signal events respectively. Note that in the gamma-ray simulations we used a spectrum proportional to where =2.1. We can therefore fit the distribution of ON with the above emulated signal and real background functions, to derive the number of signal events passing the selection criteria. With this fit, we can determine the gamma-ray excess without any positional subtractions. This is a one-parameter fitting with the constraint that sum of signal and background events corresponds to the total number of events. These coefficients can be derived exactly analytically.
5. Results
The morphology (significance map) is shown in Fig. 2.
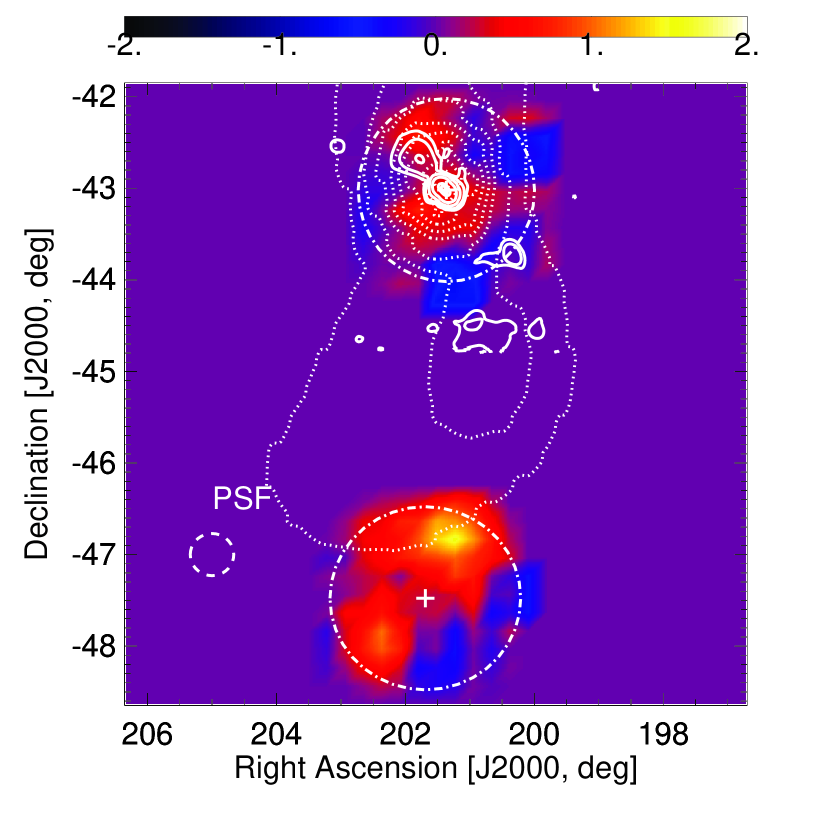
The FOV was binned to 0.2 degree 0.2 degree squares. The distribution inside each bin was made. The signal function (for gamma rays) was made using the Monte-Carlo simulation. The background (for protons) function was made collecting OFF events inside 0.6 0.6 degree2 centered around the corresponding signal bin. The one-parameter fit was carried out and the excess counts were obtained inside a one-degree circle (the dot-dashed circle) centered at the average pointing position. The pointing centers are shown by the crosses. At one degree radius, the acceptance decreases by 30%. There is, therefore, not any statistically significant excess anywhere. The positive and negative fluctuations roughly agree in the Cen A field of view. In that of Cen a positive offset was observed (0.4 ), however, it is not statistically significant. The peak located at north of -Cen field and its significance is 1.5 . The point spread function (PSF) is shown by the dashed circle at left-lower place. The solid contours are obtained via Skyview (2007) and are the GB6 radio data (4850 MHz) showing the inner lobes and middle lobe, and the dotted contours are 408 MHz radio data, roughly showing the outer lobes of Cen A from Fig. 11 of Burns, Feigelson, & Schreier (1983).
In order to derive a UL for a point source, we choose =0.06 degree2 from the center of Cen A for the cut position. The 2 UL was obtained to be 39.8 events. The energy threshold for this analysis was obtained to be 424 GeV by the Monte-Carlo simulation. For -Cen, a 2 UL of 32.3 events was obtained.
In order to derive flux ULs for the jet and lobes of Cen A, and Cen, we defined the search regions as shown in Fig. 3.
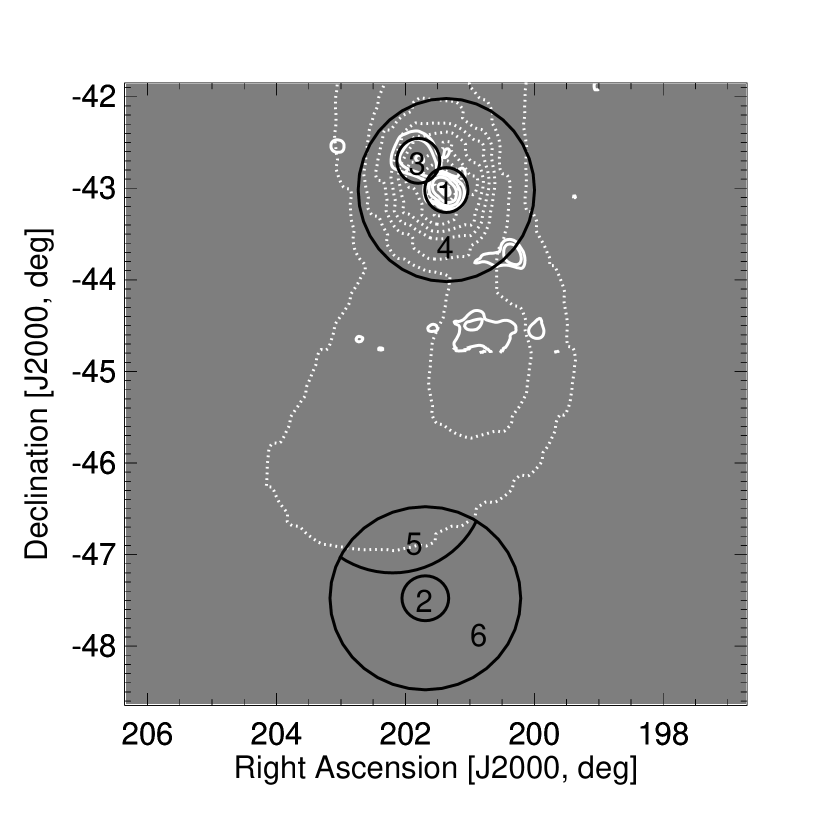
Region 1 contains the jet and inner lobes of Cen A, region 3 contains the middle lobe, and regions 4 and 5 contain portions of the outer lobes, while region 2 contains Cen. There is no high-energy astronomical counterpart in region 6 (although low level radio emission from the southern outer lobe of Cen A may extend into this region). The flux upper limits for various regions were obtained from the distributions of the ON-source runs for corresponding areas. The OFF-source runs were used for the background functions and the Monte-Carlo simulations for gamma rays for the signal. We do not observe any statistically significant excesses in any regions.
Thus we can obtain flux ULs for region 1. Those of Cen A center region are summarized in Table 2.
| Excess Upper Limit | Energy Threshold | Flux Upper Limit |
|---|---|---|
| Events | GeV | |
| 39.8 | 424 | 0.491-11] |
| 12.6 | 2074 | 0.903-12] |
| 5.0 | 6202 | 0.485-12] |
ULs are presented for three different energy thresholds.
Exactly the same procedure was carried out for the Cen region. Again there is no statistically significant excesses. The flux ULs for region 2 are summarized in Table 3.
| Excess Upper Limit | Energy Threshold | Flux Upper Limit |
|---|---|---|
| Events | GeV | |
| 32.3 | 471 | 0.355-11] |
| 7.9 | 2216 | 0.519-12] |
| 7.0 | 6518 | 0.602-12] |
The flux ULs for the regions 3, 4, 5, and 6 are summarized in Table 4.
| Region | Excess Upper Limit | Energy Threshold | Flux Upper Limit |
|---|---|---|---|
| Events | GeV | ||
| 3 | 37.3 | 424 | 0.875-7] |
| 4 | 132.6 | 424 | 0.193-7] |
| 5 | 203.7 | 471 | 0.106-6] |
| 6 | 304.3 | 471 | 0.436-7] |
Here, the ULs are divided by the solid angles of the observations, because the inner lobes, middle lobe, and outer lobes are candidates for diffuse emission.
6. Discussion
First, our flux ULs together with that of H.E.S.S. are quite low compared to the past indications of TeV gamma rays and also to the past UL measurements, demonstrating the strength of the stereo-IACT technique.
Next we discuss the total cosmic-ray energy and the cold dark matter (CDM) density for each corresponding astronomical object. Here, we assumed distances of Cen A and Cen to be 3.5 Mpc and 6 kpc, respectively. For the total energy of the cosmic rays, we assume that the origin of the TeV gamma-rays is the inverse Compton (IC) scattering of cosmic-ray electrons with the cosmic microwave background (CMB). The electron/proton ratio of our Galaxy is thought to be 0.11%. Therefore, 1052 erg for the electron cosmic-ray component might be a standard value for typical galaxies. Here, we assumed the electron energy spectrum of . We integrate the electron spectrum greater than 1 GeV in order to calculate the total energy of electron component. The interstellar matter densities are not well measured in the corresponding regions. The electron assumption is reasonable, because the CMB density is well defined and can be considered to a lower limit for ambient photon density.
Cen A is considered to be a low-energy peaked BL Lac object (LBL) rather than high-energy peaked object (HBL). The spectral energy distribution (SED) is plotted in Fig. 4.

Even if a cosmic ray flux similar to our Galaxy’s exists, there is no contradiction with any past measurements in the all wave length region (NED, 2007). This, therefore, is not denying higher energy component such as 100 TeV even in the higher level compared to our Galaxy, for example 1053 erg of electrons. Actually, Bai & Lee, (2001) predicted a time-dependent huge energy flow in the TeV energy region which is shown by the open circle in Fig. 4. The H.E.S.S. UL is shown by the open square with arrow and our ULs by the open diamonds. These are orders of magnitude lower than the predicted value. However, as our measurement periods correspond to a quiet phase of Cen A (from ASM data), there is no direct contradiction of this idea.
We rather concentrate ourselves to the quiet, stable, and average states of Cen A. If a high energy component of electrons exists at the level of the total energy of 1054 erg which is one-hundred times stronger than that of our galaxy, the expected TeV gamma-ray flux is the dashed curve in Fig. 4. That is higher than our ULs, i.e, we can derive a meaningful UL to the total electron densities. The 2 ULs (the dotted curve) for the above assumption were derived and shown in Fig. 5.

The vertical scale is the logarithm of total electronic energy normalized to 1050 erg and the horizontal scale is the maximum accelerated energy of the electron in TeV. At 100 TeV, the limit is 31053 erg which is thirty times bigger than that of our Galaxy. Although Cen A is highly active especially at radio, IR, and MeV energies compared to our Galaxy, any high energy cosmic-ray components are not detected; Cen A is a mysterious object. If we assume that the target photons are of those IR temperature blackbody radiation, the limits of the total energy will be significantly reduced. The future Cherenkov telescope array experiment (CTA) (CTA, 2007) is promising to help resolve this, as it aims to be two orders of magnitude more sensitive than the present IACTs. If CTA does not detect any signal from this region, we might need to totally revise the idea of the cosmic-ray origin.
According to the ASM data (ASM, 2007), the X-ray activity of Cen A was at a minimum in the MJD range between 53111–53113. The H.E.S.S. observation was completely coincident with this period, and ours partially. We, therefore, can divide the observational period into two, i.e., coincident with the ASM minimum, and the remaining data. The ULs for these two periods are summarized in Table 5.
| Excess Limit | Energy Threshold | Flux Limit | MJD-53000 |
|---|---|---|---|
| Events | GeV | day | |
| 57.6 | 424 | 0.128-10] | 80, 82, 89, 91, 107 |
| 26.7 | 424 | 0.737-11] | 111, 113 |
There is however no excess in the period of the (slightly) higher state.
Cen is the biggest and oldest globular cluster inside our Galaxy. There is no ionizing gas which is considered to be an origin of cosmic rays. We, therefore, do not expect any TeV radiation from this object. However, to know the minimum level of cosmic-ray density is important. There may be a lot of milli-second pulsars as has been found in other globular clusters. The object may still hold a CDM halo (Peebles, 1984), as these are not clearly denied at the present level of measurements. The ULs for the total energy of electron cosmic ray component is derived in the same way as described previously. Under the assumption of a maximum electron accelerated energy of 100 TeV, the total electron energy is less than 4 1047 erg, i.e., less than one-supernova level, a surprisingly quiet object considering its total mass of 106 M⊙ (van de Ven et al, 2006; Meylan et al., 1995; Richer et al., 1991).
Cen A is a massive object and Cen a much higher density object than our Galaxy as a whole. The upper limit study of the CDM density would provide meaningful information as to the mechanism of their formations. However note that for the case of globular clusters, CDM was considered to be stripped off via tidal force in the periodic motions inside the parasite galaxy. Peebles (1984) discussed the existence of the dark matter in this kind of object. The CDM search was carried out following the procedure of Enomoto et al (2003). Here we additionally used the EGRET UL at 189 MeV (NED, 2007). This is effective around the sub-TeV CDM particle mass region. Assuming the CDM particle mass of 1 TeV, the 2- upper limit for the CDM density is 1.2 /pc3. These are quite high compared to our local density estimation of CDM of 0.01M⊙/pc3. The mass of Cen A was estimated to be several 1011M⊙ (Mathieu et al., 1996; Peng et al., 2004a, b; Karachentsev et al., 2007; Woodley, 2006). In order to derive the total mass of the CDM, we multiply by a factor of 1.42 1013 pc3 considering our angular resolution of =0.06 degree2 with an assumption of the distance of 3.5 Mpc (Hui et al., 1993). Then the total CDM mass inside the volume is less than 2 1013 M⊙, i.e., a meaningless result.
For Cen, we can carry out the same discussion and the results are shown in Fig. 6.

The result is one order of magnitude higher than that of Cen A. This is due to distance of 6 kpc compared to that of Cen A of 3.5 Mpc while the volumes are determined by the same angular resolution of the observation. However, multiplying the volume factor of 4104 pc3, then the most CDM-particle-mass region is under its total gravitational mass of 5106 M⊙. In most regions of CDM particle mass between 100 GeV and 10 TeV, we can reject the hypothesis that the gravitational mass is dominantly occupied by the CDM particles, they might be absorbed by our Galaxy. Presently, high energy physicists believe that the CDM particle mass lies inside the above region. The future CTA project (CTA, 2007) would reveal the fact in a wider mass region, or the near-future LHC project might give a conclusive result on this subject. In cosmological life, the larger eats the smaller but its core remains.
7. Conclusion
In this paper, we present the results of stereoscopic observations of Centaurus A and Centauri with the CANGAROO-III telescopes. The observation period was 2004 March 16 to April 19 and the total observation times were 640 min for Cen A and 600 min for Cen. The observation of Cen A was carried out over a similar period to that of H.E.S.S. The Cen observations are the first reported trial by Imaging Atmospheric Cherenkov Telescopes. The analysis was carried out inside a one-degree (radius) circle from the average pointing position. We derived flux upper limits for regions containing the jet and inner lobes, the middle lobe, and portions of the outer lobes of Cen A, and center of Cen. The Cen A upper limits are, as with the H.E.S.S. limit, an order of magnitude lower than previous measurements.
The upper limits for the total energy of the electron components of cosmic rays were calculated under the assumption of Inverse Compton Scatterings on the cosmic microwave background, with limits of 31053 and 41047 erg obtained for Cen A and Cen, respectively.
Finally we gave upper limits to the density of Cold Dark Matter (CDM). Around the TeV region, we obtained upper limits of its density of 2 M⊙pc-3 for Cen A and 100 M⊙pc-3 for Cen. The limit for Cen A was greater than its gravitational mass, however, that for Cen was less than it.
References
- Abe et al. (2001) Abe, K., et al. 2001, PRL, 87, 101801
- Aharonian et al. (1999) Aharonian, F. A., et al. 1999, A&A, 349, 11
- Aharonian et al. (2005) Aharonian, F. A., et al. 2005, Science, 307, 1938
- Aharonian et al. (2005c) Aharonian, F et al., 2005c, A&A, 441, 465
- Allen et al (1993) Allen, W.H. et al, 1993, Astropart. Phys., 1, 269
- Allen et al (1993b) Allen, W.H. et al, 1993b, ApJ., 405, 554
- ASM (2007) ROSAT All Sky Monitor (ASM), http://xte.mit.edu/ASM_lc.html
- Bai & Lee, (2001) Bai, J. M. & Lee, M. G., 2001, ApJ, 549, L173
- Burns, Feigelson, & Schreier (1983) Burns, J. O., Feigelson, E. D., & Schreier, E. J., 1983, ApJ, 273, 128
- Carramiñana et al. (1990) Carramiñana, A., et al., 1990, A&A, 228, 327
- Clay et al. (1994) Clay, R. W., Dawson, B. R., Meyhandan, R. 1994, Astropart. Phys., 2, 347
- CTA (2007) Cherenkov Telescope Array (CTA), http://www.mpi-hd.mpg.de/htm/CTA/
- Daum et al. (1997) Daum, A., et al. 1997, Astropart. Phys., 8, 1
- Dufour et al. (1979) Dufour R. J., 1979, AJ, 84, 284
- Enomoto et al. (2002) Enomoto, R., et al. 2002b, Nature, 416, 823
- Enomoto et al. (2002b) Enomoto, R., et al. 2002a, Astropart. Phys., 16, 235
- Enomoto et al (2003) Enomoto, R. et al., 2003, ApJ, 596, 216
- Enomoto et al. (2006) Enomoto, R., Tsuchiya, K., Adachi, Y., Kabuki, S., Edwards, P. G., et al. 2006, ApJ, 638, 397
- Enomoto et al. (2006b) Enomoto, R., Watanabe, S., Tanimori, T., et al. 2006, ApJ, 652, 1268
- Fisher (1936) Fisher, R. A. 1936, Annals of Eugenics, 7, 179
- Graham et al. (1979) Graham J. A., 1979, ApJ, 232, 60
- Grindlay et al. (1975) Grindlay, J. E., Helmken, H. F., Hanbury Brown, R., Davis, J., Allen, L. R. 1975, ApJ, 197 L9.
- Hillas (1985) Hillas, A. M. Proc. 19th Int. Cosmic Ray Conf. (La Jolla) 3, 445
- Hui et al. (1993) Hui X., Ford H. C., Ciardullo R., and Jacobi G. H. 1993, ApJ, 414, 463
- Jones et al. (1996) Jones D. L. et al. 1996, ApJ. 466, L63
- Kabuki et al. (2003) Kabuki, S., et al. 2003, Nucl. Instrum. Meth., A500, 318
- Karachentsev et al. (2007) Karachentsev I.D. et al., 2007, AJ, 133, 504
- Kawachi et al. (2001) Kawachi, A., et al. 2001, Astropart. Phys., 14, 261
- Mathieu et al. (1996) Mathieu A., Dejonghe H., Hui X., 1996, A&A, 309, 30
- Meylan et al. (1995) Meylan G., Mayor M., Duquennoy A., Dubath P., 1995, A&A, 303,761
- Morganti et al. (1992) Morganti R., 1992, MNRAS, 256, 1p
- NED (2007) NASA/IPAC Extragalactic Database (NED), http://nedwww.ipac.caltech.edu/
- Peebles (1984) Peebles, P.J.E., 1984, ApJ, 186, 467
- Peng et al. (2004a) Peng E.W. et al., 2004, ApJ, 602, 685
- Peng et al. (2004b) Peng E.W. et al., 2004, ApJ, 602, 705
- Protheroe (1986) Protheroe, R. J. 1986, MNRAS, 221, 769
- Richer et al. (1991) Richer H.B., Fahlman G.G., Buonanno R., Fusi Pecci F., Searle I., Thompson I.B., 1991, ApJ, 381, 147
- Rowell et al. (1999) Rowell G. P., 1999, Astropart. Phys., 11, 217
- Skyview (2007) SkyView, http://skyview.gsfc.nasa.gov/
- Tanimori et al. (2005) Tanimori, T., et al. 2005, Proc. 29th Int. Cosmic Ray Conf. (Pune), OG2.2, 215
- Turner et al. (1997) Turner, T. J., George, I. M., Mushotzky, R. F., & Nandra, K. 1997, ApJ, 475, 118
- van de Ven et al (2006) van de Ven G., van den Bosch R.C.E., Verolme E.K., de Zeeuw P.T., 2006, A&A, 445, 513
- Weekes et al. (1989) Weekes, T. C., et al. 1989, ApJ, 342, 379
- Woodley (2006) Woodley K., 2006, AJ, 132, 2424