Homogeneous and heterogeneous nucleation of Lennard-Jones liquids
Abstract
The homogeneous and heterogeneous nucleation of a Lennard-Jones liquid is investigated using the umbrella sampling method. The free energy cost of forming a nucleating droplet is determined as a function of the quench depth, and the saddle point nature of the droplets is verified using an intervention technique. The structure and symmetry of the nucleating droplets is found for a range of temperatures. We find that for deep quenches the nucleating droplets become more anisotropic and diffuse with no well defined core or surface. The environment of the nucleating droplets form randomly stacked hexagonal planes. This behavior is consistent with a spinodal nucleation interpretation. We also find that the free energy barrier for heterogeneous nucleation is a minimum when the lattice spacing of the impurity equals the lattice spacing of the equilibrium crystalline phase. If the lattice spacing of the impurity is different, the crystal grows into the bulk instead of wetting the impurity.
I Introduction
Although nucleation from a supercooled liquid has been the subject of extensive simulations YangPRL88 ; SwopePRB90 ; MatsumotoNature02 ; LeyssaleJCP05 ; YangJCP90 ; Cherne2004 , theory AlexanderPRL78 ; KleinPRL86 ; KleinPRE01 ; OxtobyJCP96 , and experiments SchofieldScience01 ; BodartPRB03 , the nature of the nucleating droplet in supercooled liquids is not well understood, especially for deep quenches. For shallow quenches (near coexistence), classical nucleation theory applies. For deeper quenches, nucleation is affected by the proximity to the liquid-solid spinodal for systems with long-range interactions KleinPRL86 . The spinodal represents the limit of stability of the metastable liquid and is well defined only in the limit of an infinite interaction range. However, spinodal-like effects have been found for deep quenches in systems with intermediate and short-range interactions HeermannPRL83 ; YangPRL88 ; TruduPRL06 . Spinodal nucleation theory predicts that the decrease of the surface tension of the droplets as the spinodal is approached makes the nucleating droplets diffuse and fractal-like. Moreover, the symmetry of the nucleating droplets is not necessarily the same as the symmetry of the stable phase, and the symmetry of the nucleating droplets in three dimensions is either body-centered cubic (bcc) or randomly stacked hexagonal planes. Trudu et al. TruduPRL06 studied nucleation of a Lennard-Jones liquid using transitional path sampling, and found a crossover from classical to spinodal-like behavior for deeper quenches. In particular, they observed that the nucleating droplets become less compact and spherical, but did not analyze the structure and symmetry of the nucleating droplets.
The study of heterogeneous nucleation, that is, nucleation that occurs on impurities, is of much practical importance because most nucleation events that occur in nature are heterogeneous. Examples include nucleation on a container wall ToxvaerdJCP02 and nucleation of proteins in porous media SearPNAS2006 . Many experiments YinAM2000 ; HaymetPNAS2002 and simulations FrenkelPRL2003 ; SearPRL2006 ; WarrenPRL2007 ; CastroPRE03 have been done to study heterogeneous nucleation. Existing theories of heterogeneous nucleation are mostly phenomenological and natural extensions of classical nucleation theory WangJCP2004 ; LauriJCP2006 ; DjikaevJCP2006 . It is known that the presence of impurities can lower the free energy barrier of nucleation by as much as several orders of magnitude FrenkelPRL2003 . The effectiveness of an impurity to decrease the nucleation barrier is determined by properties such as the shape of the impurity and the surface tension between the substrate and the metastable liquid. Page and Sear SearPRL2006 studied heterogeneous nucleation in porous media using the Ising model and found that a pore which is approximately the size of the critical nucleus is optimal for decreasing the nucleation barrier. Heterogeneous nucleation on a structureless solid surface has also been simulated ToxvaerdJCP02 . However, the effects of the microscopic properties of the impurities on nucleation have not been well characterized.
In this paper, we will study homogeneous and heterogeneous nucleation in supercooled Lennard-Jones liquids using the umbrella sampling method. For homogeneous nucleation, we find spinodal effects for deep quenches by analyzing the structure of the nucleating droplets. In particular, the nucleating droplets are found to become more anisotropic and diffuse with no well defined core or surface. The droplets and their immediate environment form randomly stacked hexagonal planes, which is consistent with the spinodal nucleation picture.
To study heterogeneous nucleation a fixed impurity consisting of particles that form a hexagonal plane is added to the system. We find that the impurity whose lattice spacing is equal to the lattice spacing of the equilibrium crystalline phase is most effective in lowering the free energy barrier of nucleation. We also find that when the lattice spacing of the impurity is different than the optimal spacing, the crystal prefers to nucleate on the newly formed crystal (grow into the bulk) instead of wetting the impurity.
This paper is organized as follows. Section II describes the simulation details and the intervention technique which we use to test the saddle point nature of the nucleating droplets. Section III presents the simulation results of homogeneous nucleation, and Sec. IV discusses our results on heterogeneous nucleation.
II Simulation details
The three-dimensional system of interest consists of particles with density interacting via the Lennard-Jones potential. Periodic boundary conditions are used. We adopt dimensionless units so that lengths and energies are given in terms of the Lennard-Jones parameters and . We first prepared a liquid at , which is above the coexistence temperature ( VerletPR1969 ), by melting a perfect fcc crystal; this simulation is done using the Metropolis algorithm at constant volume. The system is equilibrated for 50,000 Monte Carlo steps per particle (mcs) in the liquid phase before the quench. The system is then quenched by rescaling the temperature by a factor of 0.999 every 20 mcs.
Because the probability of nucleation is very small, we used the umbrella sampling method TorrieCPL74 ; TorrieJCompP77 ; FrenkelJCP92 ; FrenkelJCP04 ; FrenkelJCP96 . We denote as the order parameter, which we choose to be the number of particles in the largest (solid-like) cluster. (The definition of the solid-like clusters is discussed in Sec. II.1.) The free energy is calculated from the relation
| (1) |
where is the probability density of .
In the umbrella sampling method, the system is sampled according to the total energy , where is the original potential energy of the system and is the bias potential. The probability distribution is sampled according to the total density operator , which is the product of the original density operator and the weight function due to the bias . The original distribution can be determined by
| (2) |
Hence, the free energy in Eq. (1) can be calculated by
| (3) |
As in Ref. FrenkelJCP04, , the potential bias has the form
| (4) |
The constant determines the width of the sampling window and yields . We consider a sequence of values of starting from size 0 and increasing by ten particles, that is, , 10, 20, …. Because the width of the window , the choice of ten particles means that the sampling windows overlap. Before collecting data for the probability for each value of , the system is equilibrated for 10,000 mcs. The values of are then sampled for 100,000 mcs. To save equilibration time a configuration for the current value of is used as the initial condition for the next value of . Because determining the size of the largest cluster is computationally expensive, we make trial moves of 5 mcs using only the Lennard-Jones potential without the bias potential (4), and then accept or reject these trial moves using only the bias potential in Eq. (4).
II.1 Cluster analysis
Unlike Ising/Potts models ConiglioJPA80 there is no rigorous definition of clusters in a continuous particle system. Instead we are forced to rely on our intuition to identify the solid-like particles. We use the local bond-order analysis introduced by Steinhardt et al. SteinhardtPRB83 and developed by Frenkel and co-workers FrenkelJCP96 . We define the component complex vector for particle :
| (5) |
where the sum is over the nearest neighbors of particle and is the spherical harmonic as a function of the unit direction vector between particle and its neighbors. The nearest neighbors of a given particle are defined to be within the distance 1.4, which corresponds to the position of the first minimum of the radial distribution function of the crystalline phase at the same density and temperature.
It has been shown that is a good choice for characterizing the structures of crystals FrenkelJCP92 . The rotational invariants , , , and are defined as
| (6) | ||||
| (7) | ||||
| (8) | ||||
The quantity in brackets in Eq. (8) is the Wigner’s symbol.
To define a solid-like particle, we first introduce the normalized quantity as
| (9) |
and form the dot product
| (10) |
where ∗ indicates the complex conjugate. The dot product by construction. Particles and are said to be coherent if the real part of the dot product is greater than 0.5. A particle is considered to be solid-like if its number of coherent neighbors is greater than or equal to . We will chose for reasons that we will discuss in Sec. II.2. After finding all the solid-like particles, we identify the clusters using the criterion that any two solid-like particles that are nearest neighbors belong to the same cluster.
As discussed in Ref. FrenkelJCP96, , the distribution of the invariants , , and can be used to characterize the symmetry of a group of particles, for example, a cluster. For a given group of particles we first determine the histogram of each invariant. The three histograms are then rescaled so that they do not overlap and are combined to form the histogram . The histogram corresponding to a group of particles is decomposed in terms of the histograms of the invariants corresponding to each symmetry of interest, namely,
| (11) |
For example, is determined for a system with fcc symmetry in which a certain amount of randomness has been introduced randomness . The coefficients corresponding to each symmetry, , and , are found by minimizing the quantity
| (12) |
with the constraints that and . The coefficients and are indications of the composition of each symmetry associated with the group particles.
| T | fraction | T | fraction |
|---|---|---|---|
| 0.75 | 0.65 | 0.60 | 0.40 |
| 0.70 | 0.60 | 0.55 | 0.45 |
| 0.65 | 0.35 | 0.53 | 0.55 |
II.2 The intervention method
Because the cluster analysis involves parameters such as the minimum number of coherent neighbors, the computed size of the clusters depends somewhat on the values chosen for the parameters. To determine if our choices are consistent, we use the fact that the nucleating droplets correspond to the maximum of the free energy barrier and should be saddle point objects; that is, the nucleating droplets should grow or shrink with approximately 50% probability under a small perturbation. In practice, the parameters in the cluster analysis are first chosen and the umbrella sampling procedure is performed. Then the intervention method is used to test if intervention causes the clusters corresponding to the maximum of the free energy to grow or shrink with % probability. If these clusters do not, the parameters in the cluster analysis are modified until approximately 50% growth probability is achieved for the modified clusters at the new free energy maximum.
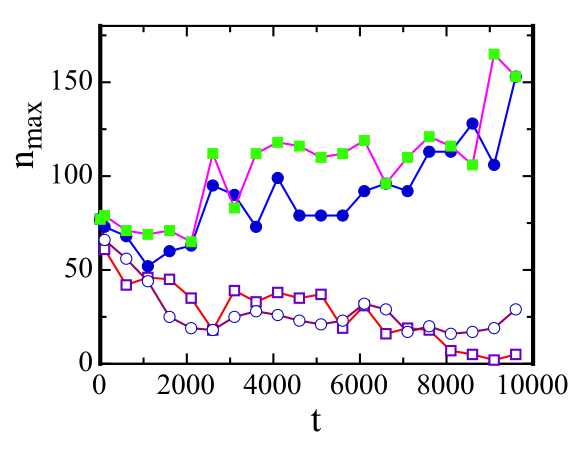
The intervention method we adopt is similar to what has been used to study nucleation in the Ising model MonetteJSP92 . To test if a cluster is a nucleating droplet, we stop the simulation and make many copies of the system. Each copy is restarted with a different random number seed without the potential bias. We then determine if the largest cluster in each copy grows at approximately the same place at approximately the same time as the original. After the time , both the size and location of the cluster are examined. If the size of the cluster is larger than its original size and the center of mass is within a distance from the cluster in the original configuration, the cluster is said to grow. The role of is to ensure that the cluster is the same as the one in the original configuration. We choose mcs. The distance should correspond to the size of the cluster; typically 50% of the linear spatial extent of the cluster is sufficient to decide whether the cluster kept its identity during . Because intervention is very time consuming, we made 20 copies of each configuration. The evolution of the size of the largest cluster after intervention for four trials is plotted in Fig. 1 for . Note that the largest cluster has grown in some trials and shrunk in others. By determining the frequency of the successful trials we can estimate the probability of growth of a cluster. The fraction of trials (out of 20 trials) for which the cluster grows is listed in Table 1 for different temperatures. We found that setting gives consistent results.
III Homogeneous nucleation
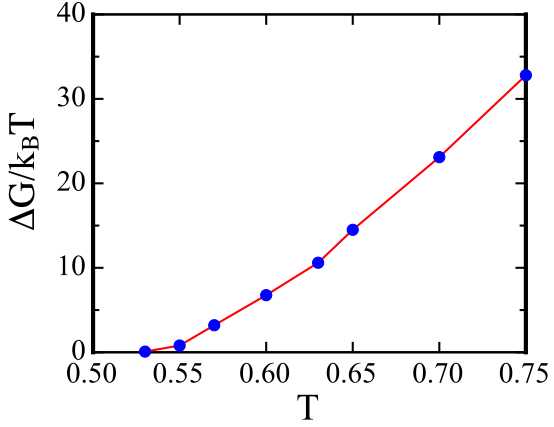
We determined at several temperatures between and . As expected, exhibits a minimum and a maximum (see Fig. 2(a)). The minimum of corresponds to the metastable supercooled liquid, where solid-like particles are present due to thermal fluctuations. The maximum occurs at the size of the nucleating droplet (recall that we have chosen the order parameter to be the size of the largest cluster). The free energy difference of the maximum and the minimum can be interpreted the free energy barrier for nucleation FrenkelJCP04 . We find that the nucleation barrier decreases with temperature (see Fig. 2(b)) and vanishes at . This vanishing of the free energy barrier raises questions on whether or not it corresponds to a spinodal.
The spinodal is usually defined as the sharp boundary between the metastable and unstable states BinderPRA84 . In particular, the spinodal is a thermodynamic transition that acts as a line of critical points. (In Ising models the spinodal corresponds to a divergent isothermal susceptibility HeermannPRL82 .) We will refer to this interpretation as the classical spinodal. The spinodal as defined in this way is present only in mean-field systems such as those with infinite range interactions. Systems with large but finite range interactions can exhibit pseudospinodal effects KleinPRE07 . To test if corresponds to the classical spinodal we also simulated the system at this temperature by a standard Metropolis algorithm. By tracking the size of the largest cluster we found that the lifetime of the metastable state is in the range mcs, which implies that the free energy barrier to nucleation has not vanished at . Hence the vanishing of the free energy barrier found by umbrella sampling does not necessarily correspond to a classical spinodal. Moreover, we found (see Table 1) that the droplets found by umbrella sampling appear to be saddle point objects as determined by the intervention method (without the bias potential). A possible explanation is that the interpretation of the umbrella sampling results for assumes that clusters whose size are comparable to the nucleating droplet are rare FrenkelJCP04 . This assumption is not applicable for because there is typically more than one large cluster of comparable size in the system. We will investigate this assumption and other possible explanations in future work.
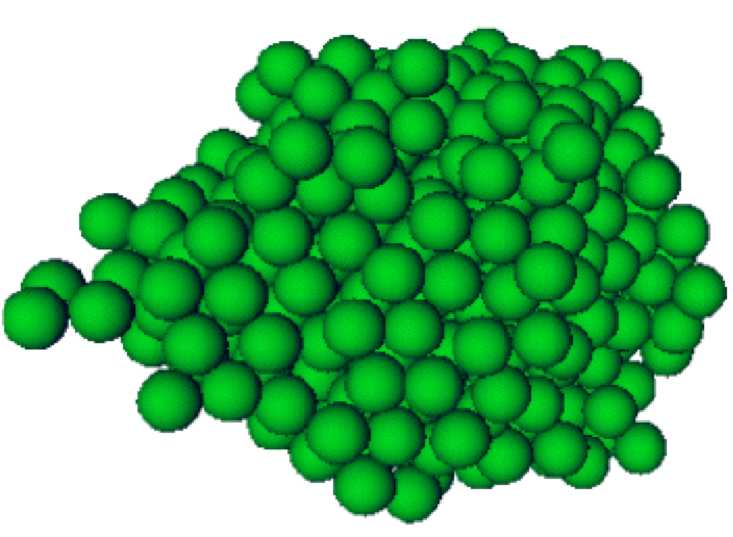
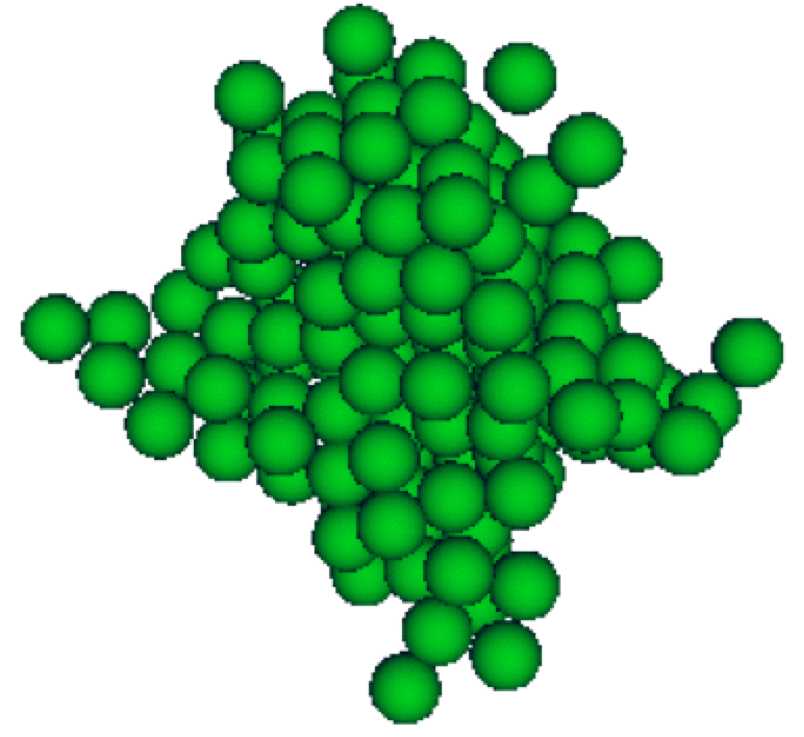
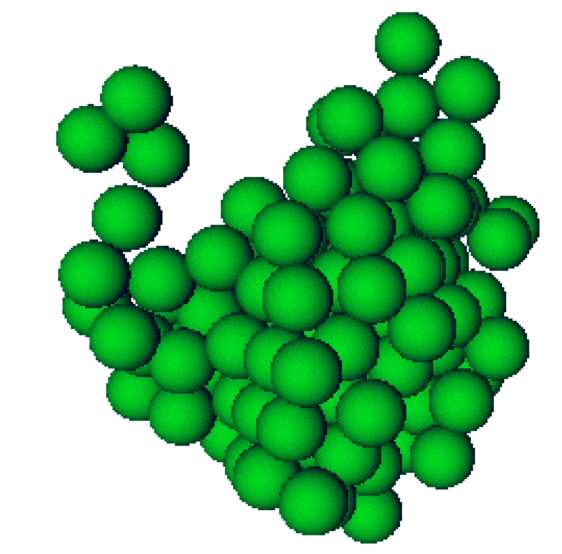
Figure 3 shows snapshots of the nucleating droplet at different temperatures. Note that the droplets are compact for moderate supercooling and become more diffuse for deeper quenches. This qualitative observation is consistent with Ref. TruduPRL06, . We will analyze the structure of the nuclei in the following.
III.1 The structure of the nucleating droplets
To measure the compactness of a nucleating droplet, we determine its density profile , which is defined in terms of the mean number of particles in the spherical shell between and
| (13) |
Here is measured from the center of mass of a nucleating droplet.

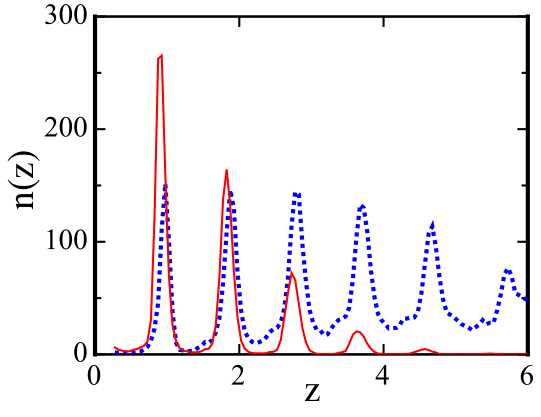
Figure 4 shows averaged over 1000 nucleating droplets at the value of corresponding to the maximum of . For , has a plateau for small , meaning that the droplet has a well defined core. The decrease of for larger indicates that there is an interface between the core and the liquid environment. At , the plateau disappears, and the density slowly decreases from the core to the surface, indicating that the nucleating droplet is diffuse.
To quantify the anisotropy of the nucleating droplets, we calculate the moment of inertia tensor associated with each droplet,
| (14) |
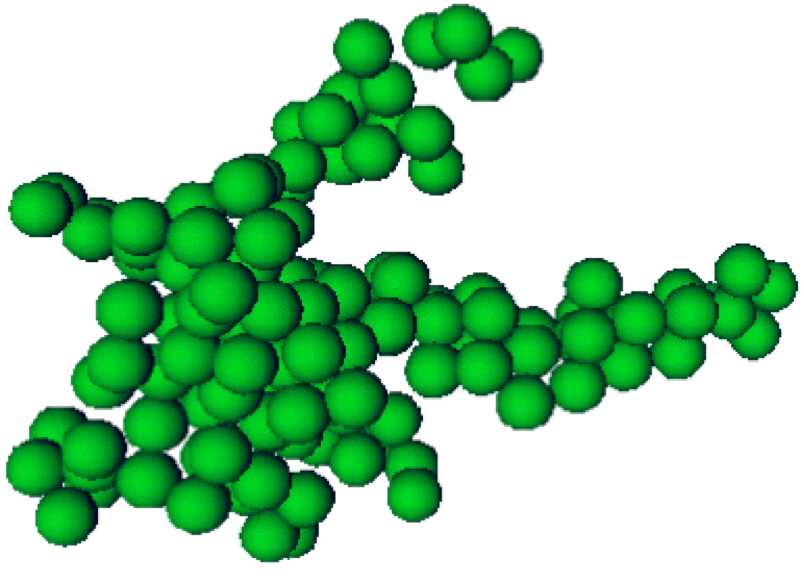
where , labels the particles, and and label the components of . The square root of the eigenvalues of define the principal radii of the ellipsoid characterizing the droplet. The orientation of each individual nucleating droplet is found to be random; that is, the long axis of the computed ellipsoid points in random directions independent of the orientations of the simulation cell. We can characterize each droplet’s anisotropy by calculating the ratio of the maximum and minimum principal radii (denoted by and respectively). This ratio is one for a perfectly spherical droplet and is greater than one if the droplet is anisotropic. Figure 5 shows the ratio (averaged over 1000 nucleating droplets at each temperature) as a function of the temperature. The ratio is close to one for shallow quenches, meaning that the nucleating droplets are close to spherical. The increase of the ratio at lower temperatures indicates that the nucleating droplets become more anisotropic. The anisotropic character of the nucleating droplets is important in the calculation of the nucleation barrier even in classical nucleation theory TruduPRL06 .

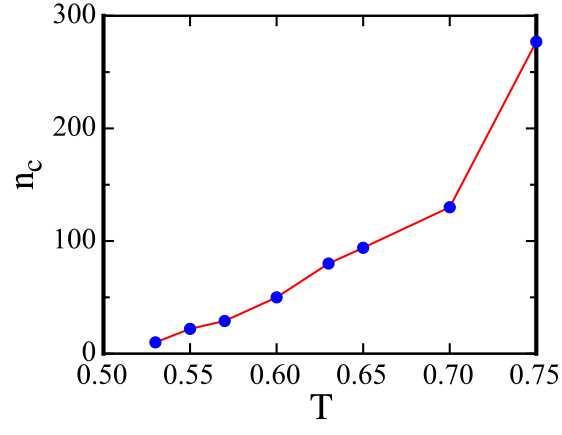

Figure 6 shows that the number of particles in the nucleating droplet and the radius of gyration decrease as the temperature is decreased. Both quantities are predicted to first decrease as the temperature is lowered from coexistence and then begin to increase as the spinodal is approached UngerPRB84 . In particular, if the spinodal interpretation is applicable, simple scaling arguments gyration suggest that (in three dimensions) and (in all dimensions) should increase as the spinodal is approached if the system is sufficiently close to the spinodal so that the core of the nucleating droplet has disappeared. The fact that and do not increase rapidly at lower temperatures in our simulations might be due to the nonexistence of spinodal effects and/or the underestimate of and near the spinodal due to our ad hoc definition of solid-like particles. A more likely explanation is that because the nucleating droplets near the spinodal are anisotropic and effectively two-dimensional, the simple scaling arguments do not apply. In Fig. 6(b) we plot the semimajor axis of the nucleating droplets. Note that does show the expected behavior. In addition, the scaling arguments gyration in two dimensions suggest that is either a constant or is logarithmically divergent as the spinodal is approached. More work is needed to understand the temperature-dependence of , , and in the intermediate region where neither the classical nor spinodal picture is applicable.
III.2 Symmetry of the nucleating droplets
| T | |||
|---|---|---|---|
| 0.75 | 0.62 | 0.38 | 0.00 |
| 0.70 | 0.50 | 0.48 | 0.02 |
| 0.65 | 0.46 | 0.52 | 0.02 |
| 0.60 | 0.28 | 0.66 | 0.06 |
| 0.55 | 0.26 | 0.68 | 0.06 |
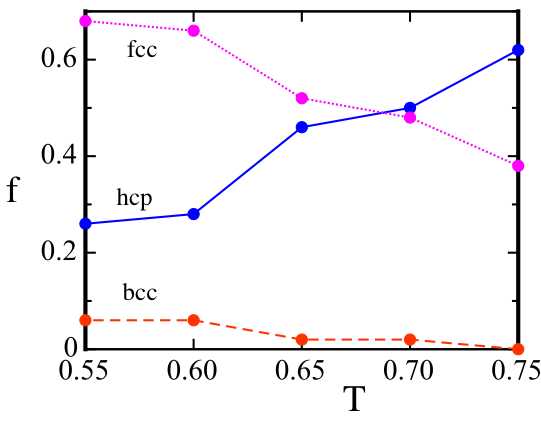
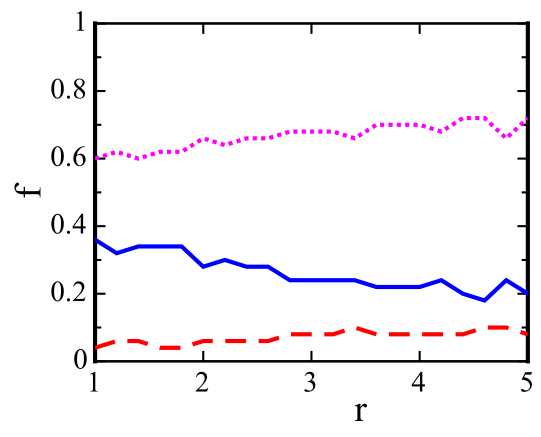
The symmetry of the nucleating droplets is analyzed using the method discussed in Sec. II.1. At each temperature, we obtain the parameters , , and for the nucleating droplets averaged over 1000 independent configurations. The fitting parameters are listed in Table 2 and are plotted in Fig. 7. As the temperature is decreased, the fcc component decreases and the bcc and hcp components increase. The mixture of fcc and hcp signifies the occurrence of the rhcp structure SchofieldScience01 and is consistent with the picture of stacked hexagonal planes KleinPRL86 .
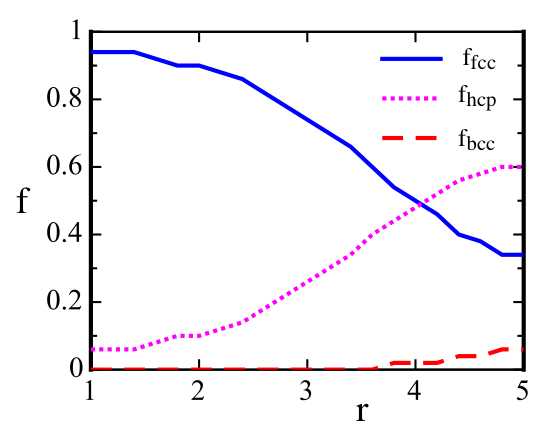
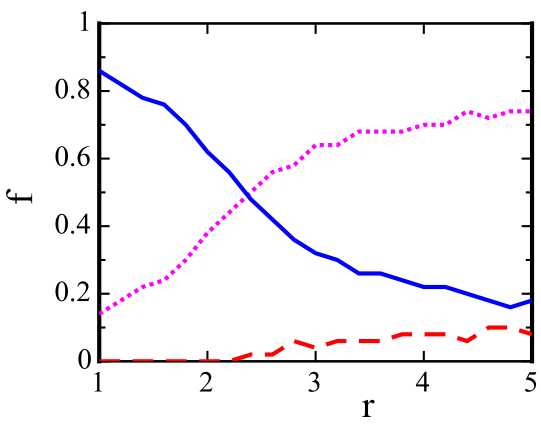
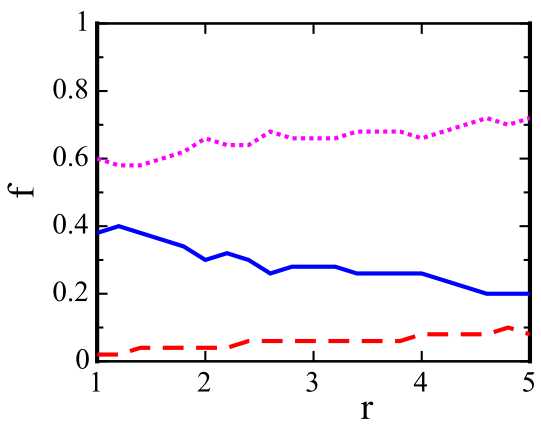
We also calculated the symmetry of the particles in a spherical shell between and , where is measured from the center of mass of the cluster and is the thickness of the shell (). Figure 8 shows the component of each structure as a function of for various temperatures. At , the core of the nucleating droplet is mostly fcc. Away from the center, the fcc component decreases and the bcc and liquid component increases. At the surface, the bcc component levels off to . The fact that the nucleating droplet is composed of an fcc core and a bcc halo agrees with previous results FrenkelJCP96 . At the nucleating droplet is mainly a mixture of fcc and hcp, with a slight increase of the bcc component. The increase of bcc symmetry and decreased distinction between the bulk and the surface for deep quenches is in agreement with the spinodal nucleation picture KleinPRL86 .
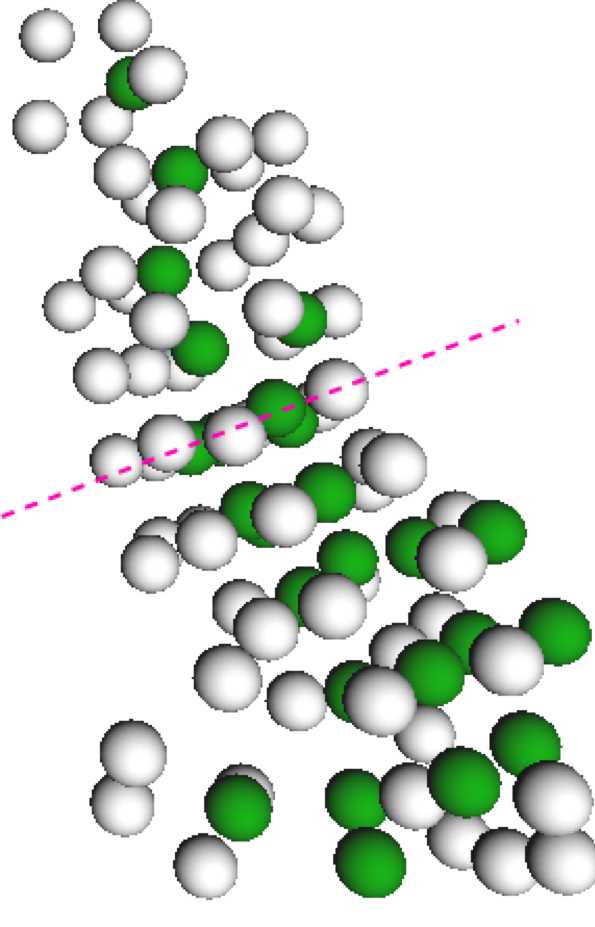
We also examined the structure of the particles in the nucleating droplet and its local environment, which consists of particles that are nearest neighbors of any particle in the droplet. Although the particles in the nucleating droplets by themselves do not seem to form a visually identifiable structure, the nucleating droplets and the surrounding particles in the liquid phase together form hexagonally stacked planes (see Fig. 9).
IV Heterogeneous nucleation
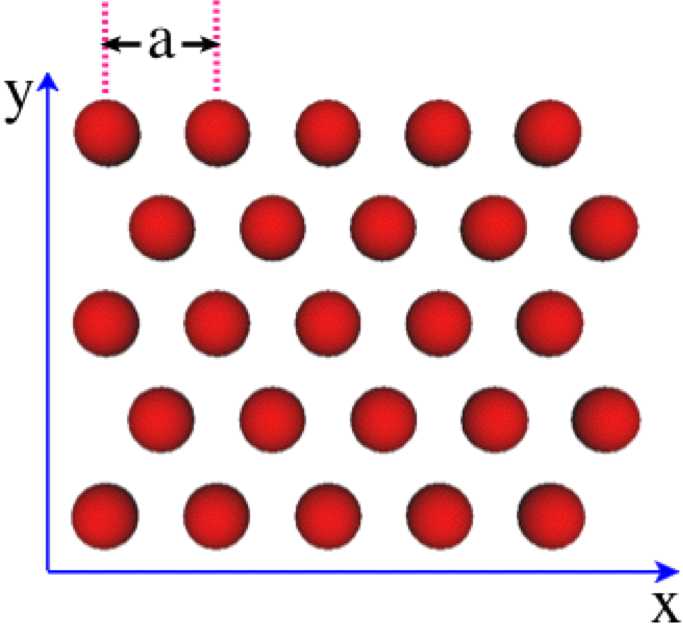
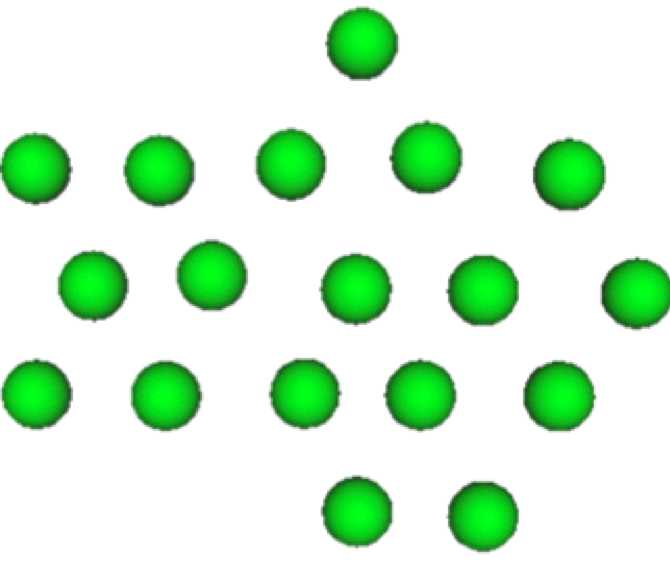
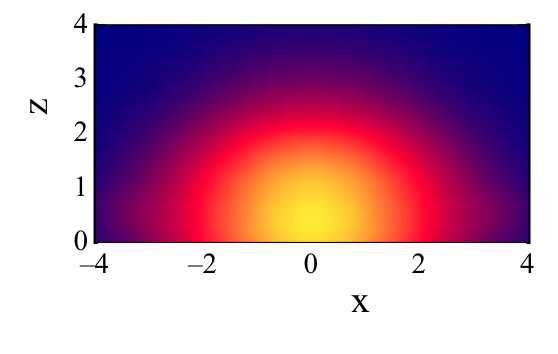
To study heterogeneous nucleation, an impurity of Lennard-Jones particles in a hexagonal plane is placed into the system, where and are the number of particles in the and directions (see Fig. 10). The direction is perpendicular to the plane of the impurity. The positions of the particles in the impurity are fixed during the simulation. The impurity is characterized by its lattice spacing and total area . The efficiency of the impurity is measured by the height of the nucleation barrier , which we compute as before using the umbrella sampling method.
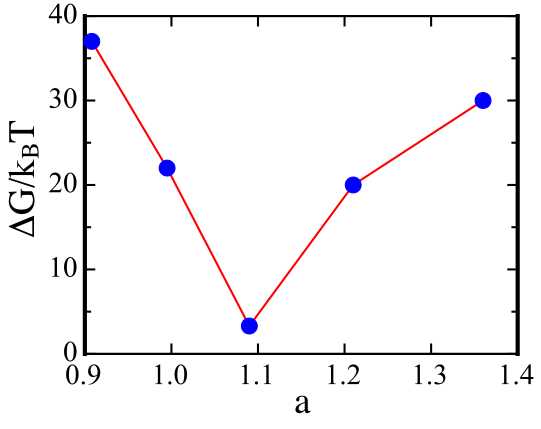
If the system is crystallized homogeneously after a quench to , the position of the first peak of the radial distribution function is . We take the value as the lattice spacing of the solid phase. The temperature is quenched to , which corresponds to the region where classical nucleation applies in the absence of an impurity (see Sec. III). At the free energy barrier of homogeneous nucleation is in the absence of an impurity with . In all of our simulations of heterogeneous nucleation, nucleation always occurs on the impurity if it is present.
| lattice spacing | ||
|---|---|---|
| 0.908 | 37 | |
| 0.995 | 22 | |
| 1.090 | 3.3 | |
| 1.218 | 20 | |
| 1.360 | 30 |
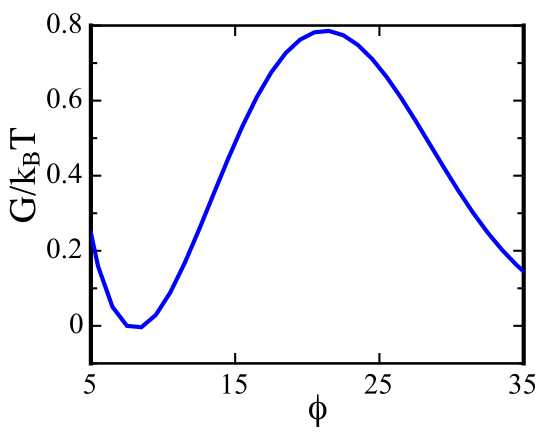
We studied the dependence of the nucleation barrier on the lattice spacing for fixed area , which is chosen to be , the area of a impurity with lattice spacing . The impurities have different values of and so that their lattice spacings are less than and greater than (see Table 3). The free energy barrier is lowest at (see Fig. 11), that is, an impurity is most efficient in lowering the nucleation barrier if its lattice spacing is the same as that of the crystalline phase.
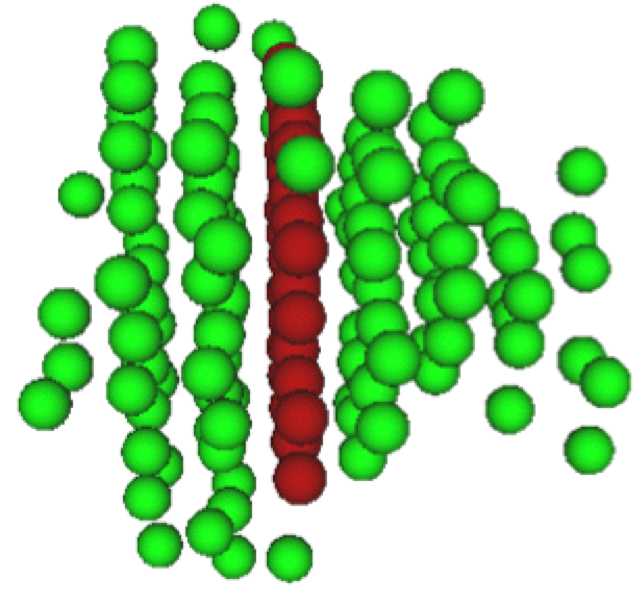
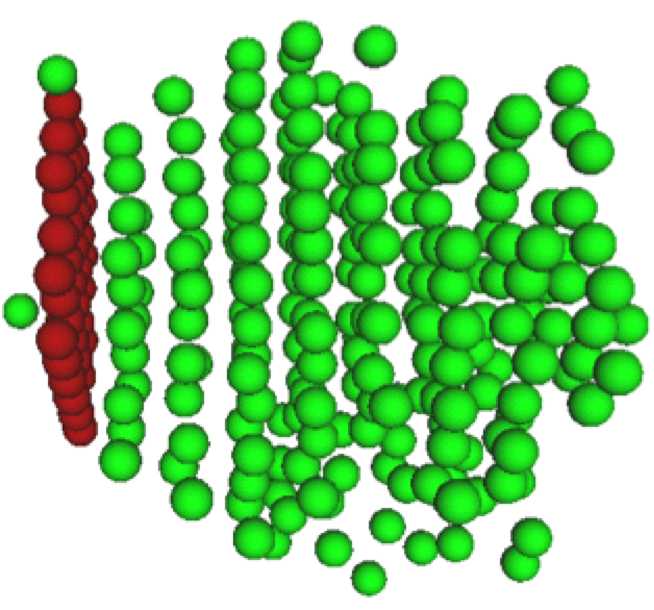

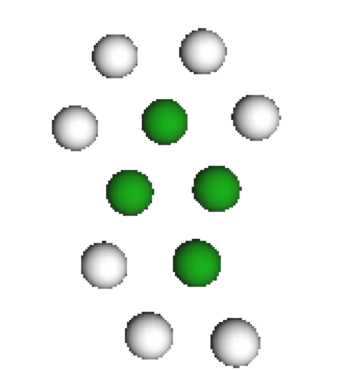
By investigating snapshots of the nucleating droplets we found that in general the nucleating droplet forms on both sides of the impurity for (see Fig. 12(a)). For , once the impurity initiates nucleation, it becomes preferential to add particles on the newly formed droplet than on the impurity, making the droplet grow into the bulk instead of wetting the other side of the impurity. In both cases, the nucleating droplets grow on the impurity by forming layered planes, with each layer being parallel to the plane of the impurity. Inside each layer, the solid-like particles form a hexagonal structure (Fig. 13). The lattice spacing of the nucleating droplets is approximately irrespective of the lattice spacing of the impurity. That is, once a nucleus is formed, its lattice spacing becomes very close to the optimal spacing and the droplets form on the newly formed layer rather than on the impurity.
A simple way to characterize how the nucleating droplet wets the impurity is to measure its profile. In Fig. 14 we show the number of particles in the nucleating droplet as a function of , where is the distance of a particle from the plane of the impurity. The sharp peaks of indicates that the nuclei form a layered structure. For gradually drops to zero as increases. In contrast, is almost flat for . The protrusion of the nuclei into the bulk for is consistent with the fact that the nucleating droplet wets the impurity at and grows into the bulk when .
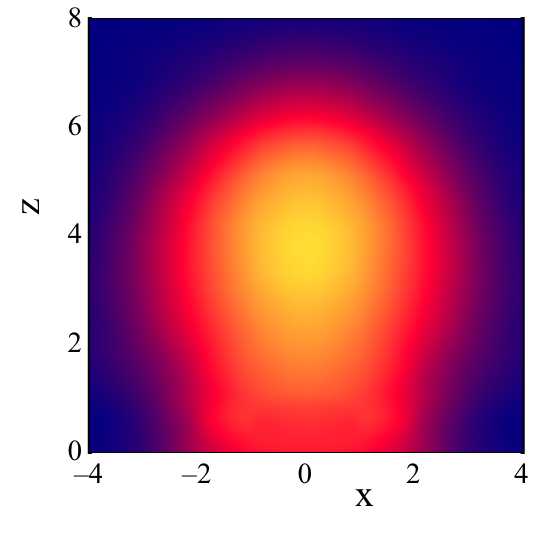
Contour plots of the profile were obtained by projecting the density of the nuclei onto the - plane. Figure 15 shows contour plots for impurities with and respectively. The smaller contact angle for the impurity with is consistent with the fact that it is preferential to nucleate on the impurity when its lattice spacing is optimal.
V Conclusions
We have studied the homogeneous and heterogeneous nucleation of Lennard-Jones liquids using the umbrella sampling method. By analyzing the symmetries of the nucleating droplets, we found that for deep quenches the nucleating droplets are more diffuse and anisotropic with no well defined core or surface; the nucleating droplets and the corresponding liquid environment form randomly stacked hexagonal planes. These results are consistent with the spinodal nucleation picture. For heterogeneous nucleation, we found that the droplets grow on an impurity of hexagonal plane by layers, and the solid-like particles in each layer form a hexagonal structure. For fixed area of the impurity, the free energy barrier of nucleation is a minimum when the lattice spacing of the impurity is equal to , the lattice spacing of the equilibrium crystalline phase. The lattice spacing of the nuclei is equal to even when the lattice spacing of the impurity is different than , and it is favorable for the nucleating droplets to grow into the bulk instead of wetting the impurity.
References
- (1) Ju-xing Yang, H. Gould, and W. Klein, Phys. Rev. Lett. 60, 2665 (1988).
- (2) W. C. Swope and H. C. Andersen, Phys. Rev. B 41, 7042 (1990).
- (3) M. Matsumoto, S. Saito, and I. Ohmine, Nature 416 409 (2002).
- (4) J. Delhommelle, J.-M. Leyssale, and C. Millotc, J. Chem. Phys. 122, 104510 (2005).
- (5) J. Yang, H. Gould, W. Klein, and R. Mountain, J. Chem. Phys. 93, 711 (1990).
- (6) F. J. Cherne, M. I. Baskes, R. B. Schwarz, S. G. Srinivasan, and W. Klein, Modelling Simul. Mater. Sci. Eng. 12, 1063 (2004).
- (7) Y. C. Shen and D. W. Oxtoby, J. Chem. Phys. 105, 6517 (1996).
- (8) S. Alexander and J. McTague, Phys. Rev. Lett. 41, 702 (1978).
- (9) W. Klein, Phys. Rev. E 64, 56110 (2001).
- (10) W. Klein and F. Leyvraz, Phys. Rev. Lett. 57, 2845 (1986).
- (11) E. Thune, Th. Cabioc’h, M. Jaouen, and F. Bodart, Phys. Rev. B 68, 115434 (2003).
- (12) A. Schofield, P. N. Pusey, D. A. Weitz, U. Gasser, and E. R. Weeks, Science 292, 258 (2001).
- (13) D. W. Heermann and W. Klein, Phys. Rev. Lett. 50, 1062 (1983).
- (14) F. Trudu, D. Donadio, and M. Parrinello, Phys. Rev. Lett. 97, 105701 (2006).
- (15) S. Toxvaerd, J. Chem. Phys. 117, 10303 (2002).
- (16) E. Saridakis, N. E. Chayen, and R. P. Sear, Proc. Nat. Acad. Sci. (US) 103, 597 (2006).
- (17) Yadong Yin and Younan Xia, Advanced Materials 13, 267 (2000).
- (18) P. W. Wilson, A. F. Heneghan, and A. D. J. Haymet, Proc. Nat. Acad. Sci. (US) 99, 9631 (2002).
- (19) S. Auer and D. Frenkel, Phys. Rev. Lett. 91, 015703 (2003).
- (20) A. J. Page and R. P. Sear, Phys. Rev. Lett. 97, 065701 (2006).
- (21) D. Saylor, J. A. Warren, L. Gránásy, and T. Pusztai, Phys. Rev. Lett. 98, 035703 (2007).
- (22) Mario Castro, Phys. Rev. E 67, 035412 (2003).
- (23) Zhen-Gang Wang, Jiafang Wang, and Yuliang Yang, J. Chem. Phys. 121, 1105 (2004).
- (24) H. Vehkamäki, A. Lauri, E. Zapadinsky, and M. Kulmala, J. Chem. Phys. 125, 164712 (2006).
- (25) Y. Djikaev and E. Ruckenstein, J. Chem. Phys. 125, 244707 (2006).
- (26) J.-P. Hansen and L. Verlet, Phys. Rev. 184, 151 (1969).
- (27) S. Auera and D. Frenkel, J. Chem. Phys. 120, 3015 (2004).
- (28) J. S. van Duijneveldt and D. Frenkel, J. Chem. Phys. 96, 4655 (1992).
- (29) G. Torrie and J. Valleau, Chem. Phys. Lett. 28, 578 (1974).
- (30) G. Torrie and J. Valleau, J. Comp. Phys. 23, 187 (1977).
- (31) D. Frenkel, P. R. ten Wolde, and M. J. Ruiz-Montero, J. Chem. Phys. 102, 9932 (1996).
- (32) A. Coniglio and W. Klein, J. Phys. A 13 2775 (1980).
- (33) D. R. Nelson, P. L. Steinhardt, and M. Ronchetti, Phys. Rev. B 28, 784 (1983).
- (34) Because a system of Lennard-Jones particles does not have a bcc or hcp phase, we instead prepared systems with the desired symmetry and then randomly displaced each particle by an amount , where and is a uniform random number between 0 and 1.
- (35) L. Monette, W. Klein, and M. Zuckermann, J. Stat. Phys. 66, 117 (1992).
- (36) J. W. Cahn and J. E. Hilliard, J. Chem. Phys. 31, 688 (1959).
- (37) K. Binder, Phys. Rev. A 29, 341 (1984).
- (38) D. W. Heerman, W. Klein, and D. Stauffer, Phys. Rev. Lett. 49, 1262 (1982).
- (39) W. Klein, H. Gould, N. Gulbahce, J. B. Rundle, and K. Tiampo, Phys. Rev. E 75, 031114 (2007).
- (40) C. Unger and W. Klein, Phys. Rev. B 29, 2698 (1984).
- (41) We can determine the temperature-dependence of the mean number of particles in the nucleating droplet near the spinodal from scaling arguments (see Ref. KleinPRE07, ). The density of the fundamental clusters near the spinodal is , where , the Ginzburg parameter , and is the effective range of the interaction. Because the nucleating droplet is formed by the coalescence of fundamental clusters KleinPRE07 , scales as , where the correlation length scales as . We conclude that diverges near the spinodal as in three dimensions, and remains constant (or diverges logarithmically) in two dimensions. The radius of gyration scales as and diverges near the spinodal in all dimensions. Note that these scaling arguments do not predict how close the system has to be to the spinodal for the predicted behavior to be observed and assume that the nucleating droplet is spherical on average.