Keck spectroscopy and Spitzer Space Telescope analysis of the outer disk of the Triangulum Spiral Galaxy M33
In an earlier study of the spiral galaxy M33, we photometrically identified arcs or outer spiral arms of intermediate age (0.6 Gyr 2 Gyr) carbon stars precisely at the commencement of the HI-warp. Stars in the arcs were unresolved, but were likely thermally-pulsing asymptotic giant branch carbon stars. Here we present Keck I spectroscopy of seven intrinsically bright and red target stars in the outer, northern arc in M33. The target stars have estimated visual magnitudes as faint as V 25m. Absorption bands of CN are seen in all seven spectra reported here, confirming their carbon star status. In addition, we present Keck II spectra of a small area 0.5 degree away from the centre of M33; the target stars there are also identified as carbon stars. We also study the non-stellar PAH dust morphology of M33 secured using IRAC on board the Spitzer Space Telescope. The Spitzer 8 image attests to a change of spiral phase at the start of the HI warp. The Keck spectra confirm that carbon stars may safely be identified on the basis of their red JKs colours in the outer, low metallicity disk of M33. We propose that the enhanced number of carbon stars in the outer arms are an indicator of recent star formation, fueled by gas accretion from the HI-warp reservoir.
Key Words.:
galaxies: evolution – galaxies: spiral – galaxies: individual (M33 NGC598)1 Introduction
Like the two dominant spiral galaxies in the Local Group (MW and M31), M33 is known to have a prominent warp. This warp is spectacular in the HI-21cm line: at many points the line of sight intersects the disk twice. In M33 the warping commences at a radius of 5 kpc and at a radius of 10 kpc the rotation axis of neutral hydrogen gas is inclined by some 40 degrees to the axis of the inner disk, as revealed by the tilted ring model of Rogstad et al. (rog76 (1976)). More recently, Corbelli and Schneider (corbellischneider97 (1997)) confirm that at a radius of 5 kpc (about 3 disk scalelengths), the HI distribution in M33 shows a distinct change in inclination.
Warps may be tidally generated when companions are obviously present; but in galaxies such as M33 which do not have any close companions, warping and gas infall may be inextricably linked (for a review, see section 7 in Binney binney92 (1992)).
In this paper, we focus our attention on the outer warped disk of M33, and in particular on its red stellar population. If the HI-warp in M33 is induced by the infall of gas, then one interesting confirmation would be the presence of a red intermediate age (0.6 Gyr - 2 Gyr) population of carbon stars at the locale of the HI-warp. Indeed, C-stars are expected to be associated with recent star formation. Tsalmantza et al. (2006) have found them towards the center in the LMC and associated with spiral arms in M31, the loci of star formation. In the SMC and in M33, their sample size was too small to trace their radial distribution, but Rowe et al. (2005) found them also relatively more abundant in the outer parts of M33.
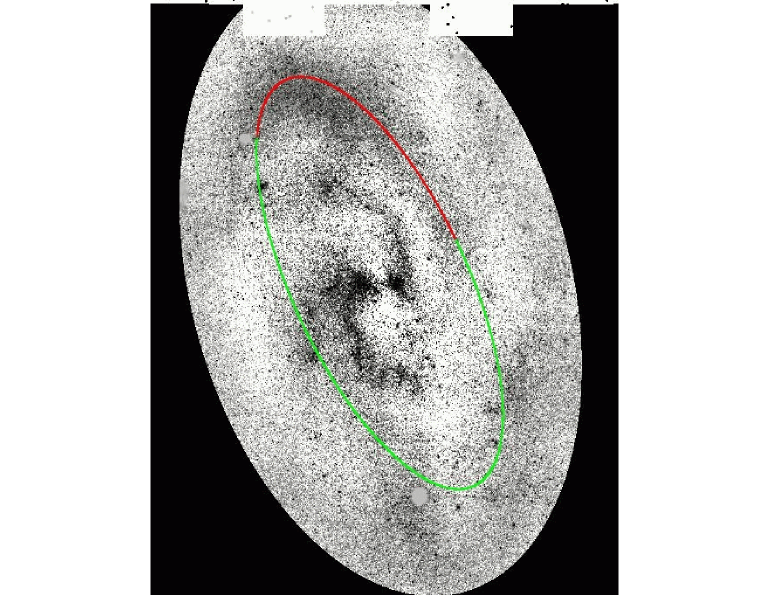
In an earlier study (Block et al. blocketal04 (2004)), we presented near-infrared images of M33 from a deep subsample of 2MASS, in which individual stars were unresolved. The deep 2MASS images revealed remarkable arcs or spiral arms of red stars in the outer disk; the northern arc subtends in azimuth angle and in width (see Figure 1). The northern arc is dominant although a very faint southern counterpart arc, forming a partial ring, can also be seen. The arcs lie at a radius of 2-3 disk scale lengths (in V, the disk scale length is 6 arcmin; Ferguson et al. fergusonetal06 (2006)). Surprisingly, Fourier analysis of the deep 2MASS images showed that the dominant peak did not correspond to any inner spiral arm morphology seen in optical photographs, for which M33 is so famous. Rather, the peak corresponds to the giant outer red arms in the 2MASS images (see Figure 1).
Block et al. (blocketal04 (2004)) noted that the very red colour of the arcs could not be due to extinction by dust grains. Freedman, Wilson and Madore (freedmanetal91 (1991)) derive a mean value for the total colour excess for the Cepheids in M33 of E(B-V) = 0.10 0.09 mag, which includes both foreground (Milky Way) and internal M33 extinction. The Ks-band extinction A(Ks) is approximately one-tenth that in the optical (Rieke & Lebofsky rieke85 (1985)), so the dust extinction at Ks is only 0.03 mag. Extinction by dust grains cannot generate the very red colours found in the arcs in the outer disk of M33, where the extinction at Ks would be even smaller.
Our methodology differs from conventional ways of photometrically identifying carbon stars using intermediate band filters (V, I, 77, 81) as presented by Rowe et al. (roweetal05 (2005)) for M33, using the Canada-France-Hawaii Telescope (CFHT). With such a method, one needs a large enough telescope to resolve individual stars. The (V, I, 77, 81) photometric method was pioneered by Cook, Aaronson and Norris (cooketal86 (1986)); another viable set of filters to identify carbon stars are the Sloan filters. Demers & Battinelli (demers05 (2005)) used the three Sloan filters g, r, i, but again resolution of stars is crucial. Demers and Battinelli (2005) also used the CFHT with the Megacam camera to identify 361 new C-star candidates in M31.
Some investigators (e.g. Tsalmantza et al. tsalm06 (2006)) have focussed their attention on identifying carbon stars on the basis of the red J-Ks tail (see Figures 1, 4, 6 and 9 in Tsalmantza et. al. 2006). The usefulness of such a methodology is that near-infrared all sky surveys secured with moderate sized telescopes can potentially be exploited to identify carbon stars in spiral galaxies well outside our Local Group, where individual stars are not resolved.
The arcs seen in Figure 1 are identified on the basis of their red JKs colours. They lie around 15 arcmin in radius, between 12 and 18 arcmin, or 2-3 disk scale lengths, whereas the actual disk truncates at 5 scale lengths (Ferguson et al. fergusonetal06 (2006)). They are therefore like spiral arms in the outer disk, as seen also by Rowe et al. (roweetal05 (2005)). The latter authors have identified the C and M-type stars in the AGB population, and traced the Carbon star to M star ratio (C/M) as a function of radius. This ratio is not only an index of age but also of metallicity, increasing in metal-poor regions. Indeed, a C-star requires that the O-dominated surface be reversed to C-dominated, due to the dredged-up material from the star interior. This is easier to do when the surface is metal-poor. Rowe et al. (roweetal05 (2005)) show that the C/M ratio increases with radius and then flattens beyond 20 arcmin (or 5 kpc), indicating a metallicity gradient covering most of the disk, including the outer spiral arcs.
Our JHKs photometric method uses the fact that the colour of the northern arc extended to very red colours of JKs. It was argued that while very old M giants of solar abundance can indeed reach JKs 1 (see e.g. Figure 2 in Bessell and Brett besselbrett98 (1998)) and even redder if they are super-metal-rich (see Frogel and Whitford frogelwhitford87 (1987)), stars with JKs in low-metallicity regions cannot be M-giants but rather, very red carbon stars. There is a strong radial metallicity gradient in M33 (-0.16 dex/kpc in O/H, over 4-5kpc, see Beaulieu et al. beaulieu06 (2006)). Beaulieu et al. have confirmed this metallicity gradient, already found in HII regions, B-supergiants or planetary nebulae, by detecting beat Cepheids in M33. An excellent discussion of the metallicity gradient in M33 may be found in Magrini, Corbelli and Galli (magrini07 (2007)). The outer regions of M33 are relatively metal-poor, and solar abundance is reached only in the very central domain of M33.
In this paper, we examine the robustness of our photometric technique as a stepping stone to exploring the outer disks of more distant spiral galaxies, wherein individual carbon stars may be present, but unresolved. To this end, we need follow-up spectroscopy. Here we discuss exploratory Keck I and Keck II spectroscopic observations of a few of the reddest and intrinsically brightest stars in the northern arc. All seven of our target candidates have very red JKs colours and should be confirmed to be TP-AGB carbon stars if our methodology is correct.
2 Observations
As a prelude to conducting the Keck spectroscopy, we imaged a section of the northern plume of M33 with the Hale 5m reflector at Mount Palomar. We used the 20482048 array near-infrared camera WIRC (Wilson et al. wilsonetal03 (2003)), to resolve individual stars. The field of view is with 0.25 arcsec pixels. The seeing FWHM is 0.8′′ in J, and 0.7 ′′ in the Ks band. The telescope was centered at 01h34m28.1s, +30d54m00s (J2000). The total integration time was 9 minutes, reaching a limiting surface brightness at Ks of 23.2 mag per pixel2, or 20.2 mag per arcsec2 (44 pixels gives 1 square arsec). The point source photometry limits are 19.0, 18.0, 16.9 mag in JHKs, respectively.
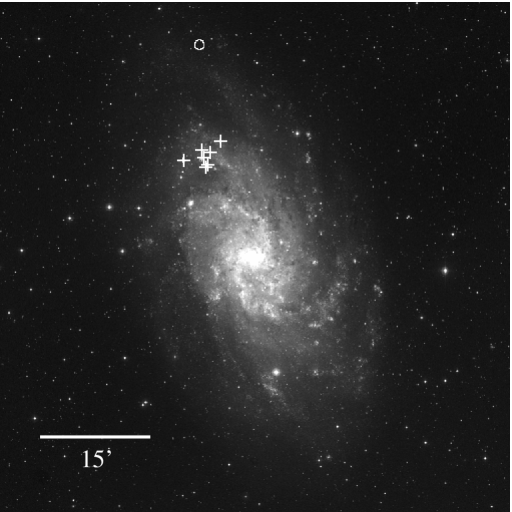
Table 1 lists the magnitudes and colours of 7 candidate targets in the outer northern arc seen in Block et al. (blocketal04 (2004)). Their positions are indicated by plus signs (+) in Figure 2. In deriving the absolute magnitudes in Table 1, we assume a distance modulus to M33 of 24.64m, corresponding to a linear distance of 840 kpc (Freedman et al. freedmanetal91 (1991)). Noting that E(BV) = 0.10 0.09 mag (Freedman et al. freedmanetal91 (1991)), and that the Ks-band extinction is approximately one-tenth that in the optical (Rieke and Lebofsky rieke85 (1985)), we use a dust extinction correction for the Ks apparent magnitudes of 0.03 mag.

| Star | J | H | Ks | J-Ks | J-H | H-Ks | M |
|---|---|---|---|---|---|---|---|
| 1 | 17.96 | 16.76 | 15.91 | 2.05 | 1.20 | 0.85 | -8.74 |
| 2 | 18.49 | 17.09 | 16.32 | 2.16 | 1.40 | 0.77 | -8.33 |
| 3 | 19.61 | 18.04 | 16.66 | 2.96 | 1.57 | 1.39 | -7.99 |
| 4 | 18.57 | 17.26 | 16.49 | 2.08 | 1.31 | 0.77 | -8.16 |
| 5 | 18.82 | 17.35 | 16.54 | 2.28 | 1.47 | 0.81 | -8.11 |
| 6 | 18.42 | 17.24 | 16.46 | 1.97 | 1.18 | 0.78 | -8.19 |
| 7 | 18.37 | 16.91 | 15.82 | 2.55 | 1.46 | 1.10 | -8.83 |
Spectra of these carbon star candidates were obtained on 2004 Aug 17 UT with the Low Resolution Imaging Spectrograph (LRIS; Oke et al. okeetal95 (1995)) attached to the Keck I telescope. The aperture mask slitlets had widths and lengths corresponding to 12 and 115, respectively. The 600 groove mm-1 grating gave a resolution of Å per projected slit width and a spectral range from 6825 to 9415 Å for slitlets near the centre of the mask. The stars were dithered along the slitlets between the 2 exposures, each 600 seconds long. The spectrum from each slitlet was extracted and reduced independently, the wavelength calibration being derived from airglow lines. An approximate flux calibration was produced by observing the spectrophotometric standard star G191B2B (Massey et al. masseyetal88 (1998)) in one of the slitlets near the centre of the mask and transfering the system response function found for this slitlet to the same wavelength intervals for the other slitlets. This approach neglects any differential vignetting or other field-dependent variations in response, but these are expected to be small for LRIS in any case.
Also secured with the Keck II telescope were spectroscopic observations of an area 0.5 degree away from the centre of M33 (circled in Figure 2). Near-infrared imaging with the Hale 5m reflector at Palomar had revealed stars with very red JKs colours in this outer low metallicity region. The data were obtained on 2004 July 18 UT using the Echellette Spectrograph and Imager (ESI; Sheinis et al. sheinisetal02 (2002)) on the Keck II telescope. We used the echellete mode which allows a wavelength coverage from 3900 to 11060 Å and yields a dispersion of 56 km s-1 with the 1′′ slit. The spectra were obtained at parallactic angle near transit, and the total exposure was 1200 seconds for each object.
The spectra were reduced using a combination of J. Prochaska’s IDL reduction package, ESIRedux, and the echelle tasks in IRAF. The spectra were flux calibrated using spectrophotometric standards from Massey et al. (masseyetal88 (1998)) also observed with the slit at the parallactic angle.
Observations of M33 were also made using all four bands of the Infrared Array Camera (IRAC) mounted on the Spitzer Space Telescope (Werner et al. werner04 (2004); Gehrz et al. gehrz07 (2007)) on 2005 January 21 as part of a Spitzer Guaranteed Time Observing Program (Program ID 5) conducted by Spitzer Science Working Group member R. D. Gehrz.
The IRAC instrument (Fazio et al. fazioetal04 (2004)) is composed of four detectors that operate at 3.6 (channel 1), 4.5 (channel 2), 5.8 (channel 3) and 8.0 (channel 4). All four detector arrays are 256256 pixels in size with mean pixel scales of 1.221, 1.213, 1.222, and 1.220 respectively. The IRAC filter band centers are at 3.548, 4.492, 5.661 and 7.87 and the adopted zero magnitude fluxes are 280.9 Jy (channel 1), 179.7 Jy (channel 2), 115.0 Jy (channel 3) and 64.1 Jy (channel 4) as described in the IRAC Data Handbook V3.0 (see Gehrz et al. 2007).
The M33 mapping sequence consisted of 438 frames per channel, including a 3 point 1/2 pixel dither for each map position. The integration time was 12 seconds per frame.
The raw Spitzer data were processed and flux calibrated with version 11.0.2 of the Spitzer Science Center (SSC) pipeline. Post-BCD processing was carried out using an artifact mitigation algorithm developed by Carey (carey05 (2005)) and the 2005 September 30 Linux version of the SSC MOPEX software (Makovoz and Khan makovozkhan05 (2005)). The artifact mitigation algorithm alleviates the effects of muxbleed, column pulldown/pullup, electronic banding, and bias variations between the images. Three additional corrections were implemented with MOPEX: Background Matching, Outlier Detection, and Mosaicing. Background matching was performed by minimizing the pixel differences in overlapping areas with respect to a constant offset computed by the program. Cosmic rays and other outliers were detected and eliminated with the Outlier Detection module. In the final step the images were reinterpolated to a pixel scale of approximately 1.224 and mosaiced to create a final image spanning approximately 1.2∘ x 1.4∘.
3 Analysis of the Keck I and Keck II spectra
Even for nearby M33, identification of carbon stars by spectroscopic means necessitates the use of the largest of groundbased telescopes. The first carbon star to be spectroscopically confirmed in M33 dates back to the work of Mould and Aaronson (mouldaaronson86 (1986); Figure 7) who used the Hale 5m reflector at Palomar. The individual V magnitudes of each target star in Table 1 are estimated, from their JHKs colours, to be fainter than 22m, with one star (star 3 in Figure 3) as faint as V 25m. The spectra sample only the bright end of the Ks-band luminosity function for carbon stars, which ranges from MK -6 to -9. Much longer integration times would be needed for intrinsically fainter carbon stars.
Carbon stars show a plethora of molecular spectral features, including the C2 Swan bands and the CN bands. The presence of the hugely dominant CN bands shortward of 7000Å and 8000Å and longward of 9000Å are indicated by tick marks in Figure 3 and unambiguously reveal the C-star status for each of these seven stars.
4 Analysis of the ISM dust morphology in M33


The carbon star arcs are clearly seen in JHKs images, but the global ISM dust morphology can also be effectively traced at 8. The reason is as follows: as carbon stars pulsate, their atmospheres become extended and matter may reach a temperature low enough for some elements to condense into very small particles (“star dust”). An outflow develops as a result of radiation pressure and the star is progressively surrounded by an expanding circumstellar shell of dust and gas (Le Bertre et al. lebertreetal03 (2003)). Emission from the shells of both carbon stars and also dust from O-rich shells is detected at 8 (Buchanan et al. buchanan06 (2006)). Buchanan and co-workers note that “most of the C-rich stars have spectra that are dominated by warm dust” and these authors show that stars such as MSXLMC587 (O-rich) and MSXLMC1488 (C-rich) both show emission in the IRAC 8 window (see their Figure 2, for example). The trend is for the flux to climb from longer ( 38) to the shorter wavelength of 8. As an interesting aside, one does not need high ultraviolet excitation to produce infrared emission features: stars as cool as 3000 K can generate PAH features, for example, as discussed by Li and Draine (draine02 (2002)).
Carbon stars are one of the most important contributors to the replenishment of dust in the interstellar medium. Our IRAC image of M33 at wavelength 8 offers unprecendented insight into the global ISM dust morphology. Deprojection of our IRAC images of M33 were facilitated by adopting log R25 = 0.23(RC3) where R is the ratio of the major to minor axis, and a position angle of 23 degrees (Deul and vd Hulst deul87 (1987), Regan and Vogel regan94 (1994)). In order to remove the small contribution of starlight (at the end of the Rayleigh-Jeans tail) from the 8 image, we subtract a scaled version of the IRAC 3.6 map. As in Block et al. (blocketal06 (2006)), we generate a ‘non-stellar’ pure dust map from 8 - 3.6, where (a constant) assumes the value of 0.25. This subtraction removes the contribution from stellar photospheres and leaves only the emission from dust grains, which trace the ISM morphology. The major uncertainties entering into the precise value of are, firstly, the extended aperture correction, and secondly, the exact mid-IR colour of the stellar populations which one is modeling by scaling the 3.6 emission. The second correction introduces uncertainties of order 0.05 mag or perhaps larger (Ashby, private communication). A slightly smaller value of (0.232 instead of 0.25) has been suggested by Helou and co-workers (helou04 (2004)), but our use of a slightly higher photospheric contribution (at a level of 2 percent) is well within the correction uncertainties; the choice of is only accurate at the 10-15 percent (and not one or two percent) level.
A complimentary method could, of course, be to focus our attention on photospheric emission, and not ISM dust emission. At the shorter IRAC wavelength of 3.6, carbon star photospheres would be detected, but so would the photospheres of O-rich stars. A full presentation and analysis of all IRAC images of M33 will be presented elsewhere (Gehrz et al., in preparation). In this paper, we confine our attention to the dust grain morphology, as we did for the Andromeda Spiral in Block et al. (blocketal06 (2006)).
The Fourier method has been extensively discussed in a number of papers (e.g., Considère and Athanassoula consat82 (1982); Puerari and Dottori puedot92 (1992), among others). In the Fourier method, an image is decomposed into a basis of logarithmic spirals of the form =. The Fourier coefficients can be written as
Here, , and are the polar coordinates, represents the number of the arms, is related to the pitch angle of the spiral by =, and is the distribution of light of a given deprojected galaxy, in a (, ) plane. is a normalization factor written as
In practice, the integrals in are calculated from a minimum radius (selected to exclude the bulge where there is no information of the arms) to a maximum radius (which extends to the outer limits of the arms in our images).
The inverse Fourier transform can be written as
where
and is a high frequency filter used to smooth the spectra at the interval ends (see Puerari and Dottori puedot92 (1992)), and it has the form
where is the value of for which the amplitude of the Fourier coefficients for a given is maximum. The chosen interval ends (= and =), as well as the step-size =, are suitable for the analysis of galactic spiral arms.
Firstly, the Fourier mode in the 8 image also does not correspond to the inner spiral arm morphology, but rather shows a local peak at a radius of 14′, just longward of 2 scalelengths. This is precisely where the outer red arcs were detected by Block et al. (blocketal04 (2004)).
Another intriguing fact is that there is a distinct change of phase in the ISM dust morphology at 3 disk scale-lengths (18′), which is precisely the region of the outer boundaries of the “arcs” or outer spiral arms, where Corbelli and Schneider (corbellischneider97 (1997)) find the prominent HI-warp.
We believe it fully consistent to propose that the very red, and relatively metal-poor stars have recently been formed by gas infall which is inextricably tied to its strong HI-warp. It seems highly plausible that fresh low-metallicity gas is being fed to the host galaxy M33. The outer disk from which mass is accreted is inclined to the inner disk of M33, and has a different angular momentum, as revealed by the tilted disk model.
Our conclusions are compatible with the work of Rowe et al. (roweetal05 (2005)) who published a spatial map of the C/M-star ratio, that reveals conspicuous maxima at exactly the positions of what we call “arcs”, or outer spiral arms. They interpret the radial distribution of the C/M ratio uniquely as a metallicity indicator, and conclude that there is a strong metallicity gradient up to 5kpc (20 arcmin) and then the gradient flattens out. Their interpretation is in terms of the viscous disk model, where the outer shear of the rotation curve produces mixing in the outer parts, able to wash out abundance gradients.
The viscous disk model certainly applies to M33 to some extent, and is certainly a needed ingredient of the external gas accretion model. The flattening of the metallicity gradient could be linked to the accretion of low-metallicity gas. The viscous accretion disk model has been frequently invoked to build exponential galaxy disks, either with viscous torques to exchange angular momentum, or with gravitational torques due to spiral arms or bars. In the latter case the equivalent viscosity is called ”gravitational viscosity” (e.g. Lin & Pringle linpringle87 (1987)). If the viscous and star formation time scales are of the same order, then the resulting stellar disk has an exponential distribution independent of the disk rotation law and of the assumed viscosity prescription. The expected metallicity gradient is also exponential, as computed by Tsujimoto et al. (tsuji95 (1995)). As for M33, it is highly possible that the “viscous disk” model applies until a radius of 5kpc (20 arcmin), i.e. just outside the arcs, and is the mechanism with which the accreted gas coming from the warped component is consumed into stars and disk formation. The optical disk is exponential up to this radius.
5 Conclusion
We have confirmed, through Keck spectroscopy of individual stars, the presence of an enhanced abundance of carbon stars in the outer spiral arms in M33, in particular in the two “arcs” identified previously from their red colour (Block et al. 2004). Our conclusions are in very good agreement with the recent work of Rowe et al. (2005), who have produced a spatial map of the C/M-star ratio in M33 showing the conspicuous outer arms. We also see the outer spiral arms in the Fourier m=2 component of the Spitzer 8 dust emission image. These arms correspond to the radius where the HI-21cm warp starts, and we propose an interpretation in terms of recent star formation, fueled from the gas accreted from this outer reservoir. A very similar conclusion, in terms of M33 accreting gas, has recently been reached by Magrini, Corbelli and Galli (magrini07 (2007)), on the basis of O/H, S/H and [Fe/H] abundances in the Triangulum Spiral Galaxy M33.
The HI gas reservoirs in the outer parts of galaxies are observed outside nearly all spiral disks (Sancisi sancisi83 (1983)). Their conspicuous warped morphology, even in the absence of any perturbation or companion, implies that this gas is being almost continuously accreted, with a different angular momentum than that of the inner disk (e.g. Binney 1992). Keres et al. (keresetal05 (2005)) discuss cold gas accretion along filaments in the cosmic web. Accreting systems in gas need not show any signs of accretion in stars, such as the presence of tidal tails, stellar loops or close companions.
The implications of the presence of carbon stars in the outer disk of M33 immediately beckons the question of a possible ubiquity of such an intermediate age population in the outer domains of other spiral disks out to the Virgo cluster and beyond.
At hand is the potential to apply our photometric technique of identifying thermally-pulsing asymptotic giant branch carbon stars to more distant spirals on the basis of their red J-Ks colours in low metallicity domains, an approach adopted by other teams such as Tsalmantza et al. (tsalm06 (2006)). It is a sobering thought that it takes a groundbased class 810m telescope to secure individual carbon star spectra in the outer disk of M33, our second closest spiral, in realistic amounts of observing time. Hence the urgent need to identify unresolved sets of carbon stars in distant spiral galaxies, on the basis of colours alone - without resort to resolving such stars first with thirty metre class telescopes, and then imaging them through Sloan or (V, I, 77, 81) filters.
Carbon stars may make an important contribution to the IR luminosity of high-redshift galaxies. Using the Large Magellanic Cloud as a guide, carbon stars are produced in large numbers between ages of about 0.6 and 2 Gyr. Therefore galaxies that undergo a burst of star formation will have their IR light boosted 0.6 Gyr later, and this extra light will die away after about 2 Gyr. We know that star formation in the early universe (Bouwens et al. bouwensetal03 (2003)) was already proceeding at redshift of at least z . There may be an epoch starting about 0.6 Gyr after the onset of star formation in the universe (i.e. at redshifts z ) characterized by large numbers of carbon stars. The dominant output from the carbon stars will be redshifted into the mid-infrared where these stars could double the observed extragalactic flux. Maraston (maraston05 (2005)) indeed proposes the use of carbon stars as an age indicator for high-redshift stellar populations. Instruments like the Mid-Infrared Instrument on board the JWST are needed to image such galaxies in their (rest-frame) 2.2 micron band.
Acknowledgements.
This paper was completed whilst DLB was a Visiting Professor at the Mount Stromlo and Siding Spring Observatories, Canberra; the hospitality of Ken and Margaret Freeman is very warmly acknowledged. DLB and IP are indebted to the Anglo American Chairman’s Fund, Mr. C. Sunter, Mrs. M. Keeton and the Board of Trustees. IP acknowledges support from the Mexican foundation CONACyT under project 35947–E. This paper is based in part on data obtained at the W. M. Keck Observatory, which is operated as a scientific partnership among the California Institute of Technology, the University of California and the National Aeronautics and Space Administration. The Observatory was made possible by the financial support of the W. M. Keck Foundation. This work is also partially based on observations made with the Spitzer Space Telescope, which is operated by the Jet Propulsion Laboratory, California Institute of Technology under a contract with NASA. RDG and CEW were supported by NASA through an award issued by JPL/Caltech. DLB warmly thanks the Vice-Chancellor of the University of the Witwatersrand for the Vice-Chancellor’s Research Award in 2006. DLB also expresses much gratitude to Fani Titi of the TISO Foundation for his stellar support. We thank M. Ashby, P. Wood and S.P. Willner for their input. Finally, we thank the anonymous referee for insightful comments.References
- (1) Beaulieu J-P., Buchler J., Marquette J-B. et al: 2006, ApJ 653, L101
- (2) Bessell, M.S., Brett, J.M. 1998, PASP 100, 1134
- (3) Binney, J.: 1992, ARAA, 30, 51
- (4) Block, D.L., Freeman, K.C., Jarrett, T.H., Puerari, I., Worthey, G., Combes, F., Groess, R. 2004, A&A 425, L37
- (5) Block, D. L., Bournaud, F., Combes, F., Groess, R., Barmby, P., Ashby, M. L. N., Fazio, G. G., Pahre, M. A., Willner, S. P.: 2006, Nature 443, 832
- (6) Bouwens, R.J., Illingworth, G.D., Rosati, P. et al. 2003, ApJ 595, 589
- (7) Buchanan, C.L., Kastner, J.H., Forresst, W.J., Hrivnak, B.J., Sahai, R., Egan, M., Frank, A., Barnbaum, C. 2006, AJ, 132, 1890
- (8) Carey, S. 2005, http://spider.ipac.caltech.edu/ staff/carey/irac artifacts/
- (9) Considere, S., Athanassoula, E.: 1982, A&A 111, 28
- (10) Cook, K.H., Aaronson, M., Norris, J. 1986, ApJ 305, 634
- (11) Corbelli, E., Schneider, S.E. 1997, ApJ 479, 244
- (12) Demers, S., Battinelli, P.: 2005, A&A 436, 91
- (13) Duel, E.R., van der Hulst, J.M.: 1987, A&A Supp, 67, 509
- (14) Fazio, G.G., Hora, J.L., Allen, L.E. et al. 2004, ApJS 154, 10
- (15) Ferguson, A., Irwin, M., Chapman, S., Ibata, R., Lewis, G., Tanvir, N. 2006, astro-ph/0601121
- (16) Freedman, W.L., Wilson, C.D., Madore, B.F. 1991, ApJ 372, 455
- (17) Frogel, J.A., Whitford, A.E. 1987, ApJ 320, 199
- (18) Gehrz, R. D. et al. 2007, Rev. Sci. Instrum. 78, 011302
- (19) Helou, G. et al. 2004, ApJS, 154, 253
- (20) Keres, D., Katz, N., Weinberg, D.H., Davé, R. 2005 MNRAS 363, 2
- (21) Le Bertre, T., Tanaka, M., Yamamura, I., Murakami, H. 2003 A&A 403, 943
- (22) Li, A., Draine, B.T. 2002, ApJ 572, 232
- (23) Lin, D. N. C., Pringle, J. E.: 1987, MNRAS 225, 607
- (24) Magrini, L., Corbelli, E., Galli, D.: 2007, A & A (in press) (astroph/07043187)
- (25) Makavoz, D., Khan, I. 2005, in “Mosaicing with MOPEX” Astronomical Data Analysis Software and Systems XIV, ASP Conference Series, Eds. P. L. Shopbell, M. C. Britton, and R. Ebert, in press
- (26) Maraston, C. 2005, in Multiwavelength mapping of galaxy formation and evolution, Eds. A. Renzini and R. Bender, Springer, Berlin, 290
- (27) Massey, P., Strobel, K., Barnes, J.V., Anderson, E. 1988, ApJ 328, 315
- (28) Mould, J., Aaronson, M. 1986, ApJ 303, 10
- (29) Oke, J.B., Cohen, J.G., Carr, M., Cromer, J., Dingizian, A., Harris, F.H., Labrecque, S., Lucinio, R., Schaal, W., Epps, H., Miller, J. 1995, PASP 107, 375
- (30) Puerari, I., Dottori, H. A.: 1992, A&AS, 93, 469
- (31) Regan, M.W., Vogel, S.N.: 1994, ApJ, 434, 536
- (32) Rieke, G.H., Lebofsky, M.J. 1985, ApJ 288, 618
- (33) Rogstad, D. H., Wright, M. C. H., Lockhart, I. A.: 1976, ApJ 204, 703
- (34) Rowe, J.F., Richer, H.B., Brewer, J.P., Crabtree, D.R. 2005, AJ 129, 729
- (35) Sancisi, R. 1983, Internal Kinematics and Dynamics of Galaxies, IAU Symp. 100, 55
- (36) Sheinis, A.I., Bolte, M., Epps, H.W., Kibrick, R.I., Miller, J.S., Radovan, M.V., Bigelow, B.C., Sutin, B.M. 2002, PASP 114, 851
- (37) Tsalmantza, P., Kontizas, E., Cambrésy, L., Genova, F., Dapergolas, A., Kontizas, M.: 2006, A&A 447, 89
- (38) Tsujimoto, T., Yoshii, Y., Nomoto, K., Shigeyama, T.: 1995, A&A 302, 704
- (39) Werner M.W. et al. 2004, ApJS 154, 1
- (40) Wilson, C.D. 1991, AJ 101, 1663
- (41) Wilson, J.C., Eikenberry, S.S., Henderson, C.P. et al. 2003, Proceedings of the SPIE 4841, 451