Atomic force microscopy (AFM) study of thick lamellar stacks of phospholipid bilayers
Abstract
We report an Atomic Force Microscopy (AFM) study on thick multi lamellar stacks of approx. m thickness (about 1500 stacked membranes) of DMPC (1,2-dimyristoyl-sn-glycero-3-phoshatidylcholine) deposited on silicon wafers. These thick stacks could be stabilized for measurements under excess water or solution. From force curves we determine the compressional modulus and the rupture force of the bilayers in the gel (ripple), the fluid phase and in the range of critical swelling close to the main transition. AFM allows to measure the compressional modulus of stacked membrane systems and values for compare well to values reported in the literature. We observe pronounced ripples on the top layer in the P (ripple) phase and find an increasing ripple period when approaching the temperature of the main phase transition into the fluid Lα phase at about . Metastable ripples with 2 are observed. also increases with increasing osmotic pressure, i.e., for different concentrations of polyethylene glycol (PEG).
Key words: Atomic Force Microscopy; Phospholipid bilayers; Membranes; Elasticity; Compressional Modulus; Ripple Structure
Introduction
There are only few techniques which allow to study structures on the nanometer scale with molecular spatial resolution. Scattering experiments, as, e.g., x-ray or neutron scattering, offer this high resolution but work in reciprocal or ’Fourier’ space, and the phase problem usually inhibits a direct transformation back into real space. The investigation of particular regions in reciprocal space nevertheless gives valuable structural information. By multiplying and stacking the corresponding surfaces or interfaces, these techniques can be made surface sensitive.
Scanning probe microscopic techniques, as Atomic Force Microscopy (AFM) (1) and STM (Scanning Tunnelling Microscopy) on the other hand give high resolution real space pictures but are essentially surface sensitive. The combination of the two techniques is therefore a powerful tool to gain information about bulk and surface structure. In this study, we used AFM to study the surface structure of the uppermost layer of thick lamellar stacks of phospholipid bilayers under excess water and solutions. As is well known, AFM can be used to monitor biological processes under physiological conditions (2) on the cellular (3) and the molecular scale (4). In addition to topographical maps of the sample surface, the local mechanical properties of soft samples can be measured by application of very small loading forces (5, 6, 7, 8, 9, 10). By use of the Hertz model for elastic indentations (11, 12), Young’s modulus can be determined.
Phospholipid membranes have extensively been studied by AFM techniques. AFM was used to reveal information on the morphology and topology of membranes, bilayers, domains (13, 14, 15, 16, 17) and ripple phases, (18) in real time by controlled environments (19, 20, 21). In addition, Fourier Transformation was used to corroborate the periodicity of the ripple structure (21). Single or double bilayers on solid substrates as, e.g., silicon or glass, are usually used for these studies with the drawback that the underlying substrate often influences or evens governs the elastic response.
Multi lamellar stacks of these model membranes are often used particularly in scattering experiments, to maximize the scattering volume and improve signal to noise ratio considerably. Little is known about the surface of the top layer in these stacks because the membrane stacks are often not very stable but easily washed away under excess water thereby making AFM investigations very difficult. But this approach has the advantage that the interaction of the probe and the underlying substrate can be neglected. Furthermore it allows to quantify the forces to compress the stack and probe the stability of the bilayers by determining the rupture limit. This can be done at different temperatures, i.e., in the different phases of the phospholipid membranes, the ripple phase (P) and the fluid Lα phase. This technique might therefore offer a new and independent approach to the elasticity parameters, in particular to the compressional modulus, , of the stacked model membranes as we will show below.
The elastic properties of lipid membranes, in particular in multi lamellar stacks, have mainly been investigated by the analysis of thermal diffuse scattering, i.e., x-ray lineshape analysis (22, 23). This work has led to a detailed understanding of the static properties of thermal fluctuations in lipid membranes and the elasticity properties governing these fluctuations. A recent experiment (24) reported an inelastic neutron scattering study where the dispersion relation of the mesoscopic fluctuation was determined by the neutron spin echo technique. According to linear smectic elasticity theory (25, 26) thermal fluctuations in the fluid phase of the membranes are governed by the free energy functional (Hamiltonian) (25, 26, 27)
| (1) |
where denotes the bilayer bending rigidity, the area in the -plane, the number of bilayers, and the deviation from the average position of the -th bilayer, is the lamellar spacing. and are elastic coefficients, governing the compressional and bending modes of the smectic phase, respectively. Note that the surface tension can usually be neglected because of the boundary conditions, i.e., infinitely large membranes the rims of which are not clamped and small amplitude of the fluctuations 111The deformation of the upper bilayer depends on the intrinsic surface tension and an elastic contribution from the bulk smectic elasticity , in other words there is an effective surface tension and for a more accurate estimate one has to compare and to neglect the surface tension in the Hamiltonian.. and always appear as coupled parameters in scattering experiments and only the use of aligned lipid bilayers allows a separate determination of and (28, 29). In this work we used AFM to get direct access to the compressional modulus of the membrane stacks.
Our AFM experiments were motivated by the inelastic neutron scattering study (24), which reported a soft-mode in the dispersion relation of the long wavelength undulation modes close to . The critical value was found to be Å-1 equivalent to a distance in real space of Å. The relaxation rate of the collective undulations dropped by more than two orders of magnitude at . A possible interpretation is that the well known softening of phospholipid bilayers due to the decrease of the bending modulus of the bilayers, (30) occurs on a particular length scale, only, similar to the freezing of a phonon mode at elastic phase transitions in crystals. To clarify the origin of this particular length scale we investigated the same samples that have been used for the scattering experiments, namely thick highly oriented lamellar membrane stacks on silicon wafers, in the temperature resolved AFM experiments.
Materials and Methods
Atomic Force Microscopy
A commercial AFM (Bioscope, Digital Instruments, Santa Barbara, CA) combined with an Axiomat inverted optical microscope (Zeiss) was used for this study. The optical microscope was used to position the tip above the membranes. Soft silicon nitride cantilevers (Microlever, Park Scientific, Sunnyvale, CA) with Gold reflex coating on the cantilever back side and a spring constant of about were used. The spring constants were estimated from their resonant frequency, which was . The cantilevers had tip semi-angles of . The wafer with the membrane probe was magnetically attached to the microscope object stage. The microscope was resting on a granite plate supported by soft rubber bands attached to the ceiling for vibration isolation. Resistors glued to the bottom of the object stage allowed to heat the object stage and so the probe. A PT100 temperature sensor was mounted on the silicon substrate and recorded the sample temperature during the experiments. Because of the large thermal mass of the sample stage the temperature stability was as good as , the absolute accuracy was better than .
Samples
Multilamellar samples composed of stacks of several thousands of lipid bilayers separated by layers of water, resulting in a structure of smectic A symmetry, have been prepared. DMPC (1,2-dimyristoyl-sn-glycero-3-phoshatidylcholine) was obtained from Avanti Polar Lipids. We then prepared highly oriented membrane stacks by spreading a solution of typically lipid in trifluoroethylene/chloroform (1:1) on 2” silicon wafers (31). The mosaicity of the samples, which is a measure of the alignment with respect to the surface normal of the stacked bilayers, had been determined by rocking scans to a few hundreds of a degree. The samples have been carefully dried and stored for several days in a refrigerator and after that in a freezer. Note that in these conditions the membranes transform in a densely packed sub-gel phase, which has been characterized only recently (32). After warming to room temperature and re-hydrating, the samples then abruptly irreversibly transform into the ripple or fluid phase, respectively, and show the well known reversible sequence of gel, ripple and fluid phase. The temperature of the main phase transition for DMPC is at about . In samples, which had not been stored in freezers before, the membrane film is easily washed away under excess water and no AFM investigation was possible. We argue that the lipid film is stabilized when the border areas, which are not in contact with water or solution, are still in the very stable and dry sub-gel phase. The effect of osmotic pressure has been studied by measuring solutions of (Millipore) water with different concentrations of PEG (polyethylene glycol with a molecular weight of 20000). About of highly pure Millipore water or Millipore/PEG solution was dropped onto the sample for the measurements, covering a sample area of about ( (0.5 cm)2), and the AFM cantilever arm was immersed into the water.
Data Acquisition and Analysis
Using an AFM, the surface is scanned by a nanometer sized tip, which is mounted on an elastic cantilever arm. The size of the tip is in the order of about . The deformation of the cantilever arm is measured and the force constant of the cantilever arms then allows to determine the force (attractive or repulsive) between sample and AFM probe. By defining a threshold, the contact point between sample and tip, and with it the height profile of the sample can be determined. A second mode of operation is to continuously scan the tip over the sample surface and continuously measure the deflection of the cantilever arm. The result is usually displayed in two dimensional map plots.
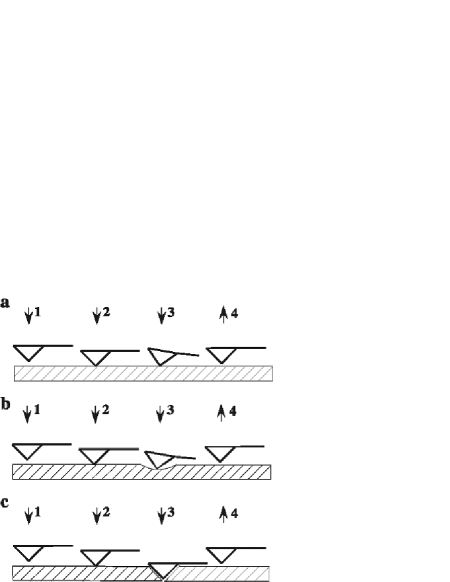
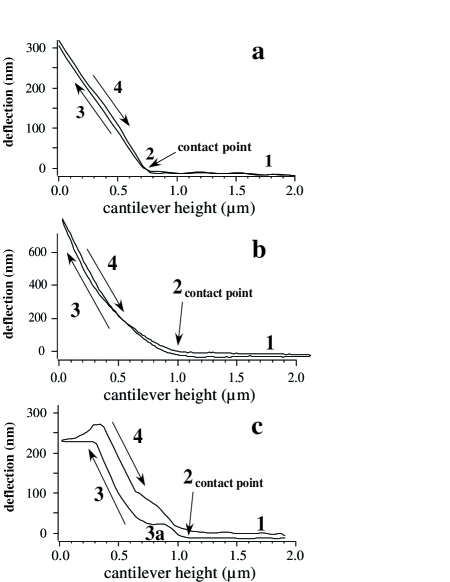
Different scenarii for the interaction and the elastic response between tip and sample can be discussed and are exemplary pictured in Fig. 1. When the tip approaches and comes in contact with an infinite stiff surface in Fig. 1 (a) (a dry membrane stack) the cantilever arm will start to bend after being in contact. The elastic response in this case is perfectly linear and determined by the spring constant of the cantilever arm. If the surface is soft or not robust (in the case of a hydrated membrane stack), the tip does indent or cut into the surface and there is few or no bending of the arm when lowering the cantilever, see Fig. 1 (c). In general, a surface will show a mixed effect. The surface will be incised and if the force becomes too high, the tip might cut into the surface, as depicted in Fig. 1 (b). In the corresponding force curves, which are shown in Fig. 2 (a), (b) and (c) for the three cases discussed above, the deflection of the AFM cantilever is monitored as a function of its vertical position while approaching the sample. While there is a linear slope of the curve when deflected from a rigid surface in Fig. 2 (a), the soft sample in Fig. 2 (b) is incised when lowering the AFM tip. In Fig. 2 (c), the tip is first deflected (points 1-3) but then cuts through the surface as indicated by the horizontal plateau. From the slope of these curves, normalized to an infinite stiff surface, the forces to press and cut through the membranes can be quantified (7).
Geometry
The elastic parameters of the bilayers which are actually probed by the AFM depend on the particular experimental geometry. The elasticity of lipid membranes spanned over small sized pores, where the tip size is in the order of the size of the membrane with correspondingly large indentations, has been probed by AFM very recently (33). The theoretical framework that describes the indentation of the pore-spanning bilayers has been developed and published in parallel (34) and the indentation profile of a parabolic tip and the bilayer has been carefully investigated. Note that this setup leads to strong curvature and non-linear equations. For pore spanning membranes on large holes (tip size and indentations small as compared to the size of the membrane) the assumption of small displacements is reasonable and the Young’s modulus of the membranes is probed. AFM investigations on single supported membranes allow to study breakthrough forces, breakthrough distances, adhesion, stiffness and topography (35, 36) with a high spatial resolution.
The present work deals with very thick multi-lamellar stacks of solid supported membranes. Applying force onto membrane stacks is an entirely different situation than the case addressed above on single membranes. The pressure applied by the tip will lead to a local compression of the membrane stack, leading to a decrease of the inter-bilayer spacing (lamellar repeat distance) from the equilibrium one. Note also, that in contrast to a uniform linear force response, some force curves exhibit horizontal plateaus, i.e., the tip lowers without deflection, indicative for a cut through the bilayers. In the linear regime, a compression of the stack will result over some lateral interaction area . Apart from experimental parameters like tip radius will be determined by the interplay of and as well as the swelling state . According to Eq. (1), a local force will lead to a compression over some interaction area , to minimize bending and compressional energy. If for an idealized patch of area we treat the membrane compression, in an oversimplistic approach, as a compression of flat and stiff planes, the compressional modulus B of the membrane stack can be written as the derivative of the applied force with respect to the cantilever height, normalized to the lamellar spacing of the bilayers
| (2) |
The entire physics of smectic elasticity is now contained in the effective parameter . The higher the bending rigidity and the lower the compressional modulus, the larger . The basic length scale of this interplay is the smectic length scale . We thus postulate in , with typically on the same order of magnitude, but somewhat smaller than the interlamellar spacing .
The approach is justified a posteriori by the values that are obtained for , if typical values for are taken to estimate . The values for then agree well with values reported in the literature by other techniques, see below. Note, however, that it is the bending modulus which determines the slope of the force curve, since cancels out in Eq. (2).
Results and Discussion
Force Curves
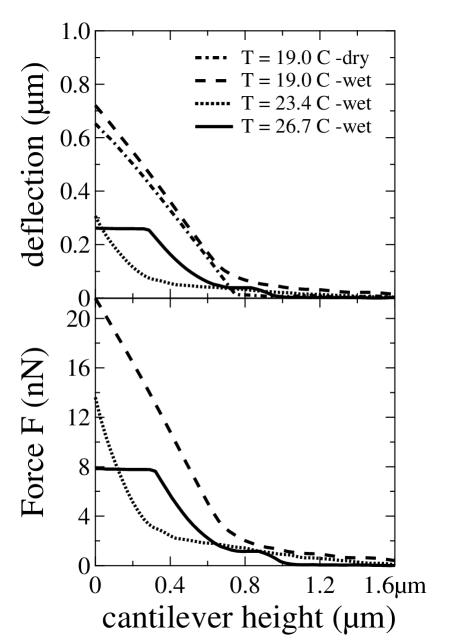
Force curves have been measured at different temperatures. The sample has been checked by deflection scans and an area clean from obvious defects like steps, holes or kinks has been selected. Typical deflection curves as a function of cantilever height are shown in Fig. 3 (a). The dry bilayer stack at has been measured as a reference. It shows the characteristics of a rigid sample with a well defined contact point and well defined linear slope, as discussed in Figs. 1 and 2. After applying the excess water the response changes and the surface becomes softer with a less well defined contact, but still linear elastic response. The situation is then completely different in the fluid phase at, e.g., . When approaching, the tip is first deflected, but then cuts through the first layers, as indicated by the horizontal plateau, before it is deflected again. There is a critical deflection above which the tip is just cutting through the bilayers. Although the positions of the plateaus might slightly vary in different experiments, we found this as typical response in the fluid phase.
Close to the phase transition, at , in the range of the critical swelling of the phospholipid bilayers, the membranes are more stable, there is no rupture of the bilayers, but initially there is only little deflection when lowering the tip indicating that the stack is very soft and can easily be compressed. The slope of the curve becomes steeper at higher indentations, only. From these data, and the rupture force can be determined.
Taking the dry sample as an ideal stiff reference, we can quantify the corresponding interaction forces. The difference from using, e.g., the silicon substrate as stiff reference is that the dry-membrane could be measured in-situ thereby preserving the interaction between tip and sample and also the geometrical set-up. Note that the normalization to the dried membrane stack cancels out all elasticity already present without excess water at ambient conditions (room temperature and humidity). The force is then calculated to , is the cantilever spring constant, the difference of cantilever height with respect to the (hard) reference sample. Figure 3 (b) plots the resulting forces in versus the cantilever height for the different temperatures.
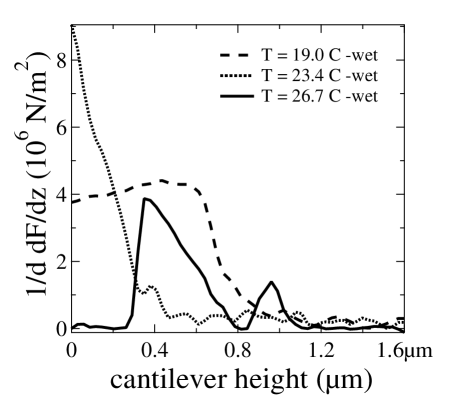
has been determined from the slope of the force curves in Fig. 3 (b) following Eq. (2), and is plotted in Fig. 4 for , and , i.e., in the gel (ripple) phase of the bilayers, close to the phase transition and in the fluid phase. The corresponding lamellar spacings can of course not be determined by AFM but have additionally been measured by x-ray diffraction on multi lamellar DMPC vesicles in excess water. Vesicles have been prepared and used to ensure full hydration of the bilayers because the hydration can be expected to be a crucial parameter for the compressibility of the membrane stacks. While the elastic response of the membrane stack is linear in the gel phase as indicated by the constant value for in Fig. 4 at , elastic responses in the range of critical swelling and in the fluid phase are highly nonlinear. Tab. 1 lists values for the rupture force and , as determined from Figs. 3 and 4. In the nonlinear regimes, the values for and are the maxima and minima, respectively, of all the values that we measured.
In the gel phase, we find values of 4.4. Close to , the compressional modulus more than doubles to . Although the corresponding curve in Fig. 3 (b) looks indeed much softer than in the gel phase, the slope at higher indentations is actually much steeper. The slope of the force-distance curve in the fluid phase is again smaller than in the gel phase and is determined to (interrupted by the bilayer rupture). All values for agree quite well with and lie quite in the middle of the broad range of values reported in the literature (37, 38, 30, 23). While the energy to compress the membrane stack is comparable in gel (ripple) and fluid phase, the stack is distinctly harder to compress in the range of critical swelling. We thus argue that AFM offers an independent determination of the compressional modulus of membrane stacks. While in scattering experiments it is usually very difficult to determine the bending modulus and independently from each other, the determination of force curves by AFM gives direct access to . Although that our approach might be oversimplified, it nevertheless gives very reasonable values for the compressional modulus of the membrane stacks. The dynamic experiment in (24) gave a larger of in the fluid phase at , which might be related to only partial hydration of the membranes in the neutron experiment. The bilayers were hydrated from the vapor phase and swollen to Å, only
Ripples on DMPC
The preparation of thick membrane stacks also allowed to study the structure of the top bilayer and to determine the ripple periodicity . Starting at a temperature of , the sample was slowly heated with a rate of /min and deflection was continuously scanned over an area of mm. Static ripple patterns have been observed. To determine the corresponding ripple period , we have selected an area of and Fourier transformed. From the sharp spots, the corresponding -vector and was determined. The resulting plots are shown in Fig. 5. Figure 6 gives the resulting period for all measured temperatures. Note that there is a certain spread in the determination of . The Fourier transform integrates over an area of and the occurrence of different ripple domains, i.e., different directions of the normal vectors, and static defects might lead to slightly different values and periods.
From the temperature dependence of in Fig. 6, the ripple period is almost constant with values of about 100 Å in the ripple phase at temperatures . increases when approaching the main transition at about . At temperatures in the range of Tm we find a coexistence of ripples with and (about 420 Å), visible by two diffraction spots in the Fourier transformation in Fig. 5. Figure 6 suggests a diverging ripple period when approaching Tm. Weak ripples stay visible in the Fourier spectra up to about , 1 degree above . At higher temperatures in the fluid phase, no ripples can be detected.
Metastable and even ripples have been reported earlier from AFM experiments on double bilayers (19, 39) and x-ray diffraction (40). The length scale of the metastable ripples agrees quite well with the length scale of the soft-mode found in the dynamical neutron study with . We speculate that the softening in the range of the phase transition might be coupled to the occurrence of these metastable ripples. A possible explanation is that bending of the bilayers might occur mainly in the interfaces between two metastable ripples. The bending modulus might thus be distinctly softer because structure and interactions are likely to be much less well defined in the interface and not much energy needed to slightly change the tilt angle between to ripple flanks. From our experiments we can not determine the structure of the super ripple structure, i.e., if possibly a pattern of coexisting gel and fluid domains develops within the super ripples structure, as suggested by Heimburg (41). It is well known that large fluid and gel domains with sizes coexist in the range of the main transition which can for instance be observed by fluorescence microscopy techniques. The inelastic neutron scattering study in (24) and our AFM study now point to coexisting nanodomains with sizes of less than , which might play a crucial role for the understanding of phospholipid bilayer dynamics and criticality in the range of , the range of critical swelling (42, 43, 44). Interestingly, the existence of coexisting gel and fluid nanodomains close to has been argued in a preceding inelastic neutron scattering study (45) to investigate the collective short wavelength dynamics in DMPC bilayers, from the coexistence of gel and fluid like excitations in the range of the critical swelling. The existence of coexisting small gel and fluid domains has also been argued by preceding AFM investigations (46, 20) to compensate the large stress which occurs at due to the volume difference of the two phases. Note that (39) also reported metastable ripples which were distinctly ’softer’ than the ripples.
Ripple period on DMPC & PEG
PEG exerts an osmotic pressure to the membrane stack which results in a slightly reduced lamellar spacing , as it is observed when lowering the hydration of the stacked membranes. We have prepared solutions of 5.8 %, 12.1 % and 25 % PEG in Millipore water. About of the solution was then dropped onto the sample and the AFM head immersed. All scans were taken at , in the ripple phase of the DMPC bilayers, where ripples could easily be observed. For each concentration, several scans have been taken. The resulting data are shown in Fig. 7. Error bars might be defined by the spread in in the different scans for the same concentration. Although the error bars are relatively large, there is a clear tendency: the ripple period increases from about 100 Å for DMPC under pure water to about 140 Å for DMPC in 25 % PEG. Table 2 lists values for PEG concentration, corresponding osmotic pressure and spacings of the stacked membranes that can not be accessed by AFM but were taken from the supplementary x-ray diffraction experiments. Using values from Chu et al. (30), the effect of an increasing PEG concentration can be compared to lowering the hydration. The corresponding values for RH are also given in Tab. 2.
The osmotic pressure exerted by the polymer leads to an increase of the ripple period while the lamellar spacing decreases. A correlation between ripple period and thickness of the water layer, i.e., hydration has been established almost twenty years ago (47) by x-ray diffraction of vesicles. Although the technique was basically bulk sensitive and the samples vesicles instead of highly oriented solid supported bilayers, the authors found an increasing with decreasing lamellar spacing . According to an AFM study (39), the occurrence of ripples is a consequence of interbilayer interaction and no ripples are observed on single bilayers. The increasing ripple period most likely stems from an increasing interaction between the bilayers when decreasing the bilayer distance. The ripples might for instance ’round out’, i.e., the amplitude and the tilt angle decrease, leading to an increased period. But a structural investigation using x-ray or neutron diffraction is clearly needed to determine the temperature dependent ripple structure to draw further conclusions.
Conclusion
In conclusion we present an AFM study of highly aligned, solid supported thick lamellar stack of phospholipid bilayers under excess water and water/PEG solutions. Our investigation proves the feasibility of working with AFM and thick samples in excess water. These samples are often used to study structural and dynamic properties of model membrane systems in x-ray and neutron scattering experiments. An advantage as compared to single or double bilayers is that in thick samples the interaction between the AFM tip and the substrate can be neglected. From force curves at different temperatures, we determined values for the compressional modulus, , and the rupture force, , of the membrane stacks in the ripple and the fluid Lα phase and in the regime of critical swelling. The values for are in excellent agreement to literature values and this novel approach allows to determine independently from other elasticity parameters.
The uppermost layer shows pronounced ripples in the P phase. We find an increasing ripple periodicity when approaching the temperature of the main transition at . Close to we observe coexisting metastable ripples with Å. The length scale of these ripples agrees well with the length scale of a soft mode in the dispersion relation of the long wavelength undulation modes reported in a recent inelastic neutron scattering study and might be responsible for the well known softening of phospholipid bilayers in the range of the critical swelling. The ripple period increases also with increasing osmotic pressure, most likely due to an increasing interaction between the bilayers in the stack.
Acknowledgements: We acknowledge financial support from the DFG through project SA 772/8-2. MCR would like to thank the Institut für Röntgenphysik, Göttingen, Germany, and particularly T. Salditt for kind hospitality during his very enjoyable sabbatical leave. We would like to thank E. Kats for critically proof reading and commenting on the manuscript in its final version.
References
- Binnig et al. (1986) Binnig, G., C. Quate, and C. Gerber, 1986. Atomic Force Microscope. Phys. Rev. Lett. 56:930.
- Drake et al. (1989) Drake, B., C. Prater, A. Weisenhorn, S. Gould, T. Albrecht, C. Quate, D. Cannell, H. Hansma, and P. Hansma, 1989. Imaging crystals, polymers, and processes in water with the atomic force microscope. Science 243:1586.
- Fritz et al. (1994) Fritz, M., M. Radmacher, and H. Gaub, 1994. Granula motion and membrane spreading during activation of human platelets imaged by atomic force microscopy. Biophys. J. 66:1328.
- Radmacher et al. (1994) Radmacher, M., M. Fritz, H. Hansma, and P. Hansma, 1994. Direct observation of enzyme activity with the atomic force microscope. Science 265:1577.
- Tao et al. (1992) Tao, N., S. Lindsay, and S. Lees, 1992. Measuring the microelastic properties of biological material. Biophys. J. 63:1165.
- Radmacher et al. (1995) Radmacher, M., M. Fritz, and P. Hansma, 1995. Imaging soft samples with the atomic force microscope: gelatin in water and propanol. Biophys. J. 69:264.
- Schäfer and Radmacher (2005) Schäfer, A., and M. Radmacher, 2005. Influence of myosin II activity on stiffness of fibroblast cells. Acta Biomaterialia 1:273.
- Weisenhorn et al. (1993) Weisenhorn, A., M. Khorsandi, S. Kasas, V. Gotozos, M. Celio, and H. Butt, 1993. Deformation and height anomaly of soft surfaces studied with the AFM. Acta Biomaterialia 4:106.
- Rotsch et al. (1999) Rotsch, C., K. Jacobson, and M. Radmacher, 1999. Dimensional and mechanical dynamics of active and stable edges in motile fibroblasts investigated by atomic force microscopy. Proc. Natl. Acad. Sci. USA. 96:921.
- Radmacher et al. (1996) Radmacher, M., M. Fritz, M. Kacher, J. Cleveland, and P. Hansma, 1996. Measuring the elastic properties of human platelets with the atomic force microscope. Biophys. J. 70:556.
- Hertz (1882) Hertz, H., 1882. Über die Berührung fester elastischer Körper. Reine Angew. Mathematik. 92:156.
- Sneddon (1965) Sneddon, I., 1965. The relation between load and penetration in the axisymmetric Boussinesq problem for a punch of arbitrary profile. Int. J. Eng. Sci. 3:47.
- Perino-Gallice et al. (2002) Perino-Gallice, L., G. Fragneto, U. Mennicke, T. Salditt, and F. Rieutord, 2002. Dewetting of solid-supported multilamellar lipid layers. Eur. Phys. J. E 8:275.
- Giocondi et al. (2000) Giocondi, M.-C., L. Pacheco, P. E. Milhiet, and C. le Grimellec, 2000. Temperature dependence of the topology of supported dimirystoyl- distearoyl phosphatidylcholine bilayers. Ultramicroscopy 86:151.
- Dufrene and Lee (2000) Dufrene, Y., and G. Lee, 2000. Advances in the Characterization of Supported Lipid Films with the Atomic Force Microscope. Biochim. Biophys. Acta. 1509:14.
- Kolb et al. (1999) Kolb, H.-A., O. Enders, and R. Schauer, 1999. Morphology of native and reconstituted biological membranes and their components analysed with atomic force microscopy. Appl. Phys. A 68:247.
- Beckmann et al. (1998) Beckmann, M., P. Nollert, and H.-A. Kolb, 1998. Manipulation and molecular resolution of a phosphatidylcholine-supported planar bilayer by atomic force microscopy. J. Membrane Biol. 161:227–233.
- Laidy et al. (2002) Laidy, C., T. Kaasgaard, J. Croew, O. Mouritsen, and K. Jorgensen, 2002. Ripples and the Formation of Anisotropic Lipid Domains: Imaging Two-Component Supported Double Bilayers by Atomic Force Microscopy. Biophys. J. 83:2625–2633.
- Kaasgaard et al. (2003) Kaasgaard, T., C. Leidy, J. Croew, O. Mouritsen, and K. Jorgensen, 2003. Temperature-Controlled Structure and Kinetics of Ripple Phases in One- and Two-Component Supported Lipid Bilayers. Biophy. J. 85:350–360.
- Tokumasu et al. (2002) Tokumasu, F., A. Jin, and A. Dvorak, 2002. Lipid membrane phase behaviour elucidated in real time by controlled environment atomic force microscopy. J. Electron Microsc. 51:1–9.
- Enders et al. (2004) Enders, O., A. Ngezahayo, M. Wiechmann, F. Leisen, and H.-A. Kolb., 2004. Structural Calorimetry of Main Transition of Supported DMPC Bilayers by Temperature-Controlled AFM. Biophys. J. 87:2522–2531.
- (22) Safinya, C. R., D. Roux, G. S. Smith, S. K. Sinha, P. Dimon, N. A. Clark, and A. M. Bellocq. Steric Interactions in a Model Multimembrane System: A Synchrotron X-Ray Study. Phys. Rev. Lett. 57:2718.
- (23) Petrache, H. I., N. Gouliaev, S. Tristram-Nagle, R. Zhang, R. M. Suter, and J. F. Nagle. Interbilayer interactions from high-resolution x-ray scattering. Phys. Rev. E 57:7014.
- Rheinstädter et al. (2006) Rheinstädter, M. C., W. Häussler, and T. Salditt, 2006. Phys. Rev. Lett. 97:048103.
- Caillé (1972) Caillé, A., 1972. X-ray scattering in smectic A. C.R. Acad. Sci. Ser. B 274:891–893.
- Lei et al. (1995) Lei, N., C. Safinya, and R. Bruinsma, 1995. Discrete Harmonic Model for Stacked Membranes: Theory and Experiment. J. Phys. II 5:1155–1163.
- Lei (1993) Lei, N., 1993. Ph.D. Dissertation, Rutgers.
- Lyatskaya et al. (2001) Lyatskaya, Y., Y. Liu, S. Tristram-Nagle, J. Katsaras, and J. F. Nagle, 2001. Method for obtaining structure and interactions from oriented lipid bilayers. Phys. Rev. E 63:011907.
- Salditt et al. (2003) Salditt, T., M. Vogel, and W. Fenzl, 2003. Thermal Fluctuations and Positional Correlations in Oriented Lipid Membranes. Phys. Rev. Lett. 90:178101.
- Chu et al. (2005) Chu, N., N. Kuc̆erka, Y. Liu, S. Tristram-Nagle, and J. F. Nagle, 2005. Anomalous swelling of lipid bilayer stacks is caused by softening of the bending modulus. Phys. Rev. E 71:041904.
- (31) Münster, C., T. Salditt, M. Vogel, R. Siebrecht, and J. Peisl. Nonspecular neutron scattering from highly aligned phospholipid membranes. Europhys. Lett. 46:486.
- (32) Meyer, H. W., K. Semmler, W. Rettig, W. Pohle, A. S. Ulrich, S. Grage, C. Selle, and P. J. Quinn. Hydration of DMPC and DPPC at 4oC produces a novel subgel phase with convex-concave bilayer curvatures. Chem. Phys. Lip. 105:149.
- Steltenkamp et al. (2006) Steltenkamp, S., M. M. Müller, M. Deserno, C. Hennesthal, C. Steinem, and A. Janshoff, 2006. Mechanical Properties of Pore-Spanning Lipid Bilayers Probed by Atomic Force Microscopy. Biophysical J. 91:217–226.
- Norouzi et al. (2006) Norouzi, D., M. M. Müller, and M. Deserno, 2006. How to determine local elastic properties of lipid bilayer membranes from atomic-force-microscope measurements: A theoretical analysis. Phys. Rev. E 74:061914.
- Künnecke et al. (2004a) Künnecke, S., D. Krüger, and A. Janshoff, 2004. Scrutiny of the Failure of Lipid Membranes as a Function of Headgroups, Chain Length, and Lamellarity Measured by Scanning Force Microscopy. Biophysical J. 86:1545–1553.
- Künnecke et al. (2004b) Künnecke, S., D. Krüger, and A. Janshoff, 2004. SFM based rapid force curve acquisition on supported lipid bilayers: experiments and simulations using pulsed force mode. Chem. Phys. Chem. 5:989–997.
- Liu and Nagle (2004) Liu, Y., and J. F. Nagle, 2004. Diffuse scattering provides material parameters and electron density profiles of biomembranes. Phys. Rev. E 69:040901.
- (38) Pabst, G., J. Katsaras, V. A. Raghunathan, and M. Rappolt. Structure and Interactions in the Anomalous Swelling Regime of Phospholipid Bilayers. Langmuir 19:1716.
- (39) Fang, Y., and J. Yang. Role of the bilayer-bilayer interaction on the ripple structure of supported bilayers in solution. J. Chem. Phys. 100:15614.
- Katsaras et al. (2000) Katsaras, J., S. Tristram-Nagle, Y. Liu, R. Headrick, P. Fontes, E. Mason, and J. Nagle, 2000. Clarification of the ripple phase of lecithin bilayers using fully hydrated, aligned samples. Phys. Rev. E 61:5668.
- Heimburg (2000) Heimburg, T., 2000. A Model for the Lipid Pretransition: Coupling of Ripple Formation with the Chain-Melting Transition. Biophysical J. 78:1154–1165.
- Chen et al. (1997) Chen, F., W. Hung, and H. Huang, 1997. Phys. Rev. Lett. 79:4026.
- Nagle et al. (1998) Nagle, J., H. Petrache, N. Gouliaev, S. Tristram-Nagle, Y. Liu, R. Suter, and K. Gawrisch, 1998. Multiple mechanisms for critical behavior in the biologically relevant phase of lecithin bilayers. Phys. Rev. E 58:7769–7776.
- Mason et al. (2001) Mason, P., J. Nagle, R. Epand, and J. Katsaras, 2001. Anomalous swelling in phospholipid bilayers is not coupled to the formation of a ripple phase. Phys. Rev. E 63:030902(R).
- Rheinstädter et al. (2004) Rheinstädter, M. C., C. Ollinger, G. Fragneto, F. Demmel, and T. Salditt, 2004. Phys. Rev. Lett. 93:108107.
- Xie et al. (2002) Xie, A., R. Yamada, A. Gewirth, and S. Granick, 2002. Materials Science of the Gel to Fluid Phase Transition in a Supported Phospholipid Bilayer. Phys. Rev. Lett. 89:246103.
- Wack and Webb (1988) Wack, D., and W. Webb, 1988. Measurements of Modulated Lamellar P Phases of Interacting Lipid Membranes. Phys. Rev. Lett. 61:1210.
- Mennicke et al. (2006) Mennicke, U., D. Constantin, and T. Salditt, 2006. Structure and interaction potentials in solid-supported lipid membranes studied by X-ray reflectivity at varied osmotic pressure. Eur. Phys. J. E 20:221–230.
| T ( | (Å) | Fr (nN) | |
|---|---|---|---|
| 19.0 | 65.5 | 20 | 4.4 |
| 23.4 | 66 | 13 | 8.3 |
| 26.7 | 63 | 8 | 3.9 |
| % PEG | log(P) () | P () | (Å-1) | RH (%) | (Å) |
|---|---|---|---|---|---|
| 0 | 0 | 0 | 65.5 | 100 | 100 |
| 5.8 | 5.55 | 0.35 | 60 | 99.98 | 105 |
| 12.1 | 6.08 | 1.2 | 58 | 99.925 | 120 |
| 25 | 6.94 | 8.7 | 54 | 99.525 | 140 |
Figure Legends
Figure 1.
Schematic of the AFM force measurement by indentation, for the case of (a) a stiff surface, (b) a soft surface and (c) the cantilever cuts the surface. Labels (1) to (4) in this graph refer to the corresponding sequence in the force curves in Fig.2: (1) The piezo is approaching to the surface. (2) The AFM tip is in contact with the surface (contact point). (3) The piezo is moving down, leading to the elastic indentation in the case of a soft surface and maybe cuts through the surface. (4) The piezo is moving up.
Figure 2.
(a): Typical force curve on a dry, hard membrane stack. The cantilever height is defined as the direction. The arrows mark the contact points where the cantilever first comes in contact with the sample surface. The approach and the retraction curves are also indicated by arrows. The elastic response is linear and determined by the spring constant of the cantilever (the slope of the curve). (b): Typical Force curve on a soft, hydrated membrane stack. The slope of this curve is considerably smaller than that of the stiff sample. The difference results from the larger indentation of the cantilever in the softer sample. (c): In this case, after indenting the surface, the cantilever cuts through several layer when the force exceeds a characteristic threshold marked by the plateau at small cantilever heights (compare Fig.1 c)). The cantilever has no ’resistance’ and so no deflection can be measured.
Figure 3.
(a) Force curves at different temperatures and for a dry sample. (b) Taking the dry sample as a reference, the corresponding force can be quantified.
Figure 4.
B Modulus determined as (Eq. (2)) for for and , i.e., in the gel (ripple) phase of the bilayers, close to the phase transition and in the fluid phase. While the elastic response of the membrane stack is linear in the gel phase as indicated by the constant value for at , elastic responses in the range of critical swelling and in the fluid phase are highly nonlinear. Tab. 1 lists values for the rupture force and .
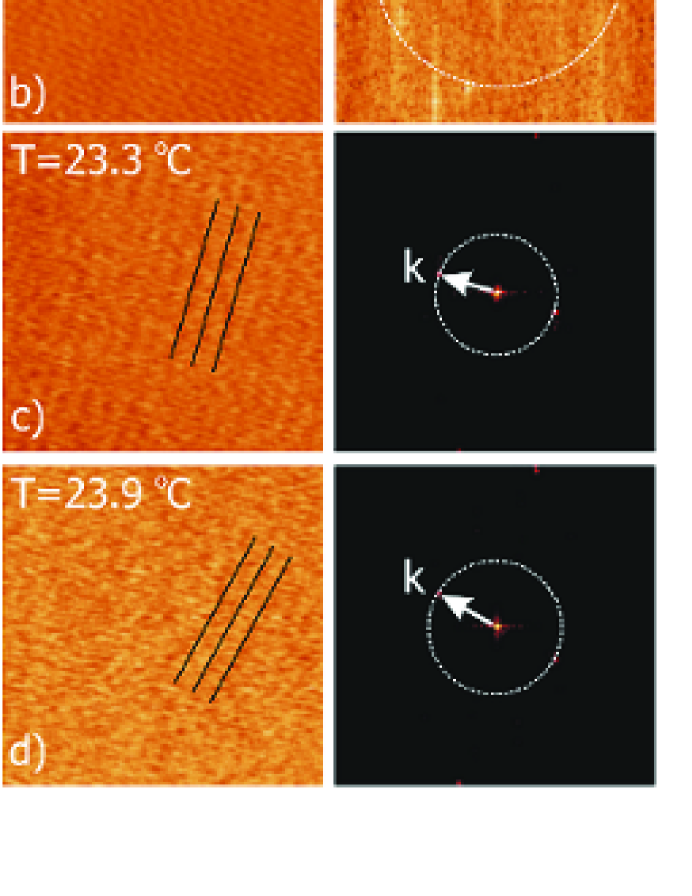
Figure 5.
AFM deflection scans over areas of and the corresponding Fourier transform for selected temperatures: a) , b) , c) , d) , e) & f) . The arrows mark the positions of diffraction spots in the Fourier spectra. The corresponding period in real space is indicated by the lines in the deflection plots. The ripple period increases when approaching (k decreases) and at the same time the ripples can be less well resolved, most likely due to a decreasing ripple amplitude. e) & f) Metastable ripples (denoted ) appear at the transition temperature which coexist with the ripples (). Ripple amplitude is very small at so that the Fourier transformation is needed to unambiguously determine .
Figure 6.
Temperature dependence of the ripple period as determined from the spots (Bragg reflections) in the Fourier transforms in Fig. 5. increases when approaching the main transition at about . At temperatures close to Tm there is a coexistence of ripples with and . Solid line is a guide to the eye.
Figure 7.
Ripple period for different concentrations of PEG, i.e., for different osmotic pressures. Solind line is a linear fit. Several measurements have been made at each concentration. The errors bars are reasonably defined by the scattering of the values which arise from integrating over several ripple domains in the AFM measurements in Fig. 5. The average values increase with increasing osmotic pressure from about 100 Å to 140 Å.