The discovery of two extremely low luminosity Milky Way globular clusters
Abstract
We report the discovery of two extremely low luminosity globular clusters in the Milky Way Halo. These objects were detected in the Sloan Digital Sky Survey Data Release 5 and confirmed with deeper imaging at the Calar Alto Observatory. The clusters, Koposov 1 and Koposov 2, are located at kpc and appear to have old stellar populations and luminosities of only . Their observed sizes of pc are well within the expected tidal limit of 10 pc at that distance. Together with Palomar 1, AM 4 and Whiting 1, these new clusters are the lowest luminosity globulars orbiting the Milky Way, with Koposov 2 the most extreme. Koposov 1 appears to lie close to distant branch of the Sagittarius stream. The half-mass relaxation times of Koposov 1 and 2 are only and Myr respectively (2 orders of magnitude shorter than the age of the stellar populations), so it would seem that they have undergone drastic mass segregation. Since they do not appear to be very concentrated, their evaporation timescales may be as low as . These discoveries show that the structural parameter space of globular clusters in the Milky Way halo is not yet fully explored. They also add, through their short remaining survival times, significant direct evidence for a once much larger population of globular clusters.
Subject headings:
Galaxy:halo – Galaxy:globular clusters1. Introduction
The population of globular clusters around the Milky Way has been studied extensively and the current census finds the majority at low latitudes in the inner Galaxy ( kpc). Globular clusters are almost universally “old” [], show no convincing evidence for dark matter, and have characteristic luminosities of ) and typical sizes of 3 pc. Yet, the observed range of structural properties (e.g. mass, size, and concentration) is quite wide. This range is of great interest, as it appears to be determined by a set of astrophysical processes: the initial structure and orbit; subsequent external processes, such as galactic tides and dynamical friction; and ensuing mass segregation, evaporation, and core collapse (see, e.g., Gnedin & Ostriker, 1997; Meylan & Heggie, 1997). Indeed, there has long been a sense that the observed population of Galactic globular clusters mainly reflects the subset of objects that could survive for . In individual cases, there is clear evidence for internal reshaping processes (as in M15 (catalog ), Sosin & King, 1997) and tidal disruption (as in Pal5 (catalog ), Odenkirchen et al., 2001). Within this context, identification and study of globular clusters with extreme properties is undoubtely of great interest.
Our census of objects at the outskirts of the Milky Way has increased rapidly in the last few years, mostly based on large-area CCD surveys such as the Sloan Digital Sky Survey (SDSS; York et al., 2000). Recent searches for Galactic halo objects have not only found many dwarf galaxies (Willman et al., 2005; Zucker et al., 2006; Belokurov et al., 2007; Irwin et al., 2007), but also added two faint and extended objects that may be Milky Way globular clusters. The newcomers, Willman 1 (catalog ) and Segue 1 (catalog ), both have distorted irregular isopleths, perhaps indicating ongoing tidal disruption. Willman 1 (catalog ) seems to show some evidence for dark matter and metallicity spread (Martin et al., 2007), casting some doubt on whether it is a globular cluster at all.
Here, we announce the discovery of two new, distant, extremely faint and compact ( pc) globular clusters, named Koposov 1 (catalog ) and Koposov 2 (catalog ), first detected in SDSS Data Release 5 (DR5) and subsequently confirmed with deeper imaging at Calar Alto. The total luminosity of Koposov 2 appears to be mag, lower than that of the faintest Galactic globular known to date, AM 4 (catalog ) ( mag, Inman & Carney, 1987). Koposov 1 is not much brighter; at mag, it has the third-lowest luminosity. In total, only 3 out of the previously known Galactic clusters, have comparably low luminosity and small sizes: AM 4, Palomar 1 (catalog ), and Whiting 1 (catalog ) (Whiting et al., 2002). Willman 1 and Segue 1 also have extremely low luminosities, but are an order of magnitude larger.
In this paper, we describe the deep follow-up data confirming the discoveries and give estimates of the structural parameters of the new objects (see Table 1). We argue that the discovery of these two low-mass globulars in less than 1/5 of the sky may mean that a substantial population of such clusters lurks in the outer halo of the Milky Way.
2. Discovery and observations


| Parameter | Koposov 1 | Koposov 2 |
|---|---|---|
| Coordinates (J2000) | 11:59:18.5 +12:15:36 | 07:58:17.00 +26:15:18 |
| Coordinates () | ||
| Distance | kpc | kpc |
| Size | pc | pc |
| Relaxation Time | Myrs | Myrs |
| Tidal radius | pc | pc |
The two new globular clusters were originally selected among other candidates in the course of our systematic search for small-scale substructure in the Milky Way halo. The aim of the search was to detect all significant small-scale stellar overdensities above the slowly varying Galactic background that are likely to be either dwarf spheroidal galaxies or globular clusters. A detailed description of the algorithm and its efficiency will be provided in a future paper, and we only present here a brief outline of the method. The algorithm is based on the so-called Difference of Gaussians method, first developed in Computer Vision (Babaud et al., 1986; Lindenberg, 1998). Starting from a flux-limited catalog of stellar positions, the number-counts map in plane is convolved with a filter optimized for the detection of overdensities, namely the difference of two two-dimensional Gaussians (Koposov et al., 2007). Having zero integral, the kernel guarantees that the convolution with a constant (or slowly varying) background will result in zero signal. When the data contain an overdensity with a size comparable to the size of the inner Gaussian, the filter will be close to optimal.
We applied this filtering procedure to the entire stellar subset of the DR5 source catalog with . In our analysis we used the photometry cleaned by switching on quality flags as described in SDSS SQL pages 111http://cas.sdss.org/dr5/en/help/docs/realquery.asp#flags This minimizes the influence of various artefacts including those caused by proximity of very bright or extended objects. In the resulting map that had been convolved with a 2′ kernel, we found two very compact objects among other overdensities ranked highly according to their statistical significance. Figure 1 shows the SDSS images, and Figure 2 shows the spatial distribution of extracted sources, where central concentrations of stars are clearly visible. These concentrations are detected at high level of significance. The areas of 1′ radius marked by circles centered on Koposov 1 and 2 plotted in Figure 2 contain 22 objects and 23 objects, respectively, while mean density of g-r, r stars should produce approximately 2.5 objects, which implies a high statistical significance of the overdensities; for pure Poisson distribution of objects, the probability to find such group of stars in all DR5 is around .

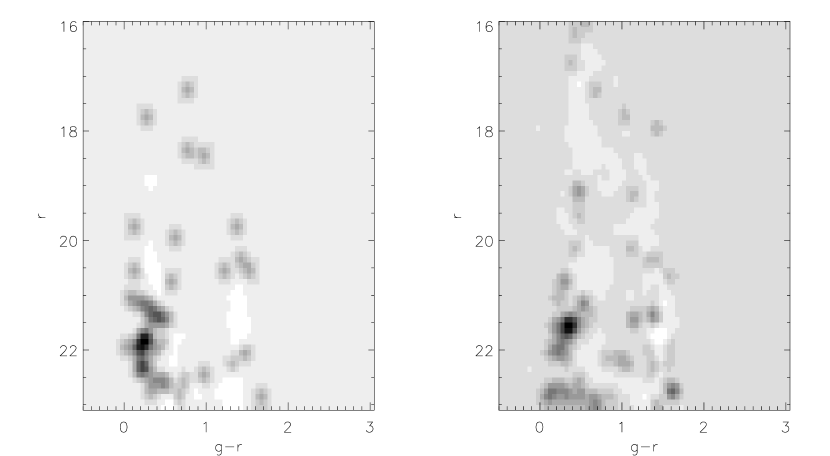
The differential Hess diagrams for stars within radius centered on the objects are shown in Figure 3. There is a clear excess of blue stars (), which we interpret as main-sequence turnoff stars at , which roughly corresponds to distances of kpc.
To confirm the nature of discovered candidates and quantify their structural and population properties, we acquired follow-up GTO observations in 2007 January on the 2.2m telescope at Calar Alto using the CAFOS camera. This camera has a CCD with a field of view and a pixel scale of . We observed each object for a total of 2 hr in Johnson and 1.5 hr in Cousins . The integrations were split into five individual dithered exposures for cosmic ray and bad pixel rejection. The observations were carried out in good photometric conditions with a seeing of . The data were bias-subtracted and flat-fielded. The individual frames were WCS-aligned, drizzled, and median-combined using our software and the SCAMP and SWARP programs (Bertin, 2006). The combined band images of the objects are shown in Figure 4.
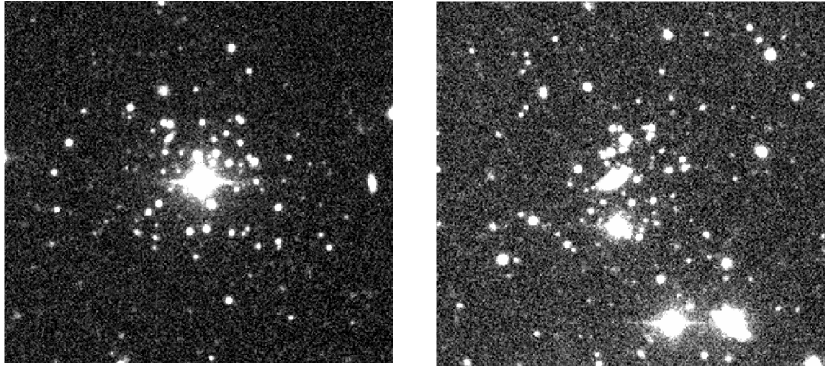


The central stellar overdensities are clearly corroborated by the Calar Alto photometry, which is nearly 2 mag deeper than the original SDSS data. While the follow-up data are quite deep, the stars are subject to significant crowding, due to the compactness of the clusters. Therefore, for the purposes of robust source detection and photometry, we used the DAOPHOT/ALLSTAR software (Stetson, 1987). To get the absolute calibration of the photometry from each frame, we cross-matched the DAOPHOT sources with the SDSS catalog using the Virtual Observatory resource SAI CAS 222http://vo.astronet.ru/cas (Koposov & Bartunov, 2006). To convert the Sloan and magnitudes into the Johnson-Cousins photometric system, we used the conversion coefficients from Smith et al. (2002). The resulting versus color-magnitude diagrams (CMDs) of the central regions of the objects together with the CMDs of the comparison fields, extending to , are shown in the Figure 5. The median photometric accuracy of the data is 0.05-0.1 mag. The CMDs clearly show the presence of the main sequences near the centers of the objects, while they are absent in the the comparison fields. The statistical significance of the overdensities is also clearly supported by the new data. The CMD of objects within 2′ from the center of Koposov 1 contain 96 objects, while the background density inferred from the comparison field should give around 23 objects, which gives a 15 deviation. For Koposov 2 , the number of objects within 1.2′ is 92, while the background density from the comparison field should produce around 24 objects, which gives a 14 sigma deviation. In the next section we will discuss the properties of the objects which can be derived from the follow-up data.
3. Properties
The CMDs of the objects from the Calar Alto data (Fig. 5) clearly show a distribution of stars which can be attributed quite convincingly to an old main sequence. In the case of Koposov 1, the main-sequence turnoff is clear-cut, while for the second cluster it is not so well defined. To estimate the distances to the objects, we overplot in Figure 5 the 8 Gyr [Fe/H]=-2 isochrones from Girardi et al. (2000). For Koposov 1, this gives a distance of 50 kpc. For Koposov 2, the estimate is 405 kpc, but it is not well constrained due to a lack of main-sequence turnoff stars. The angular diameters of the clusters are , which translates into a physical size of pc. Unfortunately, the number of stars detected in the central regions is not enough to precisely measure half-light radii of the objects; our best estimate is pc. For Koposov 1, we subtracted the bright foreground star near the center, integrated the light of the whole cluster in apertures and fitted it to a Plummer profile with pc. For Koposov 2, we performed a maximum likelihood fit with pc. Moreover, the minuscule number of stars in both clusters does not allow us to firmly establish their total luminosities. Our estimate of is based on the absence of the giants in these clusters and the visible similarity of the CMDs to that of the lowest luminosity globular cluster AM4 (, Inman & Carney, 1987). We checked that estimate by a simple Monte Carlo experiment: using the Salpeter IMF and Girardi isochrones we simulated fake clusters and deduced that the clusters with have a number of stars within 1.5-2 mag below the turnoff is close to the observed number of stars (50-70) in our objects. We must say also that due to the intrinsic faintness of the clusters and low number of stars in them the estimates of the total luminosity and especially the age have large uncertainties. However, with the existing data we cannot do any better. Much deeper and more accurate photometry may be required to get precise age/luminosity measures. The spectroscopic observations would be interesting in constraining the metallicity of these objects, which is currently completely unknown.
We note that the CMD of Koposov 1 shows several stars brighter and bluer than the tentative main-sequence turnoff, which we interpret as blue stragglers. This hypothesis is not implausible considering the low luminosity of the cluster and taking into account the observed anti-correlation between the frequency of blue stragglers and the luminosity of the globular cluster (Piotto et al., 2004).
The distance and the position of Koposov 1 suggest that this cluster may be related to the Sagittarius tidal stream. Its location is a good match to the distant tidal arm discovered in Belokurov et al. (2006). Figure 6 shows the arms of the Sagittarius stream in the DR5 slice around and the position of Koposov 1.
4. Discussion

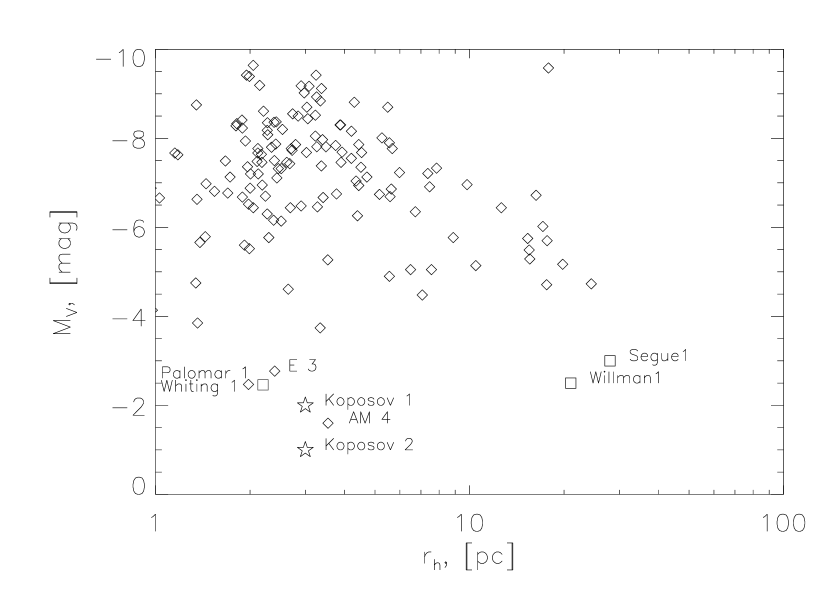
Figure 7 shows Koposov 1 and 2 on the size-luminosity plane along with other Galactic globular clusters. This illustrates how unusual Koposov 1 and 2 are in their structural properties. It appears that the detection of these clusters contributes to growing evidence for a large population of small and extremely faint objects (including Palomar 1, AM 4, E3 and Whiting 1). There is a clear indication as well that this sub-population of globular clusters may have significantly younger ages than classical globular clusters: Palomar 1 (Sarajedini et al., 2006) and Whiting 1 (Carraro et al., 2007) have ages between 4 and 6 Gyrs. The current estimate for the age of Koposov 1 is Gyr, and the age of E3 globular cluster is 10 Gyr. This group of clusters is also quite apparent on the galactocentric distance versus luminosity plane shown in Figure 8. At least 2 out of these 5 unusual clusters (Whiting 1 and Koposov 1) seem to be associated with the Sagittarius dwarf galaxy. Two quantities that are crucial for the long term evolution and survival of Koposov 1 and 2 are the relaxation time and the expected tidal radius. For the half-mass relaxation time, we find using equation (2-63) of Spitzer (1987) or equation (72) of Meylan & Heggie (1997),
respectively for Koposov 1 and Koposov 2. Here, we have assumed , , and N=500 for Koposov 2, while for Koposov 1, we have assumed twice as many stars, using the observational estimates of § 3. This means that both clusters have extremely short relaxation times, less than 1% of and . The most immediate effect of two-body relaxation is mass segregation, which should be quite drastic given the apparent stellar population age. The expected tidal truncation of these clusters occurs at (see, e.g., Innanen et al., 1983)
where we have assumed an orbital eccentricity of 0.5, and that the clusters are now near apocenter (hence kpc), a Milky Way circular speed of 190 at 16 kpc and a cluster (stellar) mass of 600 and 300 for Koposov 1 and 2, respectively. Hence, the detectable extent of the globular clusters (3 pc) falls well within the tidal limit. From this argument, the clusters are under no threat of destruction by tidal forces. Although formal profile fits are not feasible with so few stars, the stellar distributions (see Figs. 1 and 4) are well localized, but not centrally concentrated by globular cluster standards; a core to tidal radius ratio of the observed stellar distribution of 4 seems reasonable, implying a concentration parameter of . For such low concentrations, the evaporation timescale , which is the time-scale over which two-body relaxation drives stars to beyond the escape velocity, is (where is core collapse time) (Figure 17 and 19 in Gnedin et al., 1999)For Koposov 1 and 2, this implies evaporation time-scales of 0.7 and 1.1 Gyr, respectively. This estimate of may be an underestimate, if the brightest stars which we observe are more concentrated than the faint stars due to mass segregation; then the total mass and half-mass radius can be larger. Nonetheless, this estimate makes it clear that the present structural and dynamical state cannot have prevailed, even approximately, for a time-span of 10 Gyr. The above arguments hold irrespective of whether Koposov 1 and Koposov 2 were once part of a satellite galaxy, because they are mostly derived from internal evolution factors. This discrepancy of time-scales is more pronounced in Koposov 1 and 2, because their relaxation time-scales are shorter than those of Palomar 1 and Whiting 1, which in any case have accurate photometry suggesting younger ages of Gyr.

At face value, Koposov 1 and 2 have survival times in their current state of , and were found in a search of 20% of the whole sky (SDSS DR5). The naive multiplication of these factors points to a large parent population of objects. The most likely reservoir for this parent population is the globular clusters, and possibly even old open clusters, in satellite galaxies that have been accreted, like the Sagittarius. In objects like Koposov 1 and 2, it is clear that the very short relaxation and evaporation times must lead to drastic mass segregation and the expulsion of basically all low-mass stars (this line of reasoning lead us to the modest ). This gives new life to the view that truly many of the accreted globular clusters must have been destroyed. Yet, it is also clear that the actual dynamical prehistory and future of these clusters requires much more careful modelling. The small number of stars makes them ideal subjects of direct N-body calculations. But regardless of their dynamical evolution, these clusters manifestly demonstrate that the parameter space of globular clusters in the Milky Way is not yet fully explored.
References
- Babaud et al. (1986) Babaud J., A. P. Witkin, M. Baudin, and R. O. Duda. 1986, IEEE Trans. Pattern Anal. Mach. Intell., 8, 1, 26
- Belokurov et al. (2006) Belokurov, V., et al. 2006, ApJ, 642, L137
- Belokurov et al. (2007) Belokurov, V., et al. 2007, ApJ, 654, 897
- Bertin (2006) Bertin, E. 2006, ASP Conf. Ser. 351: Astronomical Data Analysis Software and Systems XV, 351, 112
- Carraro et al. (2007) Carraro G., A&A, submitted, astro-ph/0702253
- Girardi et al. (2000) Girardi, L., Bressan, A., Bertelli, G., & Chiosi, C. 2000, A&AS, 141, 371
- Gnedin et al. (1999) Gnedin, O. Y., Lee, H. M., & Ostriker, J. P. 1999, ApJ, 522, 935
- Gnedin & Ostriker (1997) Gnedin, O. Y., & Ostriker, J. P. 1997, ApJ, 474, 223
- Harris (1996) Harris, W. E. 1996, AJ, 112, 1487
- Irwin et al. (2007) Irwin, M. J., et al. 2007, ApJ, 656, L13
- Inman & Carney (1987) Inman, R. T., & Carney, B. W. 1987, AJ, 93, 1166
- Innanen et al. (1983) Innanen, K. A., Harris, W. E., & Webbink, R. F. 1983, AJ, 88, 338
- Koposov & Bartunov (2006) Koposov, S. E., & Bartunov, O. S. 2006, The Virtual Observatory in Action: New Science, New Technology, and Next Generation Facilities, 26th meeting of the IAU, SPS3, #19, 3,
- Koposov et al. (2007) Koposov, S., et al. 2007, ArXiv e-prints, 706, arXiv:0706.2687
- Lindenberg (1998) Lindenberg, T., 1998, International Journal of Computer Vision, 30, 2, 79
- Martin et al. (2007) Martin, N. F., Ibata, R. A., Chapman, S. C., Irwin, M., & Lewis, G. F. 2007, MNRAS, 380, 281
- Meylan & Heggie (1997) Meylan, G., & Heggie, D. C. 1997, A&A Rev., 8, 1
- Monet et al. (2003) Monet, D. G., et al. 2003, AJ, 125, 984
- Odenkirchen et al. (2001) Odenkirchen, M., et al. 2001, ApJ, 548, L165
- Piotto et al. (2004) Piotto, G., et al. 2004, ApJ, 604, L109
- Sarajedini et al. (2006) Sarajedini, A., et al. 2006, ApJ, submitted, astro-ph/0612598
- Smith et al. (2002) Smith, J. A., et al. 2002, AJ, 123, 2121
- Sosin & King (1997) Sosin, C., & King, I. R. 1997, AJ, 113, 1328
- Spitzer (1987) Spitzer, L. 1987, Princeton, NJ, Princeton University Press, 1987
- Stetson (1987) Stetson, P. B. 1987, PASP, 99, 191
- Whiting et al. (2002) Whiting, A. B., Hau, G. K. T., & Irwin, M. 2002, ApJS, 141, 123
- Willman et al. (2005) Willman, B., et al. 2005, ApJ, 626, L85
- York et al. (2000) York, D. G., et al. 2000, AJ, 120, 1579
- Zucker et al. (2006) Zucker, D. B., et al. 2006, ApJ, 643, L103