Towards a Comprehensive Fueling-Controlled Theory on the Growth of Massive Black Holes and Host Spheroids.
Abstract
We study the relation between nuclear massive black holes and their host spheroid gravitational potential. Using AMR numerical simulations, we analyze how gas is transported in the nuclear (central kpc) regions of galaxies. We study the gas fueling onto the inner accretion disk (sub-pc scale) and the star formation in a massive nuclear disk like those generally found in proto-spheroids (ULIRGs, SCUBA Galaxies). These sub-pc resolution simulation of gas fueling that is mainly depleted by star formation naturally satisfy the ‘ - ’ relation, with a scatter considerably less than the observed one. We found a generalized version of Kennicutt-Schmidt Law for starbursts is satisfied, in which the total gas depletion rate () is the one that scales as . We also found that the ‘ - ’ relation is a byproduct of the ‘ - ’ relation.
Subject headings:
quasars: general - galaxies: formation - black hole physics1. Introduction
In the past years, it has been found that most nearby massive spheroids (elliptical and spiral bulges) host nuclear massive black holes (MBH) (Kormendy & Richstone 1995), whose masses correlates with the host spheroid properties. Two correlations arises as the more relevant links between MBH and their hosts. The first one is that the masses of black holes correlates with the mass of the host (‘’ relation; Marconi & Hunt 2003; Haring & Rix 2004; Lauer et al. 2006), and in the second one the masses correlates with average random velocities of the stars in their host (‘’ relation; Ferrarrese & Merritt 2000; Gebhardt et al. 2000). Examples of the other relations can be found in Graham & Driver (2007) and references therein. Several theories have been proposed to clarify the origin of these relations (Silk & Rees 1998; Blandford 1999; Fabian 1999; Burkert & Silk 2001; Zhao, Haehnelt & Rees 2002; King 2003; Adams et al. 2003; Miralda-Escaudé & Kollmeier 2005; Sazonov et al. 2005; Begelman & Nath 2005; Escala 2006, Peng 2007). However, very little numerical work has been devoted to test their key hypothesis and assumptions in order validate these theories.
The study of MBH growth by gas accretion is usually focused on the study of accretion disks. However, these accretion disks are Keplerian by nature and therefore have neglible masses compared to that of the MBH. They must be continously replenished, otherwise the mass of the MBH will not have a considerable growth. The key question in the growth of MBHs by accretion, is how to remove the large angular momentum of gas in a galaxy in order to funnel it into the accretion disk in the central sub-pc region: the so called ‘Fueling Problem’. This fueling of gas that is an unavoidable step in the growth of MBHs by accretion, is by itself a galactic problem. Therefore, is a natural candidate for being the responsible for the correlation between the MBH masses and the galactic properties of their hosts, without requiring any extra ad-hoc hyphotesis such as huge outflows, fine tunning on the gas mass to stellar mass ratio, etc.
There are several mechanisms for fueling gas down to kpc scales such as galaxy mergers/interactions, bars and resonances (see Shlosman, Begelman & Frank 1990; Wada 2004 for a review). Gravitational torques in galaxy mergers arise as the dominant process for fueling large amounts of gas down to the central few hundred parsecs and for triggering most of the MBH growth. In a merger, after a violently relaxed core is formed at the center, most of the gas will settle in a nuclear disk (with typically several hundred parsecs in diameter) that is rotationally supported against the overall (gas + stars) gravitational potential (Barnes 2002; Kazantzidis et al. 2005; Mayer et al. 2007). The MBHs will migrate to the center, and merge in a timescale relatively short compared to the lifetime of the nuclear disk (Escala et al. 2004, 2005; Dotti et al. 2006).
In this paper, this massive nuclear disk with a central MBH is the starting point of our study. We focus on the mass fueling onto the inner accretion disk around a MBH (from the few hundred pc down to sub-pc scale), with special interest on the role of the spheriod gravitational potential in the mass transport. For that reason, we have designed a simple and clear experiment to study of the mass transport in a spheroid-dominated system. Here we analyze the mass transport in the same exact disk in rotational support with different background spheroid, ranging from simulations where the spheriod represent a typical bulge to ones that represent a big elliptical. With this experiment we can get insight of the fate of a fix amount of gas in a given galaxy in the universe, how much of that gas will form stars and how much will be feeded to the central MBH depending on the spheroid that host it.
Using simple analytical models Escala (2006), hereafter E06, analyzed how gas is expected to be transported in the nuclear regions of galaxies. For disks where the expected gas lifetime is given by the Kennicutt-Schmidt Law, this simple models naturally led E06 to the ‘ - ’ and ‘ - ’ relations. One of the main motivations of this paper is to test the conclusions of E06 based on simple models by considerably more realistic adaptive mesh refinement (AMR) simulations.
We start with a description of the assumed initial conditions, the model setup and the numerical results in §2. We continue with the analysis of the origin of the ‘ - ’ relation in §3. In §4 we compare the ‘ - ’ and ‘ - ’ relations. In §5 we discuss the implications of our work. Finally, our summary is presented in §6.
2. Numerical Setup
The model consist in a massive gaseous disk around a MBH that is embedded in a stellar spheroid. The spheroid is modeled by a time-independent external potential. We use the gravitational potential of an isothermal sphere for , and the potential of an homogenous sphere for . We solved the hydrodynamic and Poisson equations using the ENZO adaptative mesh refinement hydrodynamics code (Bryan and Norman 1997). The adaptative cartesian grid covers a region around the galactic center, with a spatial resolution of 0.24 pc. Radiative gas losses from an optically thin plasma follows the cooling curve of Sarazin & White (1987) down to temperatures of K. We use outflow (zero gradient) boundary conditions and in our simulations we use the following units: [Mass] = , [Velocity] = , and [Distance] = 1 kpc.
For modelling star formation, the following criteria were used to decide whether a grid cell would produce a star (Cen & Ostriker 1992; O’Shea et al. 2004): (1) the gas density in that grid cell exceeds a threshold density, (2) the mass of gas in the cell exceeds the local Jeans mass, (3) there is convergent flow (i.e., ), and (4) the cooling time is less than the dynamical (), or the gas temperature is at the minimum allowed value. If a grid cell meets all the previous criteria, then some gas is converted into a ‘star particle’. The mass of this star particle is calculated as
| (1) |
where ; is the star formation efficiency per dynamical time (equals to 0.1), is the size of the time step, is the time for dynamical collapse, and is the gas density. This set of conditions has one extra criterion added to it: even if a cell fulfills all of the previous four criteria, a star particle will not be formed if its mass is less than a minimum star particle mass . In our simulations, the value for used was . In the case in which this criteria is the only mechanism preventing a star particle from forming, a bypass exists that allows a star particle with mass less than to form if is greater than 80% of the mass in the cell. To model the star formation in a molecular cloud, which will typically spread out over a dynamical time, the star particle’s mass is spread out over a time .
The massive black hole with its accretion disk is modelled as a sink particle that is originally placed at the center of the system. This sink particle accretes the gas that is within 5 cells () around the center, and that has exceeded the critical number density .
The initial condition is a rotationally supported disk with a 1/r density profile, 600 pc of diameter and thickness of 30 pc. The total mass of the disk is and the initial mass of the central black hole is . The initial temperature is set to K over the whole region. Random density and temperature fluctuations of less than 1% are added to the initial uniform disk. We performed 6 different runs where we vary the mass of the bulge, in such a way that the velocity dispersion of the bulge is: 110, 163, 216, 270, 321 and 357 . For a bulge modeled by an isothermal sphere, our rotationally supported disks have flat rotation curves. For example the run with the highest gas fraction has a rotation velocity of 129 . This corresponds to the run and the ratio is approximately 1/3 and similar to those found in the most gas rich ULIRGs (Downes & Solomon 1998). Table 1 lists the parameters used in these six runs (note that is the total stellar mass within the initial disk equivalent to the applied external gravitational potential).
Table 1: Run Parameters
| RUN | ||||
|---|---|---|---|---|
| 1 | 110 | 129 | ||
| 1.5 | 163 | 176 | ||
| 2 | 216 | 226 | ||
| 2.5 | 270 | 278 | ||
| 3 | 321 | 328 | ||
| 3.5 | 357 | 364 |
2.1. Results
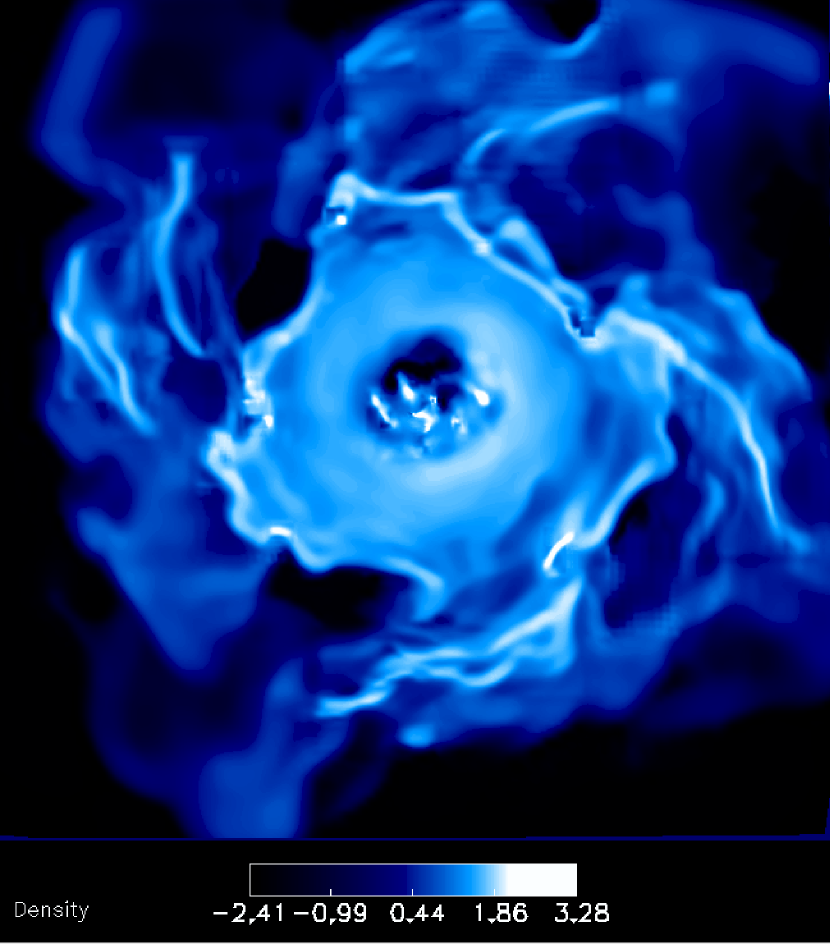
Figure 1 illustrates a representative stage in the evolution of the system, showing the face-on density distribution at the plane of the disk (z=0) for run 3.5, at the time t = 2.2 Myr. The plotted region in the x-y plane is 1kpc1kpc. The figure shows a complicated multiphase structure, in qualitative agreement with the findings of Wada & Norman (2002) and E06. The medium is characterized by high density clumps and filaments, embedded in a less dense medium.
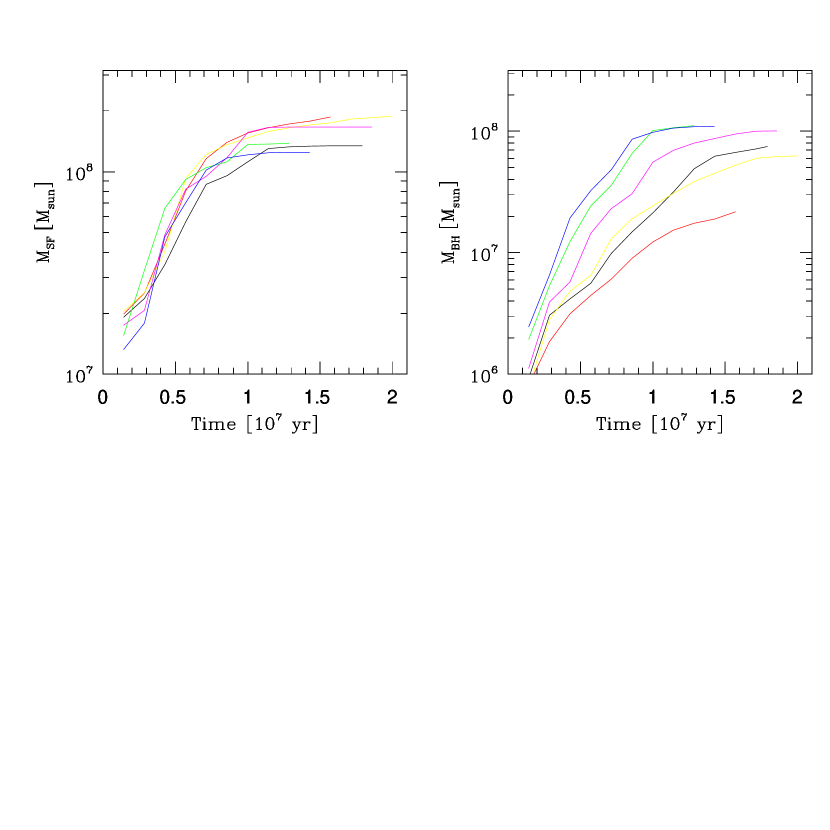
Figure 2a shows the time evolution of the total mass of stars formed, for the six different runs: 1 (red), 1.5 (yellow), 2 (black), 2.5 (magenta), 3 (green) and 3.5 (blue). In all the runs, the total mass of stars formed shows an approximately exponential growth until reaches saturation. The figure doesn’t shows a strong dependence on the background gravitational potential, which is the only parameter varied among the runs.
In Fig. 2b, we plot the time evolution of the total accreted mass onto the MBH, for the different runs and using the same color code as in Fig. 2a. This figure shows a strong dependence on the background gravitational potential, contrarily to that seen in the formation of stars. The final MBH mass varies by an order of magnitude among the runs. In all the runs, the total accreted mass shows an approximately exponential growth until reaches saturation.
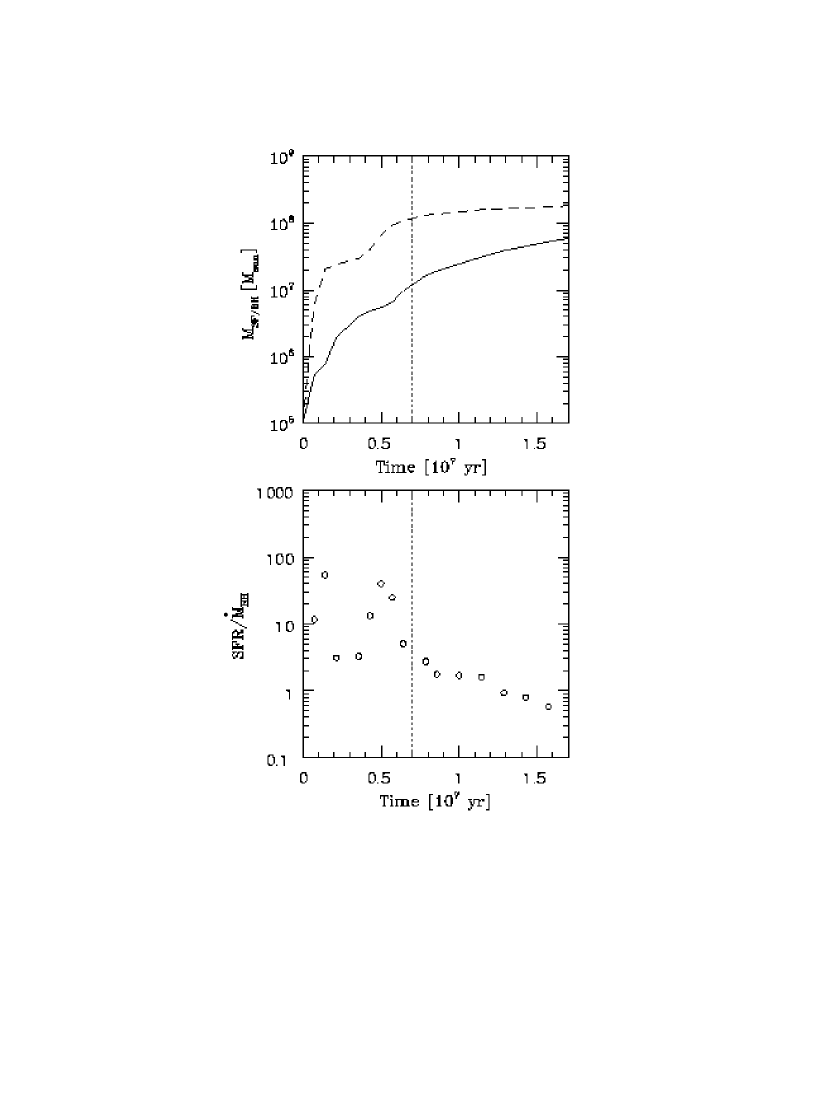
Figure 3a shows a comparison of the total accreted mass onto the MBH (solid line) and the total mass of stars formed (dashed line) as a function of time for run 1.5. In the early evolution of the system, up to t = 7 Myr, we see that the BH growth and the star formation in the host co-evolves (i.e. ) as has been suggested by recent observations of proto-spheroids (Kauffmann & Heckman 2005; Hao et al. 2007). This co-evolution arises naturally in this scenario where is the same massive disk the one responsible for the mass accretion rate onto the BH () and for the star formation rate in the galaxy (). Contrarily in the standard scenario where feedback suppresses further star formation in the host galaxy, you expect non-correlation or even anti-correlation between .
At later times in Fig. 3a, after t = 7 Myr, the MBH mass tend to converge towards to total mass of stars formed. This change in trend is because the star formation tends to became inefficient after that time as seen in Fig. 3b. This figure plots the time evolution of the ratio between the star formation rate and the MBH mass accretion rate, which clearly decays after t = 7 Myr. The origin of the decay is that as most of the gas gets consumed and the disk become less dense and gravitationally more stable, therefore the gas avoids to forms stars and mainly ends-up in the central BH. However, we don’t think that this steep decay happens in real starbursts because other processes not included in our simulations, like feedback from star formation or AGN, will continue producing inhomogeneities and triggering further star formation.
Finally, we plot the final black hole mass for the six different runs at t = 7 Myr in Fig. 4a and at the end of all simulations in Fig. 4b. In each run, the host spheroid has a different mass and therefore a different total dynamical mass enclosed within the initial disk, as plotted in Figs 4a and b. Fig. 4a shows a clear correlation between the MBH mass and the host spheroid mass. The solid line is and the scatter is considerably less than the ‘ - ’ relation. Fig. 4b shows that the correlation tends to get tilted towards (solid line in Fig. 4b). As mentioned before, our simulations suffered of an unrealistic steep decay in the star formation rate after t = 7Myr. This effect is more notorious at spheroids with lower masses because they consume gas less efficiently than bigger spheroids (their disks are less turbulent and therefore with less inhomogeneities), having more leftover gas to be mainly consumed by the MBH after t = 7Myr and thus tilting the relation. Therefore we think that the more reliable result is in the one up to t = 7Myr (Fig.4a) and is the result that we will continue analyzing in this paper.
We think that the little scatter observed in Fig. 4a is expected taking into account that our simulations are still idealized, with only one parameter varied and that only tries to reveal the physical process (fueling) responsible of the ‘ - ’ relation. Many other processes that are not taken into account in this work, such the number of major mergers (growth episodes) that happened in the history of a given spheroid, the feedback from star formation and possibly from an AGN, the fraction of the mass fed that ends up inside the event horizon of the MBH, within other processes will contribute to increase the scatter in the relation.
3. Generalized Kennicutt-Schmidt Law and the Origin of the Relation
Using simple analytical models, E06 shows that the average mass fueling onto the inner accretion disk is proportional to (eq 3 in E06). This result is valid for the different possible types of massive nuclear disk, and also different mechanisms for angular momentum transport, being the zero-point the only way to discriminate between them (see §5 in the same paper). E06 also couple this result with the expected gas lifetime given by the Kennicutt-Schmidt Law (Kennicutt (1998); ), naturally leading to the ‘ - ’ relation:
| (2) |
In this section, we check if both conditions are satisfied in our simulations. We start by studing if the star formation rate in our model satisfies the Kennicutt-Schmidt Law: . Figure 5a shows the average gas depletion rate againts the orbital time () for the six different runs. Since the total gas mass is the same for all the runs, the Kennicutt-Schmidt Law predicts that must be proportional to like the solid line in Fig. 5a. The open circles are the gas depletion rate including only the gas depleted by star formation as in the Kennicutt-Schmidt Law. The filled circles are again the gas depletion rate for each simulation, but now including the gas depleted by star formation and by accretion onto the central black hole. The figure clearly shows that is the total gas depletion rate the one that correlates better with the inverse of the orbital time , and not the gas depletion rate due to star formation only.
Kennicutt (1998) estimates the star formation rate by their far infrared luminosity (). It is well known that has a relevant AGN contribution (approximately 1/3), therefore what Kennicutt (1998) identifies as star formation rate is in fact closer to the total gas depletion rate as in our simulations. E06 also neglect the bh’s mass accretion rate in the gas depletion timescale, making . Our simulations shows that such aproximation is no longer needed, because is the total (accretion plus star formation) gas depletion timescale itself the one that scales with the orbital time.
The gas depletion rates found in our simulations are higher than Kennicutt (1998) ones by a factor of 5. This is an expected result since any feedback or recycling of gas has been included in our simulations. Only some feedback is implicitly represented by the artifitial cut-off of the cooling funtion at T = 10,000 K. But this only corresponds con an effective sound speed that is well below compared to the degree of turbulence found in starburst galaxies.
The exact slope of this kinematical formulation of the Kennicutt-Schmidt Law, with being the original Kennicutt (1998) result, has been topic of debate in the recent years. Boisser et al. (2003) reported a steeper slope () from the observation of 16 normal disk galaxies and this steeper slope has been recently confirmed numerically (Li, Mac Low & Klessen 2006). The origin of this discrepancy has been attribute to a difference between normal galaxies and starburst galaxies. Moreover, a more carefull examination of Fig 7 in Kennicutt (1998), also shows that the normal galaxies considered alone seem to have a steeper slope that starburst ones (Li, Mac Low & Klessen 2006). Since our simulations are only in the starburst regime, our work is in agreement with a less steep slope of for starburst galaxies.
The second condition needed to be satisfied by our simulations is that is proportional to , something that was already tested in E06 for an adiabatic disk. We estimated by the mass accretion rate onto the sink particle per orbital time . Fig 5b shows as a function of , where the filled circles are the mass accretion rate onto the sink particle per orbital time for the different runs and the solid line is . Therefore the condition is also satisfied by our simulations.
E06 numerically found that is proportional to for a ‘gravito-driven’ turbulent disk, where both turbulent viscosity and gravitational torques are the responsible for the transport of mass. These simulations can be more characterized by what is called a ‘disk of clouds’, where only gravitational torques are the responsible for the transport of mass and suggesting that this is a fairly general result. In fact it is endeed a general result, because for any given disk rotating at a speed , simple dimensional analysis tells us that the mass accretion rate will scales as . This is the dimensional dependence of independent of the proccess responsible for angular momentum loss and mass transport, that will only change the dimensionless dependence. Taking into account that in ULIRGs (Downes & Solomon 1998; see §2.1 in E06) within aproximatelly 10%, we arise to the expected result of being proportional to .
4. Fundamental Link Between Massive Black Holes and Host Galaxies
In the recent years, two important correlations has been found between massive black holes and the host spheroid (bulge/elliptical galaxies) properties. The first one is that the masses of black holes correlates with the mass of the host (; Magorrian et al. 1998), and in the second one their masses correlates with average random velocities of the stars in their host (; Ferrarrese & Merritt 2000; Gebhardt et al. 2000). Since both relations are connected by the Faber-Jackson relation , only one relation is the real connection between MBHs and galaxies. In other words, the other relation is then a mere byproduct of the real one and the Faber-Jackson relation.
Initially, the appears with considerably less scatter suggesting that either is the more fundamental relation or the estimation for used in Magorrian et al. (1998), that was simply the host luminosity , was a poor estimator compared to . Subsequent work with a more accurate estimate for (Marconi & Hunt 2003; Haring & Rix 2004; Lauer et al. 2006), endeed shows that the relation has comparable or less scatter than the relation. Therefore is still unclear which relation is the fundamental link between MBH and host spheriod and which is a byproduct of the other one.
Our simultion setup has the advantage of a fix initial disk radius in all runs that decouples both relations. Since for a spherically symetric system, only the enclosed stellar mass by the intial disk has dynamical influence onto the disk, defines the mass dynamically relevant () instead of (that is ; Faber-Jackson relation). Therefore, in our configuration we have instead one set of two consistent solutions (‘ - ’ & ‘ - ’ relations), we have two possible sets of consistent solutions:
| (3) |
| (4) |
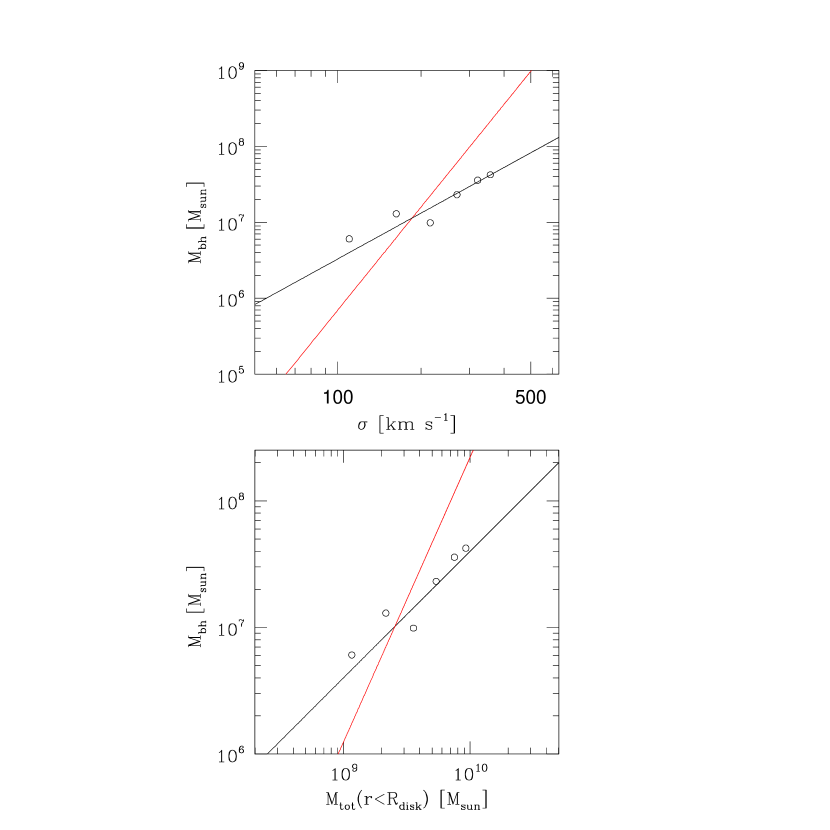
In Fig 6a we plot the black holes masses for the six different runs, which corresponds to different . Fig 6b plots again the black holes masses for the different runs, but now plotted against the total enclosed dynamical mass. The black lines are the predictions for the first set of possible solutions (Eqs. 3) and the red lines are the predictions for the second ones (Eqs. 4). As expected from the results showed earlier in this paper, this figure clearly shows that the runs lies in the first set of possible solutions (Eqs. 3). This means that in a fueling-controlled growth scenario, the ‘ - ’ relation is the fundamental link between MBH and host spheroids, and the ‘ - ’ relation is only a byproduct of this relation.
The relevance of the ‘ - ’ relation was already predicted in E06 and is in agreement with recent extension of the correlations to lower masses. It has been found by Ferrarrese et al. (2006) and Wehner & Harris (2006) that compact stellar nuclei correlates with the masses of the host galaxies, falling along the same scaling relation that MBHs obeyed with their, predominantly more massive, host galaxies. Contrarily, when they plot their masses against their host velocity dispersion , the nuclei and MBHs obey statiscally different scaling relation suggesting that is not the fundamental byproduct of the proccess of galaxy formation. In our simulations, the central sink particle could be either a MBH or a compact stellar nuclei depending on how the mass evolves on this un-resolved scales. But its total mass must obey the same scaling relation that is established by the larger scales gravitational dynamics of fueling and star formation at the epoch of galaxy formation.
5. Discussion
Since their discovery, to many analytical explanations for the ‘ - ’ and ‘ - ’ relations has been proposed. In these theories are represented almost all kind of distinct physical processes, giving the impresion that the relations are not a strong constrain on the coevolution of MHBs and host galaxies. However, many of them are simply not physically plausible and others use key hypothesis that must be proven correct first. Therefore in order to validate theses theories, they need to be numerically tested. This can only be done with numerical simulations that are expecially designed to test their key hypothesis or physical processes and that has enough resolution to do it. This work is our first attempt to validate numerically that the origin of the ‘ - ’ is in the mass fueling onto the inner accretion disk.
Since fueling of mass onto the inner accretion disk is already an unavoidable step in the growth of MBHs, the theory presented here arise as a natural explanation for the ‘ - ’ relation. Also, has the advantage that this theory don’t needed any extra ad-hoc hyphotesis such as huge outflows, fine tunning on the gas mass to stellar mass ratio, etc in order to explain the observed correlations. Contrarily, fits quite well in the standard theory of galaxy formation, where spheriods are formed in rapid star forming events triggered by galaxy mergers.
This work considerably differs from previous numerical work on the growth of MBHs that mainly focus on larger (galaxy mergers) scales. For example in Di Matteo et al. (2005) the gravitational forces are fully resolved only on scales larger than 1 Kpc, but below this scales is where the most relevant processes (ongoing starburst, black hole accretion and feedback from both) happens. Therefore they rely all this relevant physics on simple parametrized prescriptions, making their approach not far from the semi-analytical one. Moreover, they attribute the origin of the correlations to AGN feedback (parametrized too), but they don’t give enough evidence for that. Li et al (2006) does a better job in terms of resolution, with their pc gravitational and sink particle resolution they can resolve gravitational collapse and fragmentation on larger scales. However, the resolution is still not enough to follow the fueling onto the accretion disk and they don’t analyze enough on the origin of the correlations.
In this work we don’t follow the full galaxy merger and instead we assume a massive nuclear disk at the center of the remnant, but such disk is a well known by-product of a gas-rich galaxy merger (Barnes & Hernquist 1996; Di Matteo et al. 2005; Mayer et al. 2007). We take a more experimental or exploratory approach where give some hyphotesis, and , to be tested and designed a set of simulations that succesfully test them under its limitations. Our simulations have of course idealizations, such as not including feedback processes from star formation and AGN. We think that they do play a role in the physical state of the ISM, especially feedback from star formation, but we don’t think that they are responsible for origin of the correlations since they a natural byproduct of mechanisms that we know must be present (BH’s fueling and star formation). Finally since these mechanisms are already present, other alternative mechanisms must erase the already existing correlations first and make them again, something that is possible but very unlikely.
One of the major uncertainties remained is what is the fate of the gas within the accretion disk, which is another big problem by itself. Unfortunately, is still unclear how much of the mass fed onto the inner accretion disk ends up inside the event horizon of the MBH. It is also unclear the dynamical effect that will have the non accreted material in the incoming accretion flow. However besides these uncertainties we think that they should not change considerably the overall picture, like for example destroying the correlations with the galactic properties settled in the fueling process, since these correlation are endeed observed. Using simple models, E06 estimate that only around 15% of the mass fueled is needed to be accreted in order to reproduce the observed ‘ - ’ relation.
6. Summary
In our previous paper (E06) we studied the relation between nuclear massive black holes and their host spheroid gravitational potential. Using simple models, we analyzed how gas is expected to be transported in the nuclear regions of galaxies. When we coupled it with the expected gas lifetime given by the Kennicutt-Schmidt Law, naturally lead us to the ‘ - ’ and ‘ - ’ relations.
In the present paper, we have extended this work based on simple model by studying considerably more realistic adaptive mesh refinement simulations using the ENZO code. We use this powerful tool to study how gas is transported in the nuclear (central kpc) regions of galaxies down to the inner accretion disk (sub-pc scale). We also study star formation in this massive nuclear disk that is an ubiquitous feature in proto-spheroids (ULIRGs, SCUBA Galaxies).
We found that these sub-pc resolution simulation of gas fueling that is mainly depleted by star formation naturally satisfy the ‘ - ’ relation, with a scatter much less than in the observed correlation.
We also found that instead of being the Kennicutt-Schmidt Law satisfied, a generalized version of it is satisfied. In this generalized law is the total gas consumption rate , the one that scales as . We argued that what Kennicutt (1998) identifies as star formation rate is in fact closer to the total gas depletion rate as in our simulations.
Finally, we take advantage of the particular desing of our simulations to compare the ‘ - ’ and ‘ - ’ relations. We found that the ‘ - ’ relation is a byproduct of the ‘ - ’ relation, being therefore the latter the most fundamental one.
I thank Tom Abel for his introduction to ENZO and for stimulating discussions. I also thank Roger Blandford for very valuable comments. I performed these calculations on 16 processors of a SGI Altix 3700 Bx2 at KIPAC at Stanford University.
References
- Adams et al. (2003) Adams, F. C., et al. 2003, ApJ, 591, 125
- Barnes (2002) Barnes, J. E. 2002, MNRAS, 333, 481
- Barnes & Hernquist (1996) Barnes, J., Hernquist, L. 1996, ApJ, 471, 115
- Blandford (1999) Blandford, R. D. 1999, in Galaxy Dynamics, ASP 182, ed. Merritt et. al. (San Francisco: Astron. Soc. Pacific),87
- Bryan (1997) Bryan, G. L., Norman, M. L. 1997, ArXiv Astrophysics e-print
- Burkert (2001) Burkert, A., Silk, J. 2001, ApJ, 554, 151L
- Cen (1992) Cen, R., Ostriker, J. P. 1992, ApJ, 399L, 113
- DIMA (05) Di Matteo, T., Springel, V., Hernquist, L. 2005 Nature, 433, 604
- Dotti (2006) Dotti, M., Colpi, M., Haardt, F. 2006, MNRAS, 367, 103
- Downes & Solomon (1998) Downes, D., Solomon, P. M. 1998, ApJ, 507, 615
- Escala et al. (2004) Escala, A., et al. 2004, ApJ, 607, 765
- Escala et al. (2005) Escala, A., et al. 2005, ApJ, 630, 152
- Escala (2006) Escala, A. 2006, ApJ, 648, L13
- Fabian (1999) Fabian, A. C. 1999, MNRAS, 308, L39
- Ferrarese & Merritt (2000) Ferrarese, L., Merritt, D. 2000, ApJ, 539, 9
- Gebhardt et al. (2000) Gebhardt, K., et al. 2000, ApJ, 539, 13
- Graham, A. W., Driver (07) Graham, A. W., Driver, S. P. 2007, ApJ, 655, 77
- Hao (2007) Hao, C. N., et al. 2007, ArXiv Astrophysics e-print
- Haring & Rix (2004) Haring, N., Rix, H. W. 2004, ApJ, 604L, 89
- Jogee, Scoville & Kenney (2005) Jogee, S., Scoville, N. Z. & Kenney, J. D. P. 2005, ApJ, 630, 837
- Kauff. (2005) Kauffmann, G., Heckman, T. M. 2005, RSPTA, 363, 621
- Kazantzidis et al. (2005) Kazantzidis, S., et al. 2005, ApJ, 623L, 67
- Kennicutt (1998) Kennicutt, R. C. 1998, ApJ, 498, 541
- King (2003) King, A. 2003, ApJ, 596, 27L
- Krumholz et al. (1998) Kormendy, J., & Richstone, D., ARA&A, 33, 581
- Krumholz et al. (2005) Krumholz, M., et al. 2005, astro-ph/0510432
- O’Shea (2004) O’Shea, B. W., et al. 2004, ArXiv Astrophysics e-print
- Peng (2007) Peng, C. Y. 2007, ArXiv Astrophysics e-print
- Lauer et al. (2006) Lauer, T. R., et al. 2006, ArXiv Astrophysics e-print
- Li (2006) Li, Y., Mac Low, M.-M., Klessen, R. 2006, ApJ, 639, 879
- Li et al. (2006) Li, Y., et al. 2006, ArXiv Astrophysics e-print
- Mayer (2007) Mayer, L., et al. 2007, in preparation
- Magorrian (1998) Magorrian, J., et al. 1998, AJ, 115, 2285
- Marconi & Hunt (2003) Marconi, A., Hunt, L. K. 2003, ApJ, 589L, 21
- Miralda-Escudé & Kollmeier (2005) Miralda-Escudé, J., Kollmeier, J. A. 2005, ApJ, 619, 30
- (36) Sarazin, C. L., White, R. E. 1987, ApJ, 320, 32
- Sazonov et al. (2005) Sazonov, S. Y., et al. 2005, MNRAS, 358, 168
- Shlosman, Begelman & Frank (1990) Shlosman, I., Begelman, M., Frank, J. 1990, Nature, 345, 679
- Silk & Rees (1998) Silk, J., Rees, M. J. 1998, A&A, 331, L1
- Wada & Norman (2002) Wada, K., Norman, C. A. 2002, ApJ, 566, L21
- Wada (2004) Wada, K. 2004, in Coevolution of Black Holes and Galaxies, ed L. C. Ho (Cambridge: Cambridge Univ. Press), 186
- Zhao, Haehnelt, Rees (2002) Zhao, H., Haehnelt, M. G., Rees, M. J. 2002, NewA, 7, 385