Direct diameter measurement of a star filling its Roche Lobe
Abstract
Context. Stellar evolution in close binary systems is strongly influenced by mass transfer from one star to the other when one component fills its zero-velocity surface or Roche Lobe. SS Lep is a fairly nearby close binary showing the Algol paradox and a shell spectrum, both indicative of (past) mass transfer.
Aims. To study the process of mass transfer and its evolutionary consequences, we aim at a direct characterisation of the spatial dimensions of the different components of SS Lep with IR interferometry.
Methods. We use VINCI/VLTI interferometric observations in the K band and photometric observations from the UV to the far-IR. The visibilities are interpreted with simple geometrical models and the Spectral Energy Distribution (SED) is decomposed into the three main components: A star, M star and dust shell/disk.
Results. From the SED, we find that the main emitters in the K band are the M star and the circumstellar environment. Both are spatially resolved with the VINCI observations, showing the excess to be circumbinary and showing the M star to have a size equal to its Roche Lobe.
Conclusions. We conclude that we have, for the first time, directly resolved a star filling its Roche Lobe. The resulting mass transfer is probably the cause of (1) the circumbinary dust disk of which we see the hot inner region spatially resolved in our observations, (2) the unusually high luminosity of the A star and (3) the shell spectrum seen in the UV and optical spectra.
Key Words.:
techniques: interferometric – stars: binaries: close – stars: circumstellar matter – stars: fundamental parameters1 Introduction
Close binary evolution differs from single star evolution in many respects. The most influential events after the main sequence (MS) are undoubtedly the mass-transfer episodes. These alter the evolution of both components, their chemical composition, their orbit and they often lead to spectacular high-energy phenomena. Needless to say, such mass transfer is a very complex event with many remaining questions regarding, amongst others, stability, mass conservation and flow shape.
In her seminal paper, Cowley (1967) suggests SS Leporis to be a semi-detached binary, consisting of a MS star and a giant which fills its Roche Lobe. The system shows the Algol paradox, i.e. the most evolved component appears the least massive, which indicates past mass transfer. SS Lep is not strictly an Algol binary as it shows no eclipses. This is a consequence of its rather small orbital inclination.
Before we discuss what is known about SS Lep to date, a preliminary note on the distance to this object is essential since the debate between Post- or Pre-MS classification has been vivid (e.g. Welty & Wade, 1995). Polidan & Shore (1991) mention an early trigonometric parallax measurement of mas which places SS Lep as close as pc. However, the hipparcos parallax is only mas, corresponding to a distance of pc. Pourbaix (private comm.) confirms that any effect due to binary motion is within the noise on the hipparcos measurements and that therefore the larger distance is the correct one.
The binary nature of SS Leporis was first detected by Wilson (1914) in Lick Observatory spectrograms. It was found to have a variable absorption spectrum by Struve (1930) who also showed that the velocity variations of the sharp metallic lines are inconsistent with binary motion but rather represent phenomena produced in an expanding atmosphere. Smith & Struve (1942) also found redward-displaced emission edges at the low Balmer members and at the strongest Fe ii and Ti ii lines. Slettebak (1950) detected TiO lines in the IR spectrum of SS Lep indicating the presence of an M-type companion. Widing (1966) confirmed the presence of this M companion and proposed a Roche Lobe overflow model developed by Kraft (1958) for T CrB as working hypothesis.
Cowley (1967) was the first to determine the spectroscopic orbit (of the M star) accurately, see Table 1. Assuming an ad hoc radius for the M star of 75 R⊙ and an inclination of , she found that the M star fills its Roche Lobe but only at periastron. The orbital parameters were refined by Welty & Wade (1995) with a significant change in excentricity: instead of 0.132. They concluded that the mass-transfer at/after periastron scenario of Cowley (1967) is therefore unlikely.
| Cowley (1967) | Welty & Wade (1995) | |
|---|---|---|
| [days] | ||
| [km s-1] | ||
| [106 km] | 74 | |
| 0.24 |
Mid-IR emission features of silicate dust in the spectrum of SS Lep were first identified by Allen & Ney (1972) and Jura et al. (2001) suggested that SS Lep is surrounded by a circumbinary dust disk with large grains, responsible for the far-IR and mm fluxes, from which an evaporation wind consisting of smaller particles arises and generates the excess at wavelengths below 100 m.
We report here on the direct size determination of the M star and the circumbinary matter using near-IR interferometry.
2 Observations
2.1 Photometry
The photometric observations used to construct the SED were taken from the literature and span the entire wavelength range from the UV to the far-IR. Geneva 7-colour observations were taken from Rufener (1976). Near-IR magnitudes are those from the 2MASS PSC (Skrutskie et al., 2006) and the far-IR magnitudes were found in the IRAS PSC (Neugebauer et al., 1984). Additional observations in H,K and L are available from the CIT survey of early-type emission-line stars presented by Allen (1973). Variability in the optical is very small: 0.013 mag with a period of 130 days, i.e. exactly (Koen & Eyer, 2002). Variability in K is also very small with a detection at the level, by Kamath & Ashok (1999).
2.2 Interferometry
Interferometric observations in the near-IR (K band) were obtained with the VLTI commissioning instrument VINCI on baselines with lengths ranging from 4.7 to 121 m and position angles (PAs) from 54 to 85 East-of-North. The 338 observations cover the period from 12 December 2002 to 30 December 2003. Instrumental visibilities were derived with the standard data reduction pipeline, v3.1 (Kervella et al., 2004). The visibility calibration was done by linear interpolation of the interferometric efficiency throughout the night. The stars used as calibrators are: CMa (K1III, 2.38 mas), 31 Ori (K5III, 3.56 mas), 51 Ori (K1III, 1.87 mas), HR 2311 (K5III, 2.43 mas), HR 2549 (K5III, 2.19 mas) and HR 2305 (K3III, 1.76 mas). The Uniform Disk (UD) diameters were taken from Bordé et al. (2002).
3 Modelling
In order to have some a priori knowledge on the angular sizes and the flux contributions of the different components in the K band, we first construct an SED.
3.1 The SED
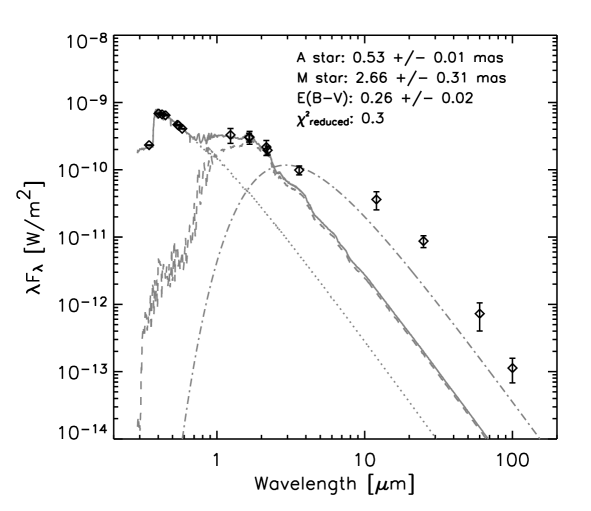
We use the photometry presented in Sect. 2.1 to construct the SED and fit111The fitting is done by comparing observed integrated flux over the filter transmission profile with the same quantity computed from the synthetic SEDs. a combination of a Kurucz model for the A star and a marcs model for the M star to the Geneva and 2MASS J,H observations. We searched for the best reproduction of the observations among the models (solar metallicity, spaced 250 K in and 0.5 dex in ) having temperatures and surface gravities roughly compatible with the spectral types (A1 and between M3 and M4.5 respectively, Welty & Wade, 1995). We chose to exclude the K and L band observations in our fit since the SED presented by Jura et al. (2001) and the VINCI observations (see Sect. 3.2) indicate some circumstellar excess already at these wavelengths. We do not fit the mid- to far-IR excess either since it is dominated by cold dust emission (450 K, Fajardo-Acosta & Knacke, 1995). The remaining free variables are the two stellar diameters and the total amount of extinction, i.e. both interstellar and circumstellar. The wavelength dependence of the extinction is modelled using the law of Cardelli et al. (1989) with R.
We find T K and log for the A star and T K and log for the M star. We note that the Geneva colours agree much better with such a low surface gravity for the A star than with that of a MS star, which is independent evidence that the A star is indeed located above the MS. A surface gravity of log =1.48 was already derived from the Geneva colours by Hauck & Jaschek (2000) but they neglected the influence of the companion. The M star’s spectral type is rather uncertain, but we find a strong constraint on its temperature from our SED: the J and H band observations sample the peak of the intensity distribution (the H- opacity minimum) in an M star and they are therefore very sensitive to its temperature. Our temperature is slightly below the temperature of a typical M4III giant and corresponds more to spectral type M6III (Perrin et al., 1998).
Our preferred model () and its parameters are shown in Fig. 1. We find clear evidence for a near-IR excess in both the K and L band observations. In the K band, at the wavelength of our interferometric observations, the A star contributes % of the flux, the M star roughly 60%. The remainder is unaccounted for in our model.
3.2 The K band visibilities
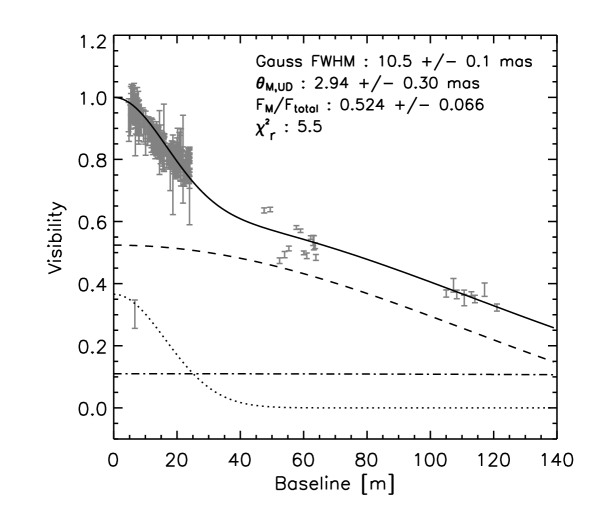
Several geometrical models are confronted with the data: a single UD, two and three concentric Uniform and/or Gaussian Disks and a binary model with possibly resolved components. A single UD yields a , and is thus clearly incompatible with the observations. A fit with two concentric UDs or a large Gaussian Disk and a smaller Uniform Disk, having three free parameters: the 2 diameters and the flux ratio, has a respectively. We should also include the unresolved contribution of the A star. The baselines are not long enough to constrain flux contribution and diameter of the A star so we use the parameters222We computed the conversion factor from the Limb-Darkened (LD) diameter derived in SED fitting to the UD diameter used for the interferometric modelling from our atmosphere models and found it to be 0.945 in the K band for the M star parameters and 0.970 for the A star. derived from the SED fit: mas and FA/F in K. This model, shown in Fig. 2, agrees rather well with the observations () and adding complexity, i.e. a possible offset between components, results in a degenerate problem: the hypersurface does not constrain the additional parameters (length and angle of the separation vector), and shows an unreasonable minimal . Fortunately, the derived diameters appear unsensitive to the introduction of such an offset. We must conclude that, while we can trust the derived diameters, the current dataset does not allow for a characterisation of possible offsets (which are time-dependent since the orbital period is of the order of 1 yr), and this is therefore the aim of future AMBER and MIDI observations (see Sect. 5). The inclusion of the barely resolved A star does not change the quality of the fit, but it does have a small influence on the derived diameter for the M star. We find the total uncertainty on the M star diameter and flux contribution with the inclusion of the uncertainty in A star flux to be 0.27 mas (10 %) and 7% respectively.
4 Discussion
We summarize the results of our SED model and interferometric observations in Table 2. The flux ratios and diameters used in our geometrical model make an association with the components seen in the SED straightforward: the UD of 2.8 mas is the M star and the Gaussian Disk is the extended component generating the excess emission in K.
| SED | VINCI | |
| [K], | 9000, 2.0 | NA |
| [K], | 3250, 1.0 | NA |
| [mas] | idem | |
| [mas] | ||
| [mas] | NA | |
| [L⊙] | NA | |
| [L⊙] | NA | |
| at 2.2 m | idem | |
| at 2.2 m | ||
| at 2.2 m | NA |
4.1 The M star: filling its Roche Lobe
Converting the measured UD diameter of the M star to a physical LD diameter yields mas or R. The uncertainty on the linear diameter includes that on the distance. This is in good agreement with the LD diameter estimated from the SED fit. Given the absence of strong variability and the O-rich nature, we believe it to be on the Red Giant Branch (RGB).
The constraint on the A star mass used by Welty & Wade (1995) to derive the inclination should be relaxed somewhat towards the upper end since we have now the confirmation that it is of luminosity class II. This yields an inclination of . Using million km or , and the generally assumed mass ratio , we find a Roche radius333, (Eggleton, 1983) , where the errorbar includes the uncertainty on the inclination.
From the observed surface gravity and radius of the M star, and the use of a reasonable mass for the A star (see Sect. 4.3), we find that the mass ratio could in fact be a little lower. This would reduce the size of the Roche Lobe for the M star.
The find that the M star radius is equal to the Roche radius, which is very strong evidence that the M star is at this moment completely filling its critical Roche equipotential and therefore that mass transfer must be taking place. This is confirmed by the shell spectrum with significant UV activity (Polidan, 1994), the presence of a circumbinary dust disk and the excess luminosity of the A star as shown below.
4.2 The excess: a circumbinary dust disk
The extended component we see in the interferometric observations has a size clearly larger than the binary separation and we are therefore certain that almost half of the K band flux comes from a circumbinary structure. We determine its brightness temperature to be K. This temperature is in agreement with the fact that we see the excess only from the near-IR onward and it corresponds more or less to the sublimation temperature of oxygen-based dust grains. This suggests that we are observing the hot inner region of the dusty circumbinary structure also generating the mid- to far-IR excess seen in the SED. A clue to differentiate between spherical or disk-like geometry is the amount of reddening. We find mag in our SED fit, which is in good agreement with the derived by Malfait et al. (1998) based on IUE data. This corresponds to at visual wavelengths. Since the line-of-sight extinction is either due to interstellar dust grains or due to circumstellar grains outside the orbital plane, we can assume them to be small444A spherical dust shell which is stable enough to allow significant grain growth is implausible: the radiation pressure would quickly drive them away.. We can therefore use the optical constants of Dorschner et al. (1995) for amorphous silicates to extrapolate the to IR wavelengths. We find an optical depth of only in the K band. The optical depth required to generate the K band excess at temperatures below that for dust sublimation is of the order of unity, and we can thus conclude that the dust geometry is disk-like rather than spherical, and seen almost face-on, as expected from the system’s orbital inclination. Note that a temperature much higher than the derived would generate excess emission also at shorter wavelengths, which is not seen in the SED. We can therefore rule-out the presence of a hot spherical circumbinary shell with significant continuum opacity.
Jura et al. (2001) suggest a circumbinary dust disk with an evaporation wind to explain the mid en far-IR spectral properties of the excess. In their scenario the disk contains mainly large ( mm) grains. These would have an optically thin temperature at our derived distance from the central stars of 1480K̇ which is in rough agreement with our derived value of 1250 K. The difference is probably due to the disk being fairly optically thick. The disk wind, consisting of smaller grains, is possibly responsible for the minimal amount of extinction still observed towards the central stars.
The presence of this dusty disk shows that the mass transfer is not conservative which is in agreement with theoretical predictions that the additional radiation pressure in the cool M star atmosphere may modify the critical Roche equipotential into a surface including both the inner and outer Lagrangian points (Schuerman, 1972).
4.3 The A star: accreting
The reaction of the primary, which has a radiative envelope, to the accretion should be expansion, as its adiabatic exponent is positive (Ritter, 1996). Indeed, we find a radius roughly ten times as large as that of a typical A1V star (R R⊙), while its mass, derived from the observed surface gravity and diameter, is not that of a (super)giant: . Kippenhahn & Meyer-Hofmeister (1977) determined evolutionary tracks for mass-accreting MS stars and find that the excursion from the MS mass-luminosity relation depends on the accretion rate and initial mass. The position of the A star of SS Lep in the HR diagram lies on the track of a 2 M⊙ star accreting M⊙/yr, after roughly 1 M⊙ has been accreted. For the mass ratio to become as large as is generally assumed (), this requires that the M star has also lost a substantial amount of mass through the circumstellar disk or a wind: otherwise, the M star would have been the least massive to begin with, which is incompatible with its more evolved status.
5 Conclusions and outlook
We conclude that SS Lep is a semi-detached binary, consisting of a late-M giant which fills its Roche Lobe and therefore loses mass to the primary star. The latter was most probably a regular MS star but now shows an increased size and luminosity due to a relatively high accretion rate. The mass transfer appears to be non-conservative since we detect an optically thick circumbinary dust disk. The shell spectrum detected at UV and optical wavelengths, in general not expected in A type stars, is thus most likely due to this ongoing mass transfer. We believe this to be the first time a Roche-Lobe filling star and the resulting circumbinary disk have been directly resolved using optical/IR interferometry.
We have planned further interferometric observations with AMBER and MIDI on the VLTI to characterize in more detail the shape and structure of both the M star and the circumstellar excess. We have also started a new spectroscopic campaign with the CORALIE instrument on the Swiss telescope at La Silla, Chile to improve the determination of the orbit and to study the gas flow dynamics.
Algol-type binaries such as SS Lep can provide a wealth of information on mass transfer and binary evolution. Optical/IR interferometric observations such as those presented here, are well suited for studies of low-inclination systems and in that way complementary to eclipse and doppler-imaging work.
Acknowledgements.
The authors would like to thank the anonymous referee for useful comments. Based on observations made with ESO’s VLT Interferometer at Cerro Paranal, Chile. The VINCI data were retrieved from the ESO/ST-ECF Archive.References
- Allen (1973) Allen, D. A. 1973, MNRAS, 161, 145
- Allen & Ney (1972) Allen, D. A. & Ney, E. P. 1972, The Observatory, 92, 47
- Bordé et al. (2002) Bordé, P., Coudé du Foresto, V., Chagnon, G., & Perrin, G. 2002, A&A, 393, 183
- Cardelli et al. (1989) Cardelli, J. A., Clayton, G. C., & Mathis, J. S. 1989, ApJ, 345, 245
- Cowley (1967) Cowley, A. P. 1967, ApJ, 147, 609
- Dorschner et al. (1995) Dorschner, J., Begemann, B., Henning, T., Jaeger, C., & Mutschke, H. 1995, A&A, 300, 503
- Eggleton (1983) Eggleton, P. P. 1983, ApJ, 268, 368
- Fajardo-Acosta & Knacke (1995) Fajardo-Acosta, S. B. & Knacke, R. F. 1995, A&A, 295, 767
- Hauck & Jaschek (2000) Hauck, B. & Jaschek, C. 2000, A&A, 354, 157
- Jura et al. (2001) Jura, M., Webb, R. A., & Kahane, C. 2001, ApJ, 550, L71
- Kamath & Ashok (1999) Kamath, U. S. & Ashok, N. M. 1999, A&AS, 135, 199
- Kervella et al. (2004) Kervella, P., Ségransan, D., & Coudé du Foresto, V. 2004, A&A, 425, 1161
- Kippenhahn & Meyer-Hofmeister (1977) Kippenhahn, R. & Meyer-Hofmeister, E. 1977, A&A, 54, 539
- Koen & Eyer (2002) Koen, C. & Eyer, L. 2002, MNRAS, 331, 45
- Kraft (1958) Kraft, R. P. 1958, ApJ, 127, 625
- Malfait et al. (1998) Malfait, K., Bogaert, E., & Waelkens, C. 1998, A&A, 331, 211
- Neugebauer et al. (1984) Neugebauer, G., Habing, H. J., van Duinen, R., et al. 1984, ApJ, 278, L1
- Perrin et al. (1998) Perrin, G., Coude Du Foresto, V., Ridgway, S. T., et al. 1998, A&A, 331, 619
- Polidan (1994) Polidan, R. S. 1994, in EUVE Proposal, 91–+
- Polidan & Shore (1991) Polidan, R. S. & Shore, S. N. 1991, in Bulletin of the American Astronomical Society
- Ritter (1996) Ritter, H. 1996, in NATO ASIC Proc. 477: Evolutionary Processes in Binary Stars, ed. R. A. M. J. Wijers, M. B. Davies, & C. A. Tout, 223–+
- Rufener (1976) Rufener, F. 1976, A&AS, 26, 275
- Schuerman (1972) Schuerman, D. W. 1972, Ap&SS, 19, 351
- Skrutskie et al. (2006) Skrutskie, M. F., Cutri, R. M., Stiening, R., et al. 2006, AJ, 131, 1163
- Slettebak (1950) Slettebak, A. 1950, ApJ, 112, 559
- Smith & Struve (1942) Smith, B. & Struve, O. 1942, ApJ, 95, 468
- Struve (1930) Struve, O. 1930, ApJ, 72, 343
- Welty & Wade (1995) Welty, A. D. & Wade, R. A. 1995, AJ, 109, 326
- Widing (1966) Widing, K. G. 1966, ApJ, 143, 121
- Wilson (1914) Wilson, R. E. 1914, Lick Observatory Bulletin, 8, 80