22email: nanda@astro.up.pt; jgrave@astro.up.pt
Spitzer-IRAC GLIMPSE of high mass protostellar objects. I
Abstract
Aims. To conduct a statistical study of candidate massive protostellar objects in the 3.6–8.0 m bands of the Spitzer Space Telescope.
Methods. The GLIMPSE archive was used to obtain 3.6–8.0 m point source photometry and images for 381 massive protostellar candidates lying in the Galactic mid-plane. The colours, magnitudes and spectral indicies of sources in each of the 381 target fields were analysed and compared with the predictions of 2D radiative transfer model simulations.
Results. Infrared point sources with intrinsic redenning were found associated with several massive protostars. Although no discernable embedded clusters were found in any targets, multiple sources or associations of redenned young stellar objects were found in many sources indicating multiplicity at birth. The spectral index () of these point sources in 3.6–8.0 m bands display large values of =2–5. A color-magnitude analog plot was used to identify 79 infrared counterparts to the HMPOs that are bright at 8 m ,centered on millimeter peaks and display values in excess of 2. Compact nebulae are found in 75% of the detected sources with morphologies that can be well described by core-halo, cometary, shell-like and bipolar geometries similar to those observed in ultra-compact HII regions.
Conclusions. The IRAC band spectral energy distributions (SED) of the infrared counterparts of massive protostellar candidates are best described to represent YSOs with a mass range of 8–20M⊙in their Class I evolutionary stages when compared with 2D radiative transfer models. They also suggest that the high values represent reprocessed star/star+disk emission that is arising in the dense envelopes. Thus we are witnessing the luminous envelopes around the protostars rather than their photospheres or disks. We argue that the compact infrared nebulae likely reflect the underlying physical structure of the dense cores and are found to imitate the morphologies of known UCHII regions. The observations are consistent with a scenario where massive protostars have formed inside dense cores and continue to accrete matter. Our results favour models of continuuing accretion involving both molecular and ionised accretion components to build the most massive stars rather than purely molecular rapid accretion flows.
Key Words.:
Stars:formation –ISM: HII regions–infrared:stars1 Introduction
The Spitzer Space Telescope with its IRAC camera is bringing in a revolution to our understanding of the star formation process by opening a great depth in sensitivity and mapping speed at the 3.6–8.0 m region of the infrared spectrum. The Galactic mid-plane has been mapped in these bands through the Science Legacy Program GLIMPSE. Much of the massive star formation in the galaxy occurs in its mid-plane; the availability of the point source photometry catalog and the image cutouts facility from the GLIMPSE program thus gives us a chance to study the statistical properties of candidate massive protostars.
In more than a decade long effort to study the early stages of massive star formation, four major surveys to search for massive protostellar candidates have been completed covering both the northern and southern hemispheres of the sky. These surveys are described in Molinari et al. (1996), Sridharan et al. (2002), Fontani et al. (2002) and Faúndez et al. (2004). Hereafter we will refer to them as Sri02, Mol96, Fon02 and Faun04. Follow-up studies of many of these targets to study the dust continuum properties have also been made (Beuther et al. 2002a; Beltrán et al. 2006; Molinari et al. 2000). All these surveys are based on a selection criteria using constraints on far-infrared (FIR) colours and choosing additional sign-posts of star formation, in an effort to identify phases of massive star formation prior to the onset of an ultra-compact HII (UCHII) region. The surveys are therefore, all based on FIR and millimeter observations that can probe into great depths of column density usually found in the dense cores that form massive stars. However, the large distances at which massive star forming regions are typically found and the moderate beam sizes of FIR and millimeter telescopes used for these surveys have limited the spatial size scales of observations to typically 0.1 pc or larger. Dense cores with such physical dimensions may host a single high mass protostellar object (HMPO) or a cluster of embedded stars. For example, using near-infrared (NIR) 2MASS data, Kumar et al. (2006) showed that 25% of the HMPOs from Mol96 and Sri02 surveys are associated with embedded clusters. The Spitzer-IRAC 3.6–8.0 m observations from the GLIMPSE survey provides an extra edge over the previous FIR and mm observations to probe into smaller spatial dimensions. At a comparable spatial resolution to the 2MASS data, the 8 m GLIMPSE data can penetrate into extinction depths approximately four times better than the 2MASS K band data assuming sensitivity limits of 14 and 12 magnitude from 2.2 and 8 m and using the measurement that A8μm/AK=0.5 (Flaherty et al. 2007). The full-width half maximum of the Spitzer-IRAC point spread function is 2.4″which at a distance of 5 kpc will trace a projected size of 10,000 AU. This is typically the size of an extended envelope or a toroid around a HMPO.
In this article (Paper I), we present a statistical analysis of the mid-infrared (MIR) properties of about 381 HMPO candidates, based on the publicly available GLIMPSE database. We aim to identify the infrared counterparts of the millimeter cores, evaluate their colour properties and search for embedded clusters associated with the HMPO targets. The emission from disk and envelope regions around young stellar objects (YSO) are known to deviate significantly from that of a normal star in the 3.6–8.0 m bands allowing the YSO classification into various evolutionary stages. While the millimeter observations are more useful to estimate the mass of the dense cores in which HMPOs are born, the GLIMPSE data will enable us to constrain the evolutionary stages and mass ranges of any point sources associated with HMPOs. In Paper II (Grave & Kumar 2007) we will present an analysis of various physical parameters of well identified individual sources derived from modelling the infrared-millimeter spectral energy distribution using radiative transfer models.
2 Data selection and analysis
The sample of objects are derived from the four surveys of HMPOs as listed in Table. 1. An estimate of the FIR luminosity and distance is available for most of the targets within the usual uncertainity factors. Distance estimate is missing for about 60 targets from Mol96 and Fon02 are not available from the original papers of which about 20 targets were detected in GLIMPSE. For such targets we have assumed a fiducial mean distance of 5kpc. As evident from Table. 1, data in the GLIMPSE catalog was available for 80% of all the targets. We used both the GLIMPSE point source catalog (highly reliable) and the GLIMPSE point source archive (less reliable and more complete) to search for available data. Photometric data in the four IRAC bands at 3.6, 4.5, 5.6 and 8.0 m were obtained centered on each target.
For the purpose of cluster detection, point source data was extracted in a 600″ diameter circle centered on each target and a detection in any one of the four bands was considered as a source. For the purpose of identifying infrared point sources and analysing their spectral properties, data was extracted from a region of 100″ radius centered on each target with the constraint that the source be detected in at least 2 of the four bands with a minimum of 3 detection in each of the four bands. There is one important caveat in using the point source photometry catalog. Several HMPO candidates are very bright in the IRAC bands (particularly in the 8m band) resulting in a saturated signal on the images and null data in the point source catalog. Such objects may indeed be the best counterparts of the HMPO targets in the list but will not be found in our analysis. However, such sources can be seen on the actual images where a saturated bright red-star and/or a compact nebulae can be found associated with FIR and millimeter peaks.
3 Clustering around HMPO targets
The point source data extracted in a 600″ circle around each target was Nyquist binned with bin sizes of 60″ and 120″ and contours of 2 and above were plotted to identify any clustering around each target. Data was available for 381 out of 500 targets derived from all the four surveys for which star count density enhancements were checked. No significant clusters were detected around any of the targets although weak associations emerged when point sources only in the 5.8 m band were considered. Given the non-consistency of such weak detections depending upon the photometric band used to obtain the point sources, we conclude a null result for cluster detections for the targets surveyed. In contrast, using a similar technique with 2MASS point source catalog, Kumar et al. (2006) were able to detect 54 clusters from the Mol96 and Sri02 samples, for all the targets that fell away from the galactic mid-plane.Kumar et al. (2006) survey could not find any clusters in the Galactic mid-plane owing to the high extinctions in this region. While the GLIMPSE survey could easily probe in to the Galactic mid-plane and found several infrared counterparts and nebulae which will be discussed in following sections, the lack of cluster detection is due to a reduced sensitivity to lower mass stars and an increased contamination of background and foreground star counts. The GLIMPSE survey data is sensitive only to 2-4M⊙ pre-mainsequence stars at a distance of 3kpc owing to the short exposure times of 2 seconds in each photometric band. Embedded clusters around massive stars are mostly composed of lower mass components which will not be detected at this sensitivity. Therefore the null result here only implies the absence of major embedded clusters with massive members and/or ensembles of several hundred members.
4 Point sources associated with HMPO targets
Although no prominent clusters were detected in the target fields, a large number of point sources were detected in each target field of 100″ radius with good detections in all four bands. The 100″ limit on the radius was chosen because the dust continuum emission, mapped in the millimeter wavebands generally display emission restricted to this limit indicating that the cores/clumps are fairly compact around the IRAS sources. Thus, any MIR point sources within these limits may be associated with such dense cores/clumps forming the massive protostars. It is important to note that all the four surveys have selected HMPO candidates as “isolated luminous IRAS point sources” meaning that the FIR emission is localized and point like. Also, almost all these targets are situated away from major HII regions and in some cases at the boundaries or outskirts of well known HII regions. Therefore, while some of the targets may be contaminated with lower mass younger protostars, most infrared point sources found in the target fields are likely candidates of intermediate or massive protostars. In the following we will use the color-color and color-magnitude analysis to converge on candidate massive protostars.
4.1 Colors and Spectral Indicies
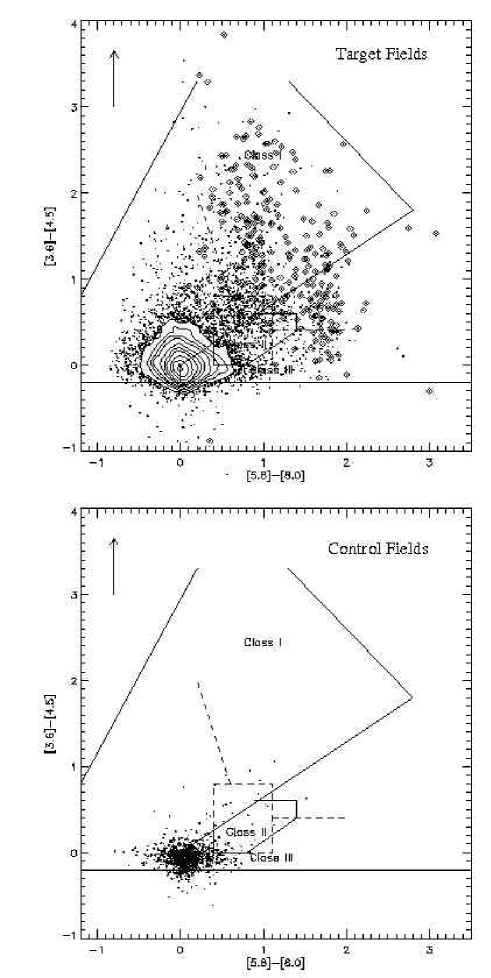
Figure. 1 (top panel) shows a [3.6-4.5] vs [5.6-8.0] color-color diagram for all the sources detected from all target lists. The main concentration of points at (0,0)(shown using contours) represent photospheres and higher values on both x and y axis represent YSOs considered to be at different evolutionary stages. The solid lines delineate the regions typical of sources at different evolutionary stages such as I, II, and III based on the 2D radiative transfer model data of Robitaille et al. (2006)(hereafter RWIWD06). It can be seen that there are sources occupying regions representative of all the three classes namely I, II, III with a significant fraction inside the Class I and II zones. The diamond symbols encircling the points represent candidate massive protostars based on a selection criteria that is described in Sec.4.2.
The bottom panel in Fig. 1 shows the colors of point sources extracted from a total of 40 control fields; with 10 random fields located 0.5 degrees adjacent to the target fields in each of the survey lists. The control fields were similar in area to the target fields with a radius of 100″. It can be noted that the sources in these control fields represent mostly pure photospheres except for some contamination in the Class II and Class III zones. The Class I zone is empty in the control field plot. The contamination in the Class II and III zones in the control fields could be because some of the HMPO targets are located in the vicinity of larger HII regions which can contain infrared excess sources. However, the highest infrared excess sources such as Class I objects are only associated with the target fields that are known to encompass dense cores with an embedded luminous FIR source.
Although the color-color diagram is useful to identify infrared excess emission of the observed targets, a quantitative measure is to compute the spectral index of these sources in the observed bands. By using a simple least squares linear fit to the observed spectral energy distribution, we computed the spectral index in the four IRAC bands for each point source. Figure. 2 shows a histogram of the relative distribution of values for the point sources associated with the massive protostellar targets. A similar distribution obtained for Spitzer-IRAC sources in the IC348 cluster and for the YSOs in the Orion A cloud are shown for comparision. For example, in nearby embedded cluster IC348 (Lada et al. 2006) (3Myr old low mass cluster), the values are less than 2 because the sources are less embedded and relatively more evolved at Class II or III stages. In the Orion A cloud (1 Myr old and more massive cluster), the YSOs (note that the photospheres are removed for clarity) show relatively higher compared to IC348 sources. The YSOs in Orion are more embedded and are relatively younger at Class I and II stages in Orion A. The point sources associated with the massive protostellar candidates show values between 2 and 5 and some even at 6. Such high sources have been observed in a wide field study of the massive star forming region DR21/W75N where the high sources were found to be well correlated with the location of HMPOs and/or UCHII regions (Kumar et al. 2007). Thus the values serve as a good indicators of the density of the surrounding medium in which the sources are embedded. Deeply embedded Class I sources are also known to produce high values which has been observed in the Serpens and Orion regions (Megeath et al. 2007). We shall discuss the relevance of high values for this particular case in Sec.6.
It is evident from the results above that the spectral index is only representative of the slope of the spectral energy distribution which can be produced by point sources of different luminosities. Infact a low mass young stellar object viewed through a column of high optical depth can produce a large spectral index if detected with sufficient sensitivity. The interest in this study is to identify massive protostellar candidates and for a target situated at a fixed distance and viewed through a fixed extinction, it is the brightness or luminosity of the source that identifies the massive objects. Therefore a color-magnitude diagram is needed to isolate sources with high luminosity as well as large infrared excess.

4.2 Spectral index vs Magnitude diagrams
The sources in our target list are at different distances and a comparision of colors and magnitudes is possible only by correcting for distance and line-of-sight extinction. The distances to individual targets and luminosities were obtained from the respective survey papers listed in Table.1. However, the line-of-sight extinction to each source is not easily available and its estimation can vary depending upon the method and wavelength used to make the extinction measurement . We therefore applied only the distance correction and converted the photometric magnitudes to absolute magnitudes for each source using the appropriate distance. Since the extinction correction is not made and the IRAC [5.8-8.0] colour shows no difference for a reddenned object (note that the reddenning vector is vertical) some luminous reddenned background giants can contaminate the sample. However, these contaminations can reduce when objects are selected through the AM product criteria described below since the spectral index as a whole enter into the AM product.
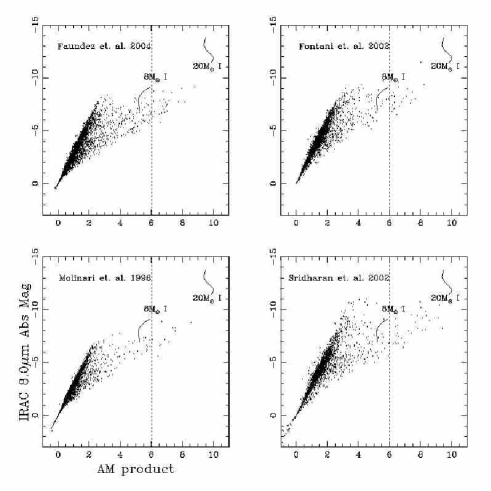
Next, we found that a simple colour magnitude diagram is confusing because of a large scatter of points around the region occupied by main-sequence stars. For example the scatter due to observational errors and different line-of-sight extinction shows a significant spread at (0,0) in the color-color diagram shown in Fig. 1 which translates to a spread of similar width on a color-magnitude diagram. To reduce this scatter effect, and to separate more effectively the luminous members, we define a product called the “AM product” (Alpha-Magnitude product), meaning the product of the spectral index and absolute magntidue for a source. For convenience of plotting, we define AM = -M (+6)/10 where M8μm is the 8.0 m absolute magnitude of the source and is the observed spectral index. The constants 6 and 10 in the above equation were chosen arbitrarily to separate the high sources from the rest effectively. For example a source of M8μm=-5 with values of 0 and 3 will have AM product of 3 and 4.5. Recall the necessity of computing AM product to obtain luminous sources along with their high colours rather than separating due to colours alone as explained early in this section. Figure. 3 shows AM vs 8.0 m absolute magnitude plots for the sources associated with targets from the four different surveys. Two model curves for a 8M⊙ and a 20M⊙ Class I objects from RWIWD06 are shown in this figure for comparision with the observed points. The model curves represent the locus of points with a particular mass and for all inclination angles.
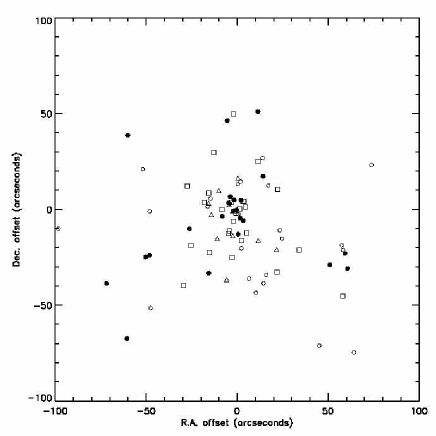
It can be seen from Fig. 3 that while most points are concentrated around the dense slanting branch representative of photospheres, a significant fraction occupy the zones representative of young stellar objects. The area encompassed by the curves representing Class I sources of 8M⊙and 20M⊙are well separated from the rest of the points, suggesting the presence of massive protostars. All sources with AM product higher than 6 delineated by the vertical line in Fig. 3 are considered as candidate infrared counterparts to HMPO targets. A total of 79 point sources with photometry available in all four IRAC bands could be classified as HMPO targets. The number of HMPOs detected in Mol96, Sri02, Fon02 and Faun04 are 11, 27, 23 and 25 respectively. This count does not include the brightest counterparts which are saturated in the IRAC bands. More rigorous isolation of HMPO sources using measurements at other wavelengths and constructing SEDs over larger wavelength range will be discussed in Paper II. Figure. 4 shows a spatial plot of the high AM product sources with respect to the IRAS PSC central coordinates for each target field. It can be seen that while there is some spread of these sources within an 100″box, most sources with high AM values are centered on the IRAS peaks in the target fields. The associated millimeter dust continuum peaks also shows some scatter with respect to IRAS centers (e.g. see Beuther et al. (2002a)). The observed scatter is consistent with the spread of the centers of the 1.2mm peaks from the respective IRAS positions. Thus, the correlation between the IRAS centers and the IRAC-point sources with high AM products suggest that we are indeed observing some of the MIR counterparts of the candidate massive protostars.
In summary, most of the high AM sources in the Class I region of Fig. 1 are very good candidates, although the high AM sources with [5.8-8.0]0.4 colours could also be reddenned photospheres. Some of the candidates are likely evolved protostars and some can imitate red colours due to nebular contamination; therefore a complete SED analysis will be utilised to remove such confusions in Paper II.
5

5 Compact Nebulae
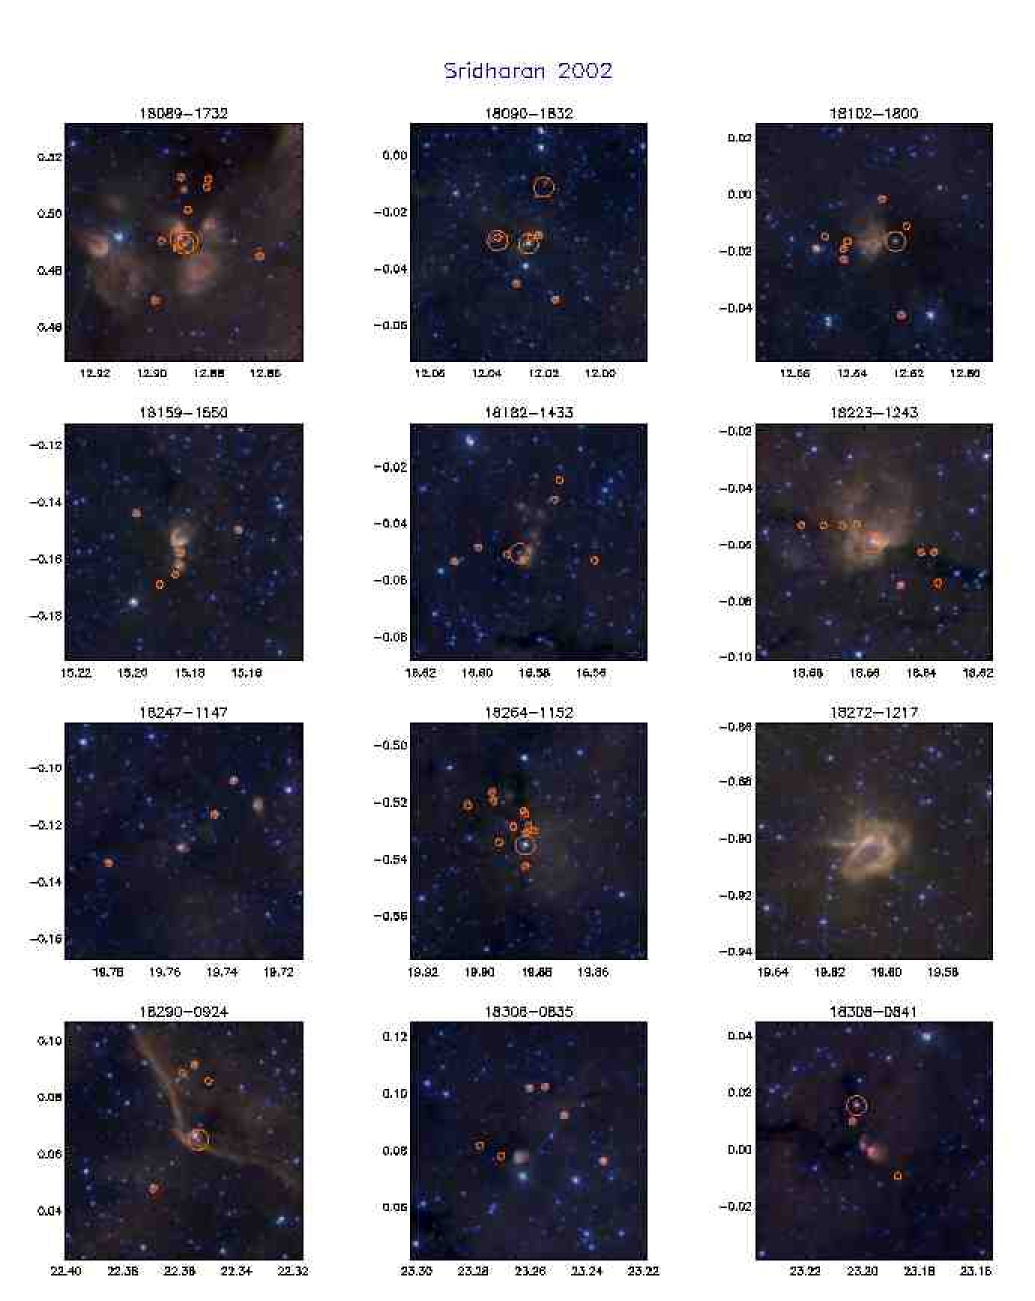
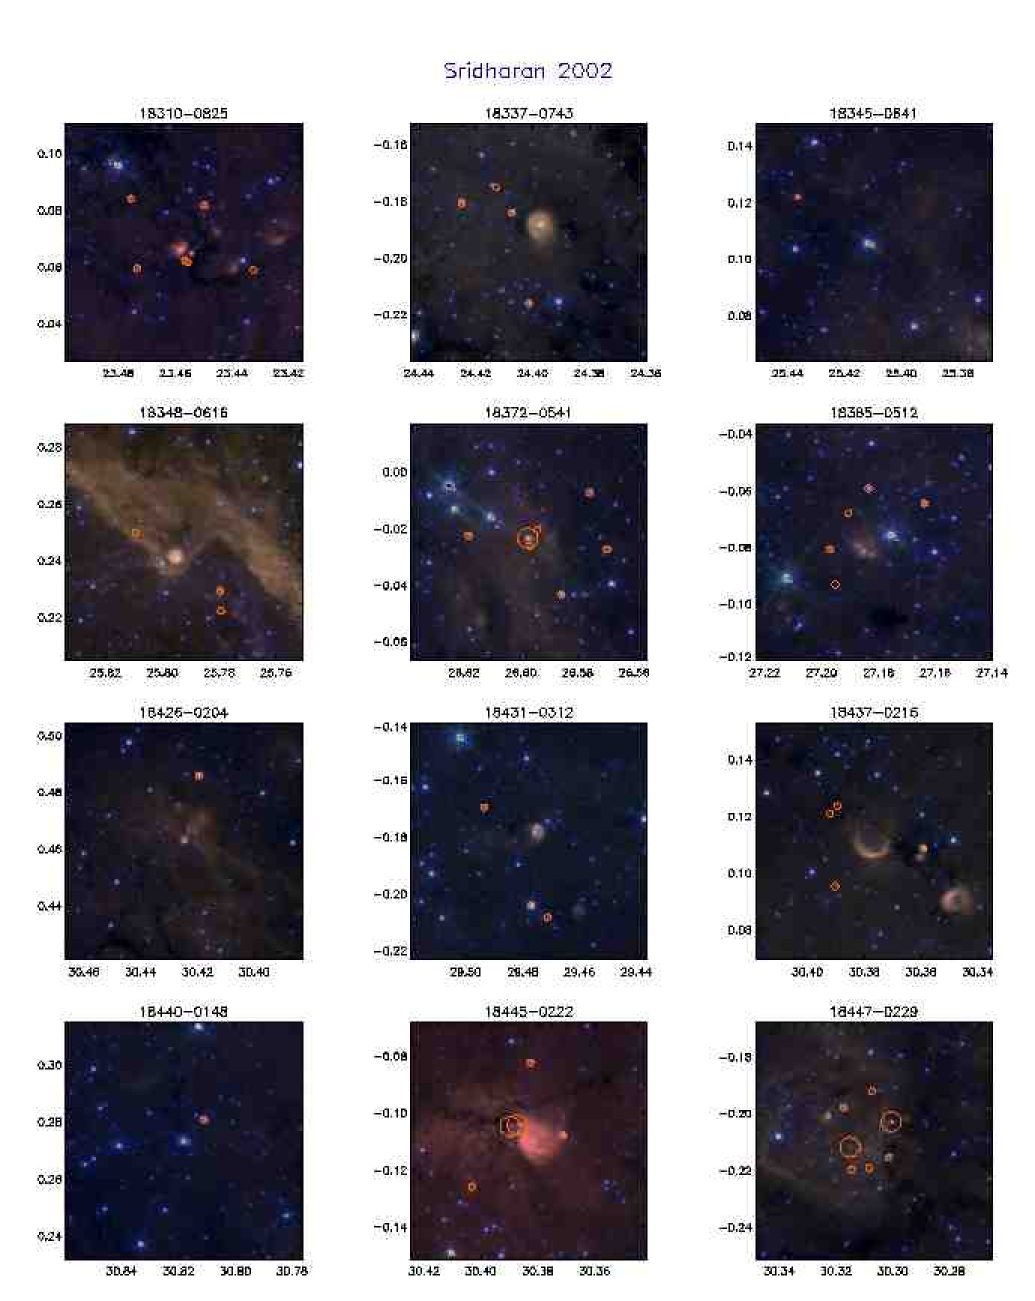
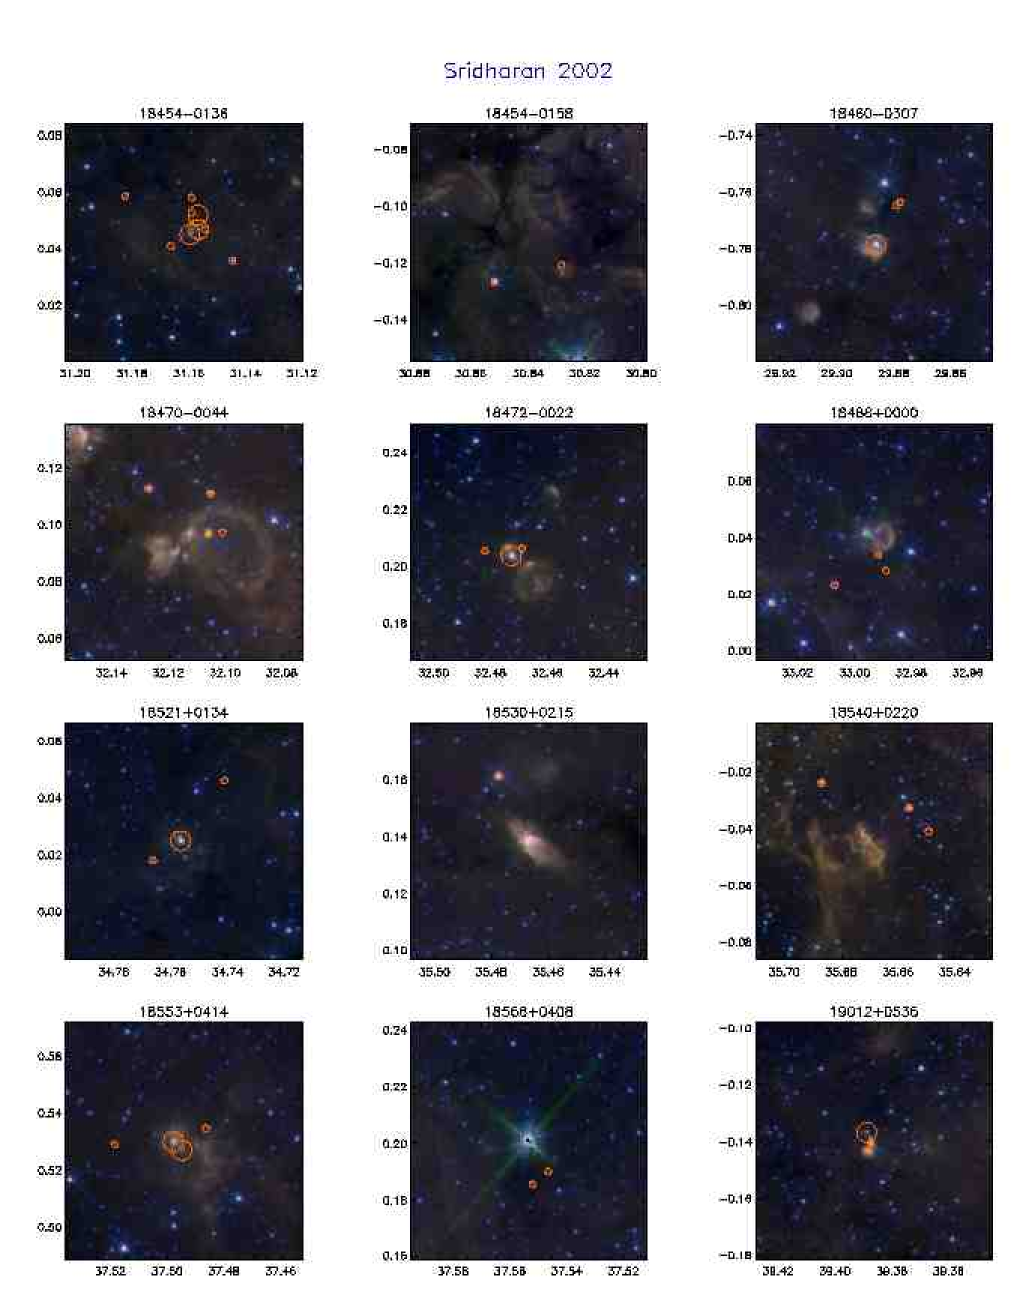
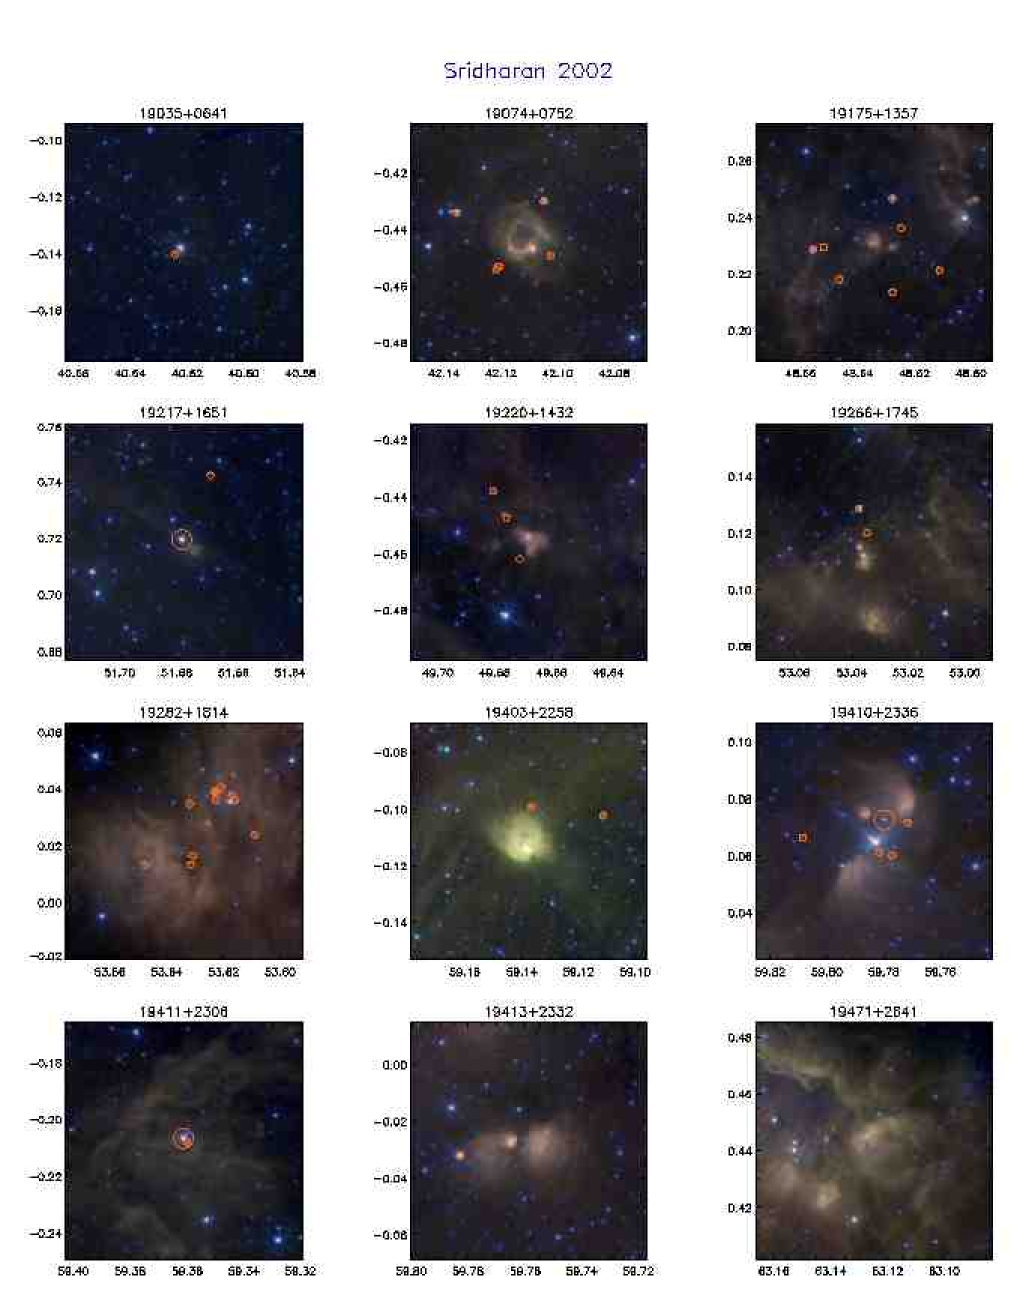
As mentioned in Section. 2, many infrared counterparts to HMPOs can be very bright in the IRAC bands saturating the detectors, resulting in null data in the photometry catalog. Also, interesting nebulae around HMPOs can not be analysed using point source photometry catalog. We therefore used the image cutouts facility available on the IRSA webpage to retrieve IRAC images of size 300″ centered on each target. These images reveal compact nebulae (10″-60″angular sizes) around several targets. Detection statistics of these nebulae are listed in Table. 1. The nebulae are found to be brightest in the 8 m band and mostly invisible in the 3.6 m IRAC band. We have used the 4.5, 5.8 and 8.0 m band images coded as blue, green and red respectively to generate composite false color images for the observed nebulae. The false color images for Sridharan et al. (2002) targets are shown in Fig. 5 (available online)111The color composites for the Mol96, Fon02 and Faun04 surveys can be accessed at http://www.astro.up.pt/ nanda/hmpo/. In these figures large circlular symbols represent sources with AM values greater than 6 and small circles represent sources with AM values between 4 and 6. In some cases, although the circular symbols are absent, a bright saturated star can be found at the center of the field, which corresponds to the massive protostars. In Paper II, these sources will be modelled using data from 2MASS and mm bands as well.
Among the four target samples, Sri02 sample is supposed to represent the youngest HMPO candidates as that sample used a criteria to select targets without any significant radio continuum emission. Mol96 and Fon02 samples are known to have a mixture of source with and without significant radio continuum emission while Faun04 list contains several well-known UCHII regions. Although most of the nebulae in our figures are restricted to the extracted 300″region, the nebulae in Sri02 which represents the youngest sample are relatively more compact. A careful examination of Fig. 5 will reveal that the nebulae associated with HMPO targets repeatedly display cometary (e.g.: I18437-0216), core-halo (e.g: I18337-0743, I19403+2258), shell like (e.g.: I19198+1423), gaussian (e.g: I19074+0752) and bipolar (e.g.:I18530+0215, I19213+1723) morphologies. A rough size of these nebulae was measured on each 8 m image using the ruler option on the SAOIMAGE DS9 image display widget. Some images display only a single well defined nebula whereas some others show a group of compact nebulae. In such cases where multiple components were found, we measured the mean size of the smaller components and also the upper limit of the overall size inside which the small components are embedded. A histogram of the angular scales converted to projected distances of these nebulae are shown in Fig. 6. The sizes are typically in the range 0.1-1.0 pc with a mean value of 0.5 pc. Even the most extended nebulae projects to a maximum of 2.5 pc. Therefore the dimensions of the infrared nebulae are similar to or smaller than the size of dense cores as traced by the 1.3mm continuum maps. UCHII regions display similar morphologies on high resolution radio continuum images (Kurtz et al. 1994) and bipolar shapes are representative of outflows. The 8.0 m band is dominated by PAH emission which is known to be a tracer of radiation temperature. Ionising radiation from young massive stars, that may not yet be strong enough to produce a significant ionised region may therefore be traced by these infrared nebulae. Indeed a recent investigation has shown that the underlying structure of the ISM in such nebulae can possibly be inferred using the morphology of the nebulae at various density regimes and ionizing fluxes (Heitsch et al. 2007). Therefore, the morphology of the nebulae found here may well indicate the morphology in which ionising radiation is escaping from the underlying set up of physical structures close to the star. Recently Churchwell et al. (2006) have used the GLIMPSE images to identify bubbles around OB stars in the Galaxy and argue that the smaller bubbles around several B stars are those produced by relatively soft radiation which fails to produce significant HII regions. The nebulae presented here may well represent such bubbles or could be simple reflection nebulae due to an evolved generation of B stars.
6 Discussion
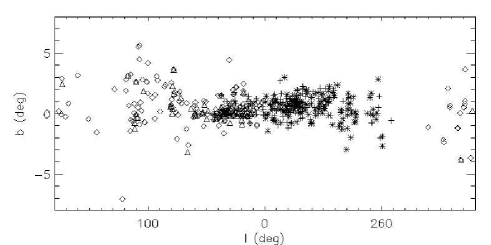
All the four sample sets of targets used in this study have FIR luminosities in the range 103–105L⊙ and satisfy similar FIR colour criteria. Nevertheless, the targets from Fon02 and Faun04 surveys reveal significantly large number of nebulae and redenned sources in comparision to targets from the Sri02 and Mol96 samples. To understand these variations among the samples, we plotted the galactic positions of all targets (Fig. 7) and found that the Fon02 and Faun04 targets are concentrated in the galactic mid-plane(b=2) and close to the galactic center (l=0-40 and l=280-360) whereas the Sri02 and Mol96 targets are situated relatively away from the galactic center (l=10-220) and also have a wider distribution with respect to the mid-plane (b=3). The Faun04 sample also contains a large fraction of well known UCHII regions which are found in the Galactic mid-plane. The HMPO candidates from the RMS survey also show similar concentration limited to the inner plane of the galaxy (Urquhart et al. 2006). Since the Spitzer bands are well suited to probe the mid-plane and most HMPO candidates are concentrated in this area, the highest number of nebulae found in the samples of Fon02 and Faun04 is not a surprise. This result also indicates that much of the on-going massive star formation is also found within the Galactic mid-plane in accordance with the known scale height of 100pc for OB stars. The location of the largest number of GLIMPSE nebulae in the mid-plane also explains why Kumar et al. (2006) did not find clusters in this region where the 2MASS K band suffers high extinction.
As shown in Sec. 3 the null result of cluster detection does not necessarily imply the absence of embedded clusters. For example, deep near-infrared imaging of the source I19343+2026 (at 0.5″seeing and K =19mag limit) shows a rich cluster at 2 m and only a few stars in the Spitzer data. This may suggest that many of the compact nebulae found in the Spitzer data may indeed be undetected embedded clusters. In such an event, the cluster statistics of 25% derived by Kumar et al. (2006) is clearly a lower limit for the HMPO candidates. This result will have important consequences on the nature and evolutionary state of the high mass dense cores studied so far.
The point sources detected from the GLIMPSE survey show colors and magnitudes representative of young stellar objects in the mass range 8M⊙–20M⊙ and in the evolutionary stages between Class I and III. The high values indicate a steeply rising Spectral Energy Distribution in the 3.6–8.0 m region and mostly show non-detections in the 2 m K band from 2MASS. The radiative transfer models database from RWIWD06 was used to examine the individual components of emission for each model, namely the star, disk and envelope contributions. In these models by RWIWD06, radiation arising from each of the entities namely star, disk and envelope are computed. For example, the envelope emission in these models are calculated as radiation originating in the envelope but not necessarily produced inside the envelope. Reprocessed star light for which the envelope is the starting point is treated as envelope emission. Comparing the individual model components from star,disk and envelope, we find that the observed data in IRAC bands are best described by the envelope emission component. In most cases, the stellar photosphere and/or the accreting disk have very little or absent contribution in the IRAC bands. Therefore the high values in the IRAC bands is mostly due to emission arising in envelopes which is due to reprocessed star and/or stardisk emission. In most cases, the stellar photosphere and/or the accreting disk have no directly contributing emission in the IRAC bands. Thus we are witnessing the envelopes of massive young stars through these observations. The model parameters that fit the observed data well suggests that a majority of the HMPO candidates host massive protostars in the mass range 8M⊙–20M⊙ and beyond. More rigorous identification of individual HMPOs can be made by constructing the SED over a longer wavelength range at similar spatial resolution and modelling them with radiative transfer analysis. In Paper II we will discuss the results from such an analysis of individual massive protostars by building the SED with all available data in the literature.
Thus far, the analysis presented here indicates the presence of HMPOs identified by their shining envelopes that are embedded in compact infrared nebulae. Apart from this infrared view, we know apriori from the original survey papers of these HMPOs that they are dense cores with high column densities (Beuther et al. 2002a), ongoing infall (Fuller et al. 2005) and outflow activity (Beuther et al. 2002b; Zhang et al. 2005). High sensitivity observations with the Very Large Array (VLA) show unresolved centimeter continuum emission associated with many of these point sources (Molinari et al. 1998; Carral et al. 1999; Zapata et al. 2006), some of which are also known to be well identified driving sources of massive molecular outflows (Beuther et al. 2004). For example in the sample of Mol96, we found IR counterparts for 27 unresolved VLA sources within a 5″radius, of which most had a saturated flux at 5.8 m and 8 m bands. Six sources had data in all bands and satisfied the criteria of high AM sources and all these six sources coincide with the VLA peaks to an accuracy of 3″. In an effort to separate HMPOs based on centimeter continuum emission Urquhart et al. (2006) find several MSX sources with and without radio continuum emission, implying that a large fraction of the sources indeed display centimeter continuum emission along with other signposts of HMPOs such as millimeter and FIR emission. Carral et al. (1999) found accurately matching compact 3.6cm continuum sources associated with the dust emission peaks of 12 sources derived from Sri02 and Mol96 samples. Among them, four sources lie in the galactic plane covered by GLIMPSE data and we find high AM sources in all the four sources. The complete list of sources that satisfy the HMPO criteria and their correlation with the observed centimeter flux will be discussed in Paper II. The centimeter continuum emission represent free-free emission in ionized gas, and thought to trace the ultra-compact or hyper-compact HII regions around some of the HMPOs situated inside the thick shining envelopes described above. From the available data, although it is impossible to rule out the possibility that all of this emission is arising from jets, it is also improbable that the centimeter emission in all these sources are originating in jets (e.g Zapata et al. 2006). If we assume that a good fraction of the observed centimeter peaks are HII components and add the result from this work that they are associated with IR counterparts satisfying the HMPO criteria along with other sign-posts of on-going accretion such as outflow and disk, we are then witnessing a combination of ionised and molecular material around accreting stars. This may suggest that the accretion is on-going and likely composed of both molecular and ionised components of gas. The presence of ionised matter may be particularly true when the embedded star is close to 20M⊙ or more. Ionised accretion flows are well demonstrated by the study of UCHII region such as G10.6-0.4 (Keto 2002a) and accretion signatures in the Br line profiles (which can represent ionised gas) in some massive young stars (Blum et al. 2004). Combining the implications of observations from the centimeter and millimeter to the infrared thus leads us to a scenario where the dense cores are hosting precursors to OB type stars, some of which have even produced a compact ionized region and continue to accrete, adding more mass to the central star. Such a process may be of particular importance in producing O stars. Therefore these observations are supportive of massive star formation scenarios through continuuing accretion process with a combination of both molecular and ionized gas components (Keto 2002, 2003) rather than rapid accretion of molecular gas alone (McKee & Tan 2003). Rapid accretion of molecular gas alone may be prominent only in the very early (and short time scale) class O phase of the HMPOs, observed in some “mm-only” type of objects (e.g. Hill et al. 2006).
7 Summary & Conclusions
We have used the GLIMPSE point source catalog and the image cutouts facility to investigate the properties of candidate massive protostellar objects distributed over the northern and southern hemispheres of the sky. Data were found for 381 out of 500 examined targets. The analysis of the point source photometry and images can be summarised as follows:
-
•
The GLIMPSE data could probe in to the HMPO targets in the Galactic mid-plane revealing their IR counterparts. No significant clustering was observed around HMPO targets, however, multiple components or isolated bright point sources with intrinsic redenning were found in most cases indicating multiplicity at birth.
-
•
Color-Color diagram analysis of point sources found in the target fields and 40 randomly selected control fields clearly demonstrate the presence of redenned Class I and II type sources lying in the target fields. The spectral index () of such point sources computed using fluxes in the IRAC bands display high values of 3-5 suggesting their deeply embedded nature in dense cocoons around the HMPOs. Absolute magnitude vs alpha-magnitude (AM product) diagrams demonstrate that these point sources occupy zones that are representative of massive young stars ranging in the mass between 8–20M⊙ or more, implying the presence of massive protostars.
-
•
A total of 79 point sources could be classified as HMPO candidates, and they display a good spatial correlation with the associated IRAS sources.
-
•
Nearly 60% of the targets are surrounded by compact infrared nebulae, particularly luminous in the 8 m band. These nebulae display morphologies similar to UCHII regions such as cometary, core-halo, shell and bipolar shapes. The size distribution of these nebulae for the Sri02 and Mol96 sample (which are assumed to be youngest subsets) display a characteristic size scale of 0.1-1 pc, with a mean value of 0.5 pc, showing that the nebulae are limited to the boundaries of the dense cores mapped by the millimeter continuum emission and may be reflecting the underlying physical structure of these cores.
-
•
The GLIMPSE view suggests that the massive star forming dense cores contain precursors to OB stars shining through their thick envelopes and surrounded by compact infrared nebulae. The observed correlation of unresolved centimeter continuum emission from VLA and the GLIMPSE counterparts suggest that some of these HMPOs have produced an ultra/hypercompact HII region close to the star and continue to accrete matter. Therefore both ionized and molecular components of accretion are likely involved in building the most massive stars such as O stars. The observations thus favour a scenario of massive star formation through continuuing accretion involving both molecular and ionised flows rather than rapid accretion of molecular gas alone.
Acknowledgements.
We thank the referee Tom Megeath and the editor Malcolm Walmsley for useful suggestions that has improved the presentation of the paper and also for providing the Orion data for comparision. MSNK and JMCG are supported by a research grant POCTI/CFE-AST/55691/2004 and JMCG is supported by a doctoral fellowship SFRH/BD/21624/2005 approved by FCT and POCTI, with funds from the European community programme FEDER. This research has made use of the NASA/ IPAC Infrared Science Archive, which is operated by the Jet Propulsion Laboratory, California Institute of Technology, under contract with the National Aeronautics and Space Administration.References
- Beltrán et al. (2006) Beltrán M. T., Brand, J., Cesaroni, R., Fontani, F., Pezzuto, S., Testi, L., Molinari, S. 2006, A&A, 447, 221
- Beuther et al. (2002a) Beuther, H., Schilke, P., Menten, K. M., Motte, F., Sridharan, T. K., Wyrowski, F. 2002, ApJ, 566, 945
- Beuther et al. (2004) Beuther, H., Schilke, P., Gueth, F. 2004, ApJ, 608, 330
- Beuther et al. (2002b) Beuther, H., Schilke, P., Sridharan, T. K., Menten, K. M., Walmsley, C. M., Wyrowski, F. 2002, A&A, 383, 892
- Blum et al. (2004) Blum, R. D., Barbosa, C. L., Damineli, A., Conti, P. S., Ridgway, S. 2004, ApJ, 617, 1167
- Carral et al. (1999) Carral, P., Kurtz, S., Rodríguez, L. F., Martí, J., Lizano, S., Osorio, M. 1999, Rev.Mex.A&A, 35, 97
- Churchwell et al. (2006) Churchwell, E., Povich, M. S., Allen, D., Taylor, M. G., Meade, M. R. et al. 2006, ApJ, 649, 759
- Faúndez et al. (2004) Faúndez, S., Bronfman, L., Garay, G., Chini, R., Nyman, L.-Å, May, J. 2004, A&A, 426, 97 (Faun04)
- Flaherty et al. (2007) Flaherty, K. M., Pipher, J. L., Megeath, S. T., Winston, E. M., Gutermuth, R. A., Muzerolle, J., Fazio, G. G. 2007, ApJ (astroph/0703777)
- Fontani et al. (2002) Fontani, F., Cesaroni, R., Caselli, P., Olmi, L., 2002, A&A, 389, 603 (Fon02)
- Fuller et al. (2005) Fuller, G. A., Williams, S. J., Sridharan, T. K. 2005, A&A, 442, 949
- Grave & Kumar (2007) Grave, J. M. C., Kumar, M. S. N. 2007, Paper II, in preparation
- Heitsch et al. (2007) Heitsch, F., Whitney, B. A., Indebetouw, R., Meade, M. R., Babler, B. L, Churchwell, Ed. 2007, ApJ, 656, 227
- Hill et al. (2006) Hill, T., Thompson, M. A., Burton, M. G., Walsh, A. J., Minier, V., Cunningham, M. R., Pierce-Price, D. 2006, MNRAS, 368, 1223
- Indebetouw et al. (2005) Indebetouw, R., Mathis, J. S., Babler, B. L., Meade, M., Watson, C., Whitney, B. A.,et al. 2005, ApJ, 619, 931
- Keto (2002) Keto, E. 2002, ApJ, 580, 980
- Keto (2002a) Keto, E. 2002, ApJ, 568, 754
- Keto (2003) Keto, E. 2003, ApJ, 599, 1196
- Kumar et al. (2006) Kumar, M. S. N., Keto, E. R., Clerkin, E. 2006, A&A, 449, 1033
- Kumar et al. (2007) Kumar, M. S. N., Davis, C. J., Grave, J. M. C., Ferreira, B., Froebrich, D., 2007, MNRAS, 374, 54
- Kurtz et al. (1994) Kurtz, S. E., Churchwell, E., Wood, D. O. S., 1994, ApJS, 91, 659
- Lada et al. (2006) Lada, C. J., Muench, A. A., Luhman, K. L., Allen, L, Hartmann, L., et al. 2006, AJ, 131, 1574
- McKee & Tan (2003) McKee, C. & Tan, J. 2003, ApJ, 566, 931
- Molinari et al. (1996) Molinari, S., Brand, J., Cesaroni, R., Palla, F. 1996, A&A, 308, 573 (Mol96)
- Molinari et al. (1998) Molinari, S., Brand, J., Cesaroni, R., Palla, F., Palumbo, G. G. C. 1998, A&A, 336, 339
- Molinari et al. (2000) Molinari, S., Brand, J., Cesaroni, R., Palla, F. 2000, A&A, 355, 617
- Megeath et al. (2007) Megeath, S. T. et al. 2007, in preparation
- Robitaille et al. (2006) Robitaille, T. P., Whitney, B. A., Indebetouw, R., Wood, K., Denzmore, P., 2006, ApJSS, 167, 256 [RWIWD06]
- Sridharan et al. (2002) Sridharan, T. K., Beuther, H., Schilke, P., Menten, K. M., Wyrowski, F. 2002, ApJ, 566, 931 (Sri02)
- Urquhart et al. (2006) Urquhart, J. S., Busfield, A. L., Hoare, M. G., Lumsden, S. L., Clarke, A. J., Moore, T. J. T., Mottram, J. C., Oudmaijer, R. D. 2007, A&A, 461, 11
- Zapata et al. (2006) Zapata, L. A., Rodríguez, L. F., Ho, P. T. P., Beuther, H., Zhang, Q. 2006, AJ, 131, 939
- Zhang et al. (2005) Zhang, Q., Hunter, T. R., Brand, J., Sridharan, T. K., Cesaroni, R., Molinari, S., Wang, J., Kramer, M. 2005, ApJ, 625, 864