Assessing the Predictive Power of Galaxy Formation Models: A Comparison of Predicted and Observed Rest-frame Optical Luminosity Functions at
Abstract
Recent galaxy formation models successfully reproduce the local luminosity function (LF) of galaxies by invoking mechanisms to suppress star formation in low- and high-mass galaxies. As these models are optimized to fit the LF at low redshift, a crucial question is how well they predict the LF at earlier times. Here we compare recently measured rest-frame -band LFs of galaxies at redshifts to predictions of semianalytic models by De Lucia & Blaizot and Bower et al. and hydrodynamic simulations by Davé et al.. The models succeed for some luminosity and redshift ranges and fail for others. A notable success is that the Bower et al. model provides a good match to the observed LF at . However, all models predict an increase with time of the rest-frame -band luminosity density, whereas the observations show a decrease. The models also have difficulty matching the observed rest-frame colors of galaxies. In all models the luminosity density of red galaxies increases sharply from to , whereas it is approximately constant in the observations. Conversely, in the models the luminosity density of blue galaxies is approximately constant, whereas it decreases in the observations. These discrepancies cannot be entirely remedied by changing the treatment of dust and suggest that current models do not yet provide a complete description of galaxy formation and evolution since .
Subject headings:
galaxies: evolution — galaxies: formation — galaxies: fundamental parameters —galaxies: high-redshift — galaxies: luminosity function, mass function
1. Introduction
In the current paradigm of structure formation, dark matter (DM) halos build up in a hierarchical fashion through the dissipationless mechanism of gravitationally instability. The assembly of the stellar content of galaxies is instead governed by much more complicated physical processes, often dissipative and non-linear, which are generally poorly understood. To counter this lack of understanding, prescriptions are employed in the galaxy formation models. One of the fundamental tools for constraining the physical processes encoded in these models is the luminosity function (LF), since its shape retains the imprint of galaxy formation and evolution processes.
The faint end of the LF can be matched with a combination of supernova feedback and the suppression of gas cooling in low-mass halos due to a background of photoionizing radiation (e.g., Benson et al. 2002). Matching the bright end of the LF has proven more challenging. Very recent implementation of active galactic nucleus (AGN) feedback in semianalytic models (SAMs) has yielded exceptionally faithful reproductions of the observed local rest-frame - and -band global LFs (Bower et al. 2006; Croton et al. 2006; see also Granato et al. 2004), including good matches to the local rest-frame -band LFs of red and blue galaxies (although with some discrepancies for faint red galaxies; Croton et al. 2006).
The excellent agreement between observations and models at is impressive but is partly due to the fact that the model parameters were adjusted to obtain the best match to the local universe. A key question is therefore how well these models predict the LF at earlier times. The SAMs of Croton et al. (2006), De Lucia & Blaizot (2007), and Bower et al. (2006) have been compared to observations at (see Bower et al., 2006; Kitzbichler & White, 2007). Although the agreement is generally good, Kitzbichler & White (2007) infer that the abundance of galaxies near the knee of the LF at high redshift is larger in the SAMs than in the observations (except possibly for the brightest objects), in an apparent reversal of previous studies (e.g., Cimatti et al. 2002).
Recently, the rest-frame optical LF has been accurately measured in the redshift range , using a combination of the -selected MUSYC, GOODS, and FIRES surveys (Marchesini et al., 2007). In this Letter we compare the observed LF to that predicted by theoretical models in this redshift range, in order to test the predictive power of the latest generation of galaxy formation models. We also compare the observed LF to predictions from smoothed particle hydrodynamics (SPH) simulations, which have so far only been compared to data at (Davé et al., 2006). We note that these comparisons are effectively the rest-frame equivalent of the test proposed by Kauffmann & Charlot (1998). We assume , , and km s-1 Mpc-1. All magnitudes are in the AB system, while colors are on the Vega system.
2. The observed luminosity functions
The observed rest-frame optical LFs at have been taken from Marchesini et al. (2007). Briefly, they presented the galaxy LFs in the rest-frame -band (at and ), -band (at ), and -band (at ), measured from a -selected sample constructed from the MUltiwavelength Survey by Yale-Chile (MUSYC; Quadri et al. 2007), the ultradeep Faint InfraRed Extragalactic Survey (FIRES; Franx et al. 2003), and the Great Observatories Origins Deep Survey (GOODS; Giavalisco et al. 2004; Chandra Deep Field–South). This -selected sample, comprising a total of 990 galaxies with at , is unique for its combination of surveyed area (380 arcmin2) and large range of luminosities.
In this Letter we limit our comparison between observed and predicted LFs to the rest-frame band, at the two redshift intervals (directly taken from Marchesini et al. 2007) and (derived in the same way as described in Marchesini et al. 2007). The results are qualitatively similar for other rest-frame bands.
3. The model-predicted luminosity functions
The Bower et al. (2006) SAM is implemented on the Millennium DM simulation described in Springel et al. (2005). The details of the assumed prescriptions and the specific parameter choices are described in Cole et al. (2000), Benson et al. (2003), and Bower et al. (2006). We have also used the outputs111Available at http://www.mpa-garching.mpg.de/Millennium (Lemson, 2006); see also footnote 6. from the SAM of Croton et al. (2006) as updated by De Lucia & Blaizot (2007). This model differs from the SAM of Bower et al. (2006) in many ways. The scheme for building the merger trees is different in detail, as are many of the prescriptions adopted to model the baryonic physics, most notably those associated with the growth of and the feedback from SMBHs in galaxy nuclei and the cooling model (see Kauffmann & Haehnelt 2000; Springel et al. 2001; De Lucia et al. 2004; De Lucia & Blaizot 2007 for details). Finally, we have compared the observed LFs with the predictions from the cosmological SPH simulations of Oppenheimer & Davé (2006), already used in Finlator et al. (2007) to constrain the physical properties of galaxies. The key ingredient of these simulations is the inclusion of superwind feedback, critical to avoid the overprediction by the simulations of the observed global star formation rate by reducing the reservoir of gas available for star formation (Springel & Hernquist, 2003). Specifically, we used the “momentum-driven wind” model used in Finlator et al. (2007, namely, their “jvzw” model; see also Oppenheimer & Davé 2006 for detailed descriptions). We have used the 32 h-1 Mpc box simulation, combined with a 64 h-1 Mpc box to better sample the bright end of the LF. We note that the key difference between the AGN feedback implementation in the SAMs and the superwind feedback is that the former does not require star formation.
Computing the SAM-predicted rest-frame -band LFs is straightforward, as the catalog is complete in the luminosity range of interest and has no redshift errors222To derive the model-predicted LF in a specific redshift interval, we averaged the number of galaxies as function of rest-frame V-band magnitude (with dust modeling included) of all redshift snapshots in the targeted redshift interval.. We also extracted rest-frame colors of the galaxies in order to determine the LF for red and blue galaxies separately.
4. Results
The comparison between the observed rest-frame -band LFs of all galaxies at and with those predicted by the theoretical models is shown in Figure 1. It is immediately obvious that the models do not yet provide a precise description of galaxy evolution. Differences between the various models, and discrepancies between model predictions and data, are still as large as a factor of for certain luminosity and redshift ranges.
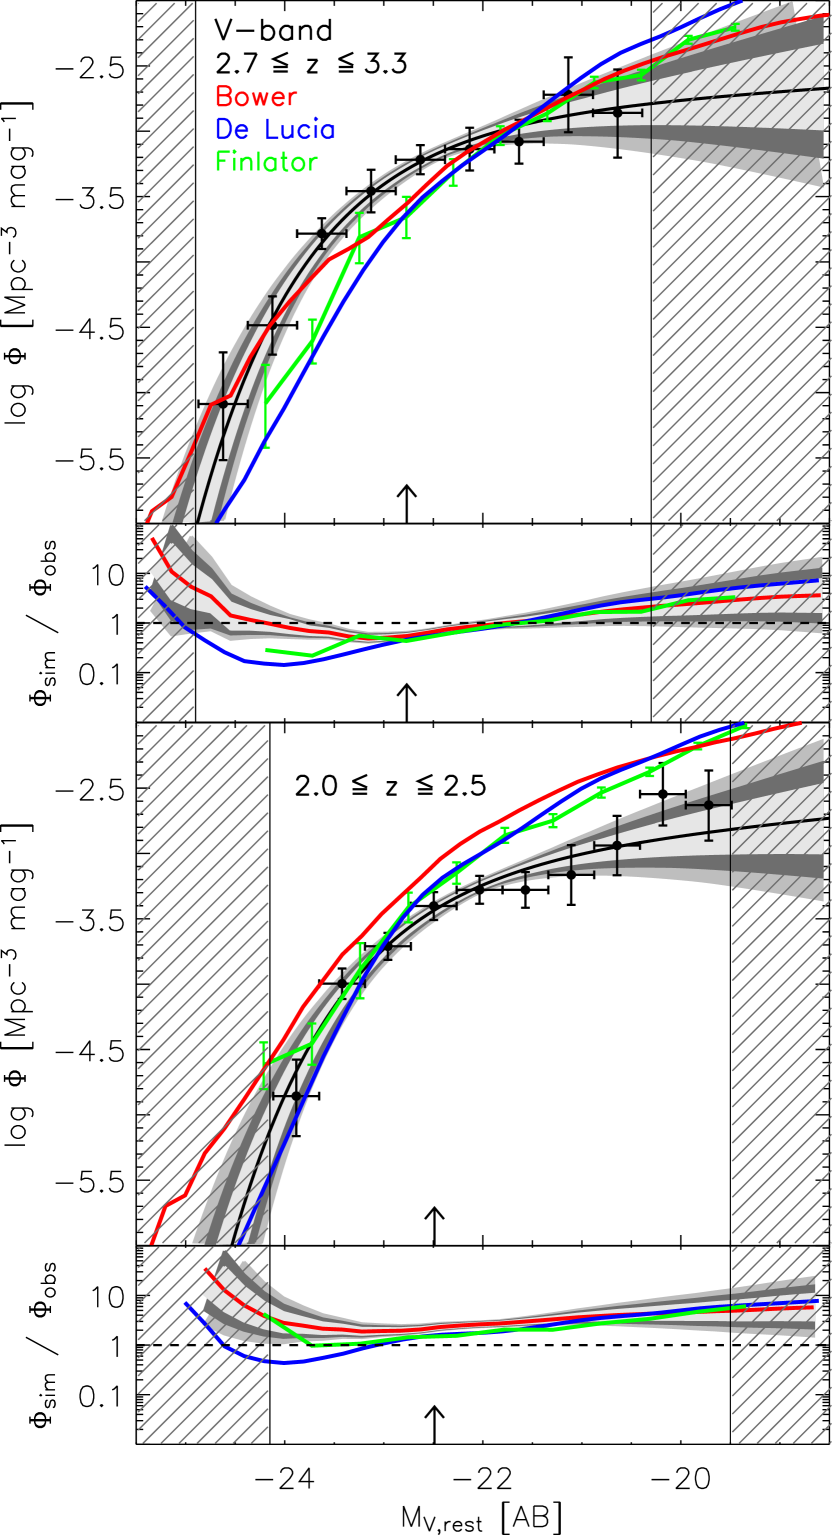
At , the global LF predicted by the SAM of Bower et al. (2006) agrees well with the observed LF, although the SAM slightly underpredicts the density of galaxies around the knee of the LF. However, while at the shape of the observed LF is broadly reproduced by the SAM, the predicted characteristic density is 2.5 times larger than the observed value. The SAM of De Lucia & Blaizot (2007) has difficulty with both the normalization and the slope of the LF, which is too steep. At , the De Lucia model matches the faint end but underpredicts (by a factor of 2–4) the bright end. At , instead, the predicted LF matches the bright end but overpredicts the faint end by a factor of . The SPH simulations of Finlator et al. (2007) predict LFs that are qualitatively similar to those predicted by the two SAMs, although the former are characterized by larger uncertainties, due to the much smaller simulated volume.
We quantified these results by determining the luminosity density (obtained by integrating the LF) for the observations and models. The luminosity density is a more robust measure than , , and the faint-end slope , because the errors in these parameters are highly correlated. The observed () has been estimated by integrating the best-fit Schechter function down to , which is the faintest luminosity probed by the -selected sample333As in Marchesini et al. (2007) the 3 error on was calculated by deriving the distribution of all the values of within the 3 solutions of the Schechter LF parameters from the maximum-likelihood analysis, including in quadrature a 10% contribution from photometric redshift uncertainties. Using a brighter integration limit of the LF () does not change the results of the comparison significantly.. To estimate from the SAM (), we have fitted the predicted LFs with a Schechter function, leaving , , and as free parameters, applying the same limits as to the data.
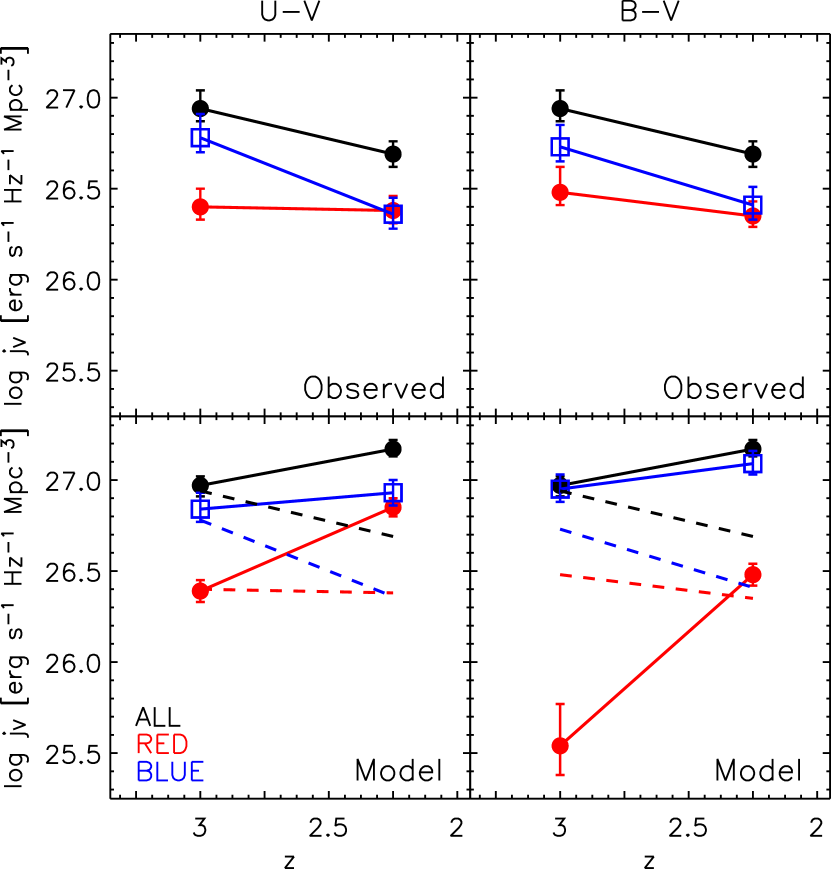
The comparison between and of Bower et al. (2006) is shown in Figure 2 (bottom panels) by the black lines and data points. The Bower SAM matches the observed luminosity density at . However, the model does not match the evolution of . In the model the luminosity increases with cosmic time, by a factor of from to . By contrast, the observed luminosity density decreases with time, by a factor of over the same redshift range. Results for the De Lucia SAM are similar, but for this model the difference between observed and predicted density is a strong function of the adopted faint-end integration limit.
5. Colors
We investigated the cause of the discrepancies by splitting the sample into blue and red galaxies, using their rest-frame colors. Here we focus on the Bower model, as it provides the best match to the shape of the global LF, and a wide range of rest-frame colors are available. Interestingly, the results depend strongly on the choice of color: splitting the sample by color (as done in Marchesini et al. 2007) produces very different results than splitting by color.
To define red galaxies, we first use the criterion 0.25, as done in Marchesini et al. (2007). As shown in the bottom left panel of Figure 2, the Bower model reproduces the densities of red and blue galaxies at extremely well. The model overpredicts the densities of red and blue galaxies at , although it predicts the correct ratio between the two (roughly 1:1).
Next, we use the criterion 0.5.444For observed galaxies in the Marchesini et al. (2007) sample, roughly corresponds to . As can be seen in the top panels of Figure 2, this criterion leads to very similar observed densities of red and blue galaxies as the criterion. However, the predicted densities are in severe disagreement with the observations, particularly at (see Fig. 2, bottom right panel). The red galaxy density at underpredicts the observed density by a factor of . Qualitatively similar results are obtained when from the SAM of De Lucia & Blaizot (2007) is used in the comparison.555The De Lucia model provides colors, but no colors.
Irrespective of the color criterion that is used, we find that the predicted evolution of the red and blue luminosity densities is in qualitative disagreement with the observed evolution. In the observations, the moderate evolution of the luminosity density is mainly driven by a decrease with cosmic time of the density of blue galaxies, with the red galaxies evolving much less (see also Brammer & van Dokkum 2007). By contrast, in the SAMs, the moderate evolution seen in the global LF is in the opposite sense and dominated by a strong evolution in the red galaxy population.
6. Discussion
The main results of our comparison between the observed and the model-predicted rest-frame -band LFs of galaxies at are (1) the SAM of Bower et al. (2006) reproduces well the observed LF at ; (2) the models predict an increase with time of the rest-frame -band luminosity density, whereas the observations show a decrease; (3) the models predict strong evolution in the red galaxy population, whereas in the observations most of the evolution is in the blue population; (4) the models greatly underpredict the abundance of galaxies with at .
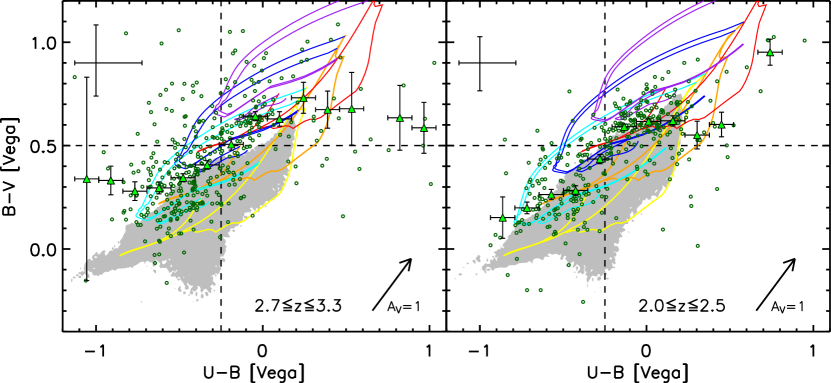
The different results obtained for and colors are interesting, as they may hint at possible ways to improve the models. We further investigate the disagreement between observed and predicted colors in the SAM of Bower et al. (2006) in Figure 3, which shows the comparison of observations and predictions in the versus diagram. While the SAM seems to broadly reproduce the observed distribution, it predicts galaxies that are systematically bluer in than the observed galaxies. We have plotted evolutionary tracks of stellar population synthesis models constructed with the Bruzual & Charlot (2003) code, assuming three different prescriptions for the star formation history (SFH): a constant SFH (CSF), an exponentially declining in time SFH characterized by the parameter Myr (300), and an instantaneous burst model (SSP). We selected the “Padova 1994” evolutionary tracks, solar metallicity, the Chabrier (2003) initial mass function with lower and upper mass cutoffs 0.1 M☉ and 100 M☉, and modeled the extinction by dust using the attenuation law of Calzetti et al. (2000). A new burst of star formation lasting 100 Myr and contributing 20% to the mass is also added at yr ( yr) at () to explore more complex SFHs.
As can be deduced from Fig. 3, the differences between observed and predicted colors could be due to larger amount of dust and/or to more complex SFHs in the observed galaxies. The ad hoc treatment of dust absorption is a significant and well-known source of uncertainty in the models. Modifications to the specific dust model could partly resolve the differences between observations and SAM predictions. By simply multiplying the in the SAM by a fixed factor, we were able to better reproduce the observed LFs at (although making the faint-end slope of the red galaxy LFs quantitatively too steep) and to have a better agreement between observed and predicted colors. However, at this simple remedy is not able to solve the disagreement between the predicted and the observed number of galaxies. We conclude that, while ad hoc modifications of the dust treatment might help to alleviate some of the found disagreements, it does not seem to be sufficient to accommodate the problem with global colors at .
While our ability to simulate galaxy formation has greatly improved in the past few years, our results imply that the present understanding of the physical processes at work in galaxy formation and evolution is still far from being satisfactory. On the observational side, more accurate redshift and color estimates would benefit studies of this kind. The lack of spectroscopic redshifts is particularly worrying, as systematic errors in redshift will lead to systematic errors in colors and luminosities (e.g., Kriek et al. 2006; M. Kriek et al. 2007, in preparation).
References
- Benson et al. (2003) Benson, A. J., Bower, R. G., Frenk, C. S., Lacey, C. G., Baugh, C. M., & Cole, S. 2003, ApJ, 599, 38
- Benson et al. (2002) Benson, A. J., Lacey, C. G., Baugh, C. M., Cole, S., Frenk, C. S. 2002, MNRAS, 333, 156
- Bower et al. (2006) Bower, R. G., Benson, A. J., Malbon, R., Helly, J. C., Frenk, C. S., Baugh, C. M., Cole, S., & Lacey, C. G. 2006, MNRAS, 370, 654
- Brammer & van Dokkum (2007) Brammer, G. B., & van Dokkum, P. 2007, ApJ, 654, L107
- Bruzual & Charlot (2003) Bruzual, G., & Charlot, S. 2003, MNRAS, 344, 1000
- Calzetti et al. (2000) Calzetti, D., Armus, L., Bohlin, R.C., Kinney, A. L., Koornneed, J., & Storchi-Bergmann, T. 2000, ApJ, 533, 682
- Chabrier (2003) Chabrier, G. 2003, PASP, 115, 763
- Cimatti et al. (2002) Cimatti, A., et al. 2002, A&A, 391, L1
- Cole et al. (2000) Cole, S., Lacey, C. G., Baugh, C. M., & Frenk, C. S. 2000, MNRAS, 319,168
- Croton et al. (2006) Croton, D. J., et al. 2006, MNRAS, 365, 11
- Davé et al. (2006) Davé, R., Finlator, K., & Oppenheimer, D. 2006, MNRAS, 370, 273
- De Lucia & Blaizot (2007) De Lucia, G., & Blaizot, J. 2007, MNRAS, 375, 2
- De Lucia et al. (2004) De Lucia, G., Kauffmann, G., & White, S. D. M. 2004, MNRAS, 349, 1101
- Finlator et al. (2007) Finlator, K., Davé, R., & Oppenheimer, B. D. 2007, MNRAS in press
- Franx et al. (2003) Franx, M., et al. 2003, ApJ, 587, L79
- Giavalisco et al. (2004) Giavalisco, M., et al. 2004, ApJ, 600, L93
- Granato et al. (2004) Granato, G.L., De Zotti, G., Silva, L., Bressan, A., & Danese, L. 2004, ApJ, 600, 580
- Kauffmann & Charlot (1998) Kauffmann, G., & Charlot, S. 1998, MNRAS, 297, L23
- Kauffmann & Haehnelt (2000) Kauffmann, G., & Haehnelt, M. 2000, MNRAS, 311, 576
- Kitzbichler & White (2007) Kitzbichler, M. G., & White, S. D. M. 2007, MNRAS, 376, 2
- Kriek et al. (2006) Kriek, M., et al. 2006, ApJ, 649, L71
- Lemson (2006) Lemson, G., et al. 2006, preprint (astro-ph/0608019)
- Marchesini et al. (2007) Marchesini, D. et al. 2007, ApJ, 656, 42
- Oppenheimer & Davé (2006) Oppenheimer, B. D., & Davé, R. 2006, MNRAS, 373, 1265
- Quadri et al. (2007) Quadri, R., et al. 2007, AJ, in press (astro-ph/0612612)
- Springel & Hernquist (2003) Springel, V., & Hernquist, L. 2003, MNRAS, 339, 312
- Springel et al. (2001) Springel, V., White, S. D. M., Tormen, G., & Kauffmann, G. 2001, MNRAS, 328, 726
- Springel et al. (2005) Springel, V., et al. 2005, Nature, 435, 629