Spontaneous Breakdown of Superhydrophobicity
Abstract
In some cases water droplets can completely wet micro-structured superhydrophobic surfaces. The dynamics of this rapid process is analyzed by ultra-high-speed imaging. Depending on the scales of the micro-structure, the wetting fronts propagate smoothly and circularly or – more interestingly – in a stepwise manner, leading to a growing square-shaped wetted area: entering a new row perpendicular to the direction of front propagation takes milliseconds, whereas once this has happened, the row itself fills in microseconds (“zipping”). Numerical simulations confirm this view and are in quantitative agreement with the experiments.
pacs:
83.50.Rp,68.03.Cd,05.20.Dd,02.70.NsMicro-structured materials can show a superhydrophobic behavior with effective contact angles of and beyond (“Lotus effect”). For many applications this effect is wanted: when a liquid droplet is deposited on micro-textured hydrophobic surfaces, it can bead off completely and wash off contaminations very efficiently Degennes03 ; Barth97 ; Bico99 ; Quere ; Marmur04 . Superhydrophobic materials are now used for a wide series of applications in medicine, coatings, self-cleaning, textiles, and microfluidics Lauga05 ; Squire05 ; Otten04 ; Erbil03 . However, under certain conditions, the superhydrophobicity (“Cassie-Baxter state” Cassie44 , hereafter CB) spontaneously breaks down Bonn00 ; He03 : fluid enters in between the micro-structures and spreads, resulting into a smaller contact angle (“Wenzel state” Wenzel36 , hereafter W). In many cases this transition from the CB to the W state is highly desirable . For example, water-repellent layers on leaves keep plants healthy, but also complicate spraying crops effectively with pesticides Klein00 . Other examples are heterogeneous porous catalysts, where superhydrophobicity is an unwanted effect as it reduces the contact area cat .
The objective of this Letter is to characterize and analyze the dynamics of the spontaneous breakdown of superhydrophobicity in terms of geometry, wetting, liquid-gas surface tension , and the liquid viscosity .
The fabrication of highly precise and controllable micro-structured surfaces becomes possible through a micro-molding technique Jong06 . As material, we choose a solution of styrene-butadiene-styrene (a block-copolymer commercially available as “kraton”) dissolved in toluene. Kraton is used because thin layers are easily removable from the mold. The thickness of the resulting translucent film is only 40 , allowing for optical imaging of the CB to W transition through the bottom of the film.
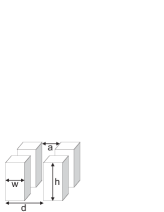
For the experiments presented here we choose a regular, periodic structure of square pillars with height , width (both kept fixed for all our experiments), and as control parameter a gap width between and . The wavelength of the regular square lattice is thus between and (see figure 2).
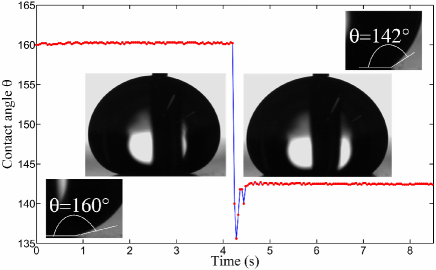
Water droplets are deposited on the surface with a syringe pump at a very low flow rate (l/min) from an outlet of a vertical thin tube (outer diameter 0.158 ). The outlet is set parallel to the flat film, 2 above it. A typical droplet grows slowly and reaches the dry surface within a minute. Then the flow is stopped and a (meta-)stable drop in the CB state (contact area 1 ) is observed. For the chosen micro-textured surfaces the (effective) contact angle in the CB state is , while for a smooth surface made of the same material it is .
At some point the CB state can spontaneously break down (figure 1 ).
(a)
 (b)
(b)
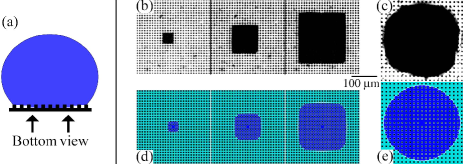
The extremely rapid filling process towards the W state is recorded from the bottom of the film (see figure 3a for a sketch) with a microscope and a high-speed imaging system (Photron Ultima APX-RS), using frame rates in the range between 4000-50000 fps. In figure 3 the large scale time evolution of the filling process is shown. After fluid sinks down at a certain point, a lateral spreading develops which sensitively depends on the parameters characterizing the micro-textured surface: while for large gap width a round shape of the fully wetted area is emerging (figure 3c), at smaller the propagating fronts reflect the structure of the underlying square lattice, leading to a square-shaped wetted area (figure 3b). At even smaller we never observed any transition to the W state.
For the wetting cases, the velocity of front propagation drastically depends on the gap width (see figure 4): For we measure a mean velocity mm/s, two orders of magnitude faster than the case with , where 7 . Moreover, in the latter case the front propagates in a stepwise manner (figure 4a) and fronts at different positions on the sample or in different directions show a remarkable variation in their velocity (“dispersion”).
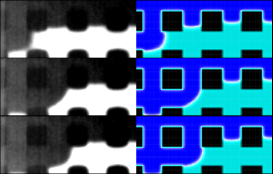
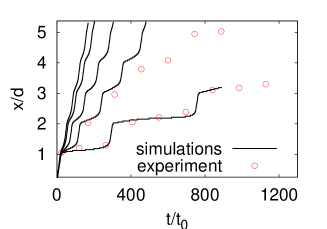
For the more striking case of the square-shaped wetted area () we show details of the wetting dynamics in figure 5a. The front is here advancing from top to bottom and is slowing down while wetting occurs in a zipping manner: the timescale of the front for entering a new row is slow as already shown above (figure 4a), namely typically , the timescale for the filling of the once entered row itself is about two orders of magnitude faster, .
(a)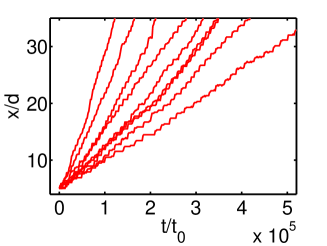 (b)
(b)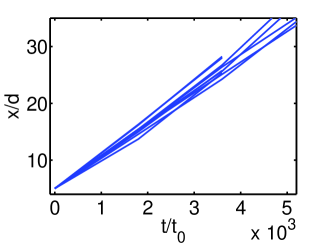
In order to better reveal the physics of the wetting mechanism, we performed numerical simulations with a three-dimensional Lattice Boltzmann algorithm BSV92 for single component multiphase fluids. Wetting properties with surface tension are introduced as explained in LBM06a , leading to wetting angles comparable with those in the experiments. Geometrical structures are reproduced with the same aspect ratio as in the experiment. Similarly, in the large gap width case (nearly) spherical wetted areas are observed (figure 3e), whereas in the case we observe square-shaped wetted areas, see figure 3d. Also the zipping wetting behavior is reproduced in these simulations for (see figure 5b). When repeating the simulations with a gap width , we do not observe any lateral infiltration of the substrate and the CB state remains stable, again, just as experimentally observed.
(a)
 (b)
(b)
(c)
How to explain the transition from CB to W ? The energy of a droplet in equilibrium on a substrate is monotonically increasing with the effective contact angle He03 . As a result, when the CB effective contact angle is higher than the W one, we would argue that the CB droplet always collapses towards the W state. Anyhow, intermediate states with higher energy can be encountered He03 : they represent energy barriers to overcome and work has to be done in order to induce the transition He03 ; Bico99 . The bottom-view observations reveal that the micro-structured surface is not wetted all at once, but the infiltration starts locally. In our case, this happens spontaneously after a few seconds whereas in other cases (i.e. larger ) the infiltration can take longer and one may want to trigger it. Once the transition has started, how to theoretically understand the shape of the wetted area, the zipping, and the different involved timescales ? For the dynamics of liquid moving in between the posts, both the free surface and wall interactions play a role. A small advancing displacement of the interface within the posts would take place in favour of a gain in surface energy due to the reduction of liquid-gas interface () on the top of the pillars. This is a pulling mechanism for the transition that must be balanced with the energy loss to wet a small portion of hydrophobic wall (, ). The overall energy gain is
| (1) |
The limit characterizes a critical contact angle for the wetting properties above which the liquid can spread horizontally through the posts. For square posts and square geometry it is equal to
| (2) |
Note that in this equation there is no reference to the width of the posts because we describe the horizontal filling, different from a simultaneous vertical collapse Degennes03 ; He03 . With this critical value, the energy gain (1) can be rewritten as
| (3) |
where for no favorable propagation is expected while in the other case, when , the propagation is energetically favored. For the two analyzed cases and we obtain and , respectively. As for water on flat kraton, we thus understand that for gap widths smaller than the propagation to the W state is energetically not possible.
We can also understand the critical slowing down of the front close to the critical angle (figure 4). Therefore we have to identify the relevant time scale for the system and quantify its fluctuations with respect to the geometry. To do so, we estimate the energy cost in terms of dissipation and compare it with the change in surface energy of equation (3). With the small dimensions under consideration, flows can be regarded as laminar and viscous dissipation is dominating as compared to flow inertia. A simple estimate for the rate of viscous dissipation per unit volume in a fluid with viscosity is Landau59 , with the characteristic shear rate. If we integrate it over the small volume and time lag , we obtain the viscous contribution for the energy as . Balancing in equation (3) with , we deduce the time scale
| (4) |
with for typical values of , , and . Equation (4) reveals the origin of the critical slowing down of the front propagation, its dispersion and the appearance of zipping: if , the timescale of front propagation diverges as . Around this critical point, a small uncontrollable variation (imperfections of the microstructure, dust deposit) in the local wetting angle translates into a huge dispersion in the time scales, which is consistent with the experimental observation shown in figure 4a. A flat front is slowly allowed to proceed further, and entering a new row perpendicular to the direction of the front can take up to milliseconds, whereas once this has happened, the row itself is filled on a faster time scale (zipping). In this way a square-shaped propagating wetting pattern emerges (see the case with in figure 3b where and ).
On the contrary, when approaching the other limit (as in figure 3c, where and , implying ) the dynamics becomes more and more determined by the time scale itself (see figure 4b) and the propagation through the posts is expected to be smooth. In this limit it is the pure pulling mechanism of surface tension in equation (3) that dominates the spreading dynamics and is prevalent over wall effects Ferimigier03 . For this reason, the geometrical properties of the lattice do not emerge and the front assumes an almost circular shape.
In conclusion, we have experimentally, numerically, and theoretically revealed the origin of zipping wetting behavior at the spontaneous breakdown of superhydrophobicity. We observed that the wetting process starts locally from a single point and then proceeds laterally, depending on a critical contact angle.
Close to this critical point the driving energy for the lateral filling reduces, the front propagation slows down through viscous effects and zipping wetting is observed. As a consequence, the front propagates in a stepwise manner and square-shaped Wulff wetted areas emerge. Although we have observed the origin of this zipping process, its dynamical details have not been characterized here and will be the object of a forthcoming paper Pirat07 .
The critical contact angle (equation (2)) can be calculated from the geometrical properties of the micro-textured material and is consistent with our experimental and numerical findings.
Our results are useful for the design and fabrication of micro-structured surfaces with certain wetting properties: for given hydrophobic material and liquid, the post height and the gap width can simply be calculated to obtain some desired critical contact angle.
The next step will be to control the time scale of the local initiation point, characterize the dynamics of the zipping process and extend our analysis to more complicated micro-patterned structures, including three-dimensional ones .
We gratefully acknowledge discussions with B. Andreotti, L. Courbin, L. Lefferts, F. Mugele, and A. Prosperetti. M.S. and B.M.B. thank STW (Nanoned Programme) and A.M.P. thanks Microned for financial support.
References
- (1) P.-G. de Gennes, F. Brochard-Wyart, and D. Quéré. Capillarity and Wetting Phenomena: Drops, Bubbles, Pearls, Waves (Springer, 2003).
- (2) C. Neinhuis and W. Barthlott, Ann. Bot. 79, 667-677 (1997).
- (3) J. Bico, C. Marzolin, and D. Quéré, Europhys. Lett. 47, 220-226 (1999).
- (4) D. Quéré, Nat. Mat. 1, 14-15(2002); A.Lafuma and D. Quéré, Nat. Mat. 2, 457-460 (2003).
- (5) A. Marmur, Langmuir 20, 3517-3519 (2003).
- (6) E. Lauga, M. P. Brenner, and H. A. Stone, Microfluidics: The no-slip boundary condition in Handbook of Experimental Fluid Dynamics, Springer, New-York (2007).
- (7) T. M. Squires and S. R. Quake, Rev. Mod. Phys. 77, 977-1026 (2005).
- (8) A. Otten and S. Herminghaus, Langmuir 20, 2405-2408 (2004)
- (9) H. Y. Erbil, A. L. Devirel, Y. Avci, and O. Mert, Science 299, 1377-1380 (2003).
- (10) A. B. D. Cassie and S. Baxter, Nature 155, 21-22 (1945); A. B. D. Cassie and S. Baxter, S. Trans. Faraday Soc. 40, 546-551 (1944).
- (11) V. Bergeron, D. Bonn, J. Y. Martin, and L. Vovella, Nature 405, 772-775 (2000).
- (12) B. He, N. A. Patankar and J. Lee, Langmuir 19, 4999-5003 (2003). N. A. Patankar, Langmuir 19, 1249-1253 (2003).
- (13) R. N. Wenzel, Ind. Eng. Chem. 28, 988-994 (1936).
- (14) J. Klein, Nature 405, 745-747 (2000).
- (15) L. Feng et al., Adv. Mater. 14, 1857-1860 (2002).
- (16) L. Vogelaar, R.G.H. Lammertink, and M. Wessling, Langmuir 22, 3125-3130 (2006).
- (17) R. Benzi, S. Succi and M. Vergassola, Phys. Rep. 222, 145-197 (1992).
- (18) R. Benzi, L. Biferale, M. Sbragaglia, S. Succi, and F. Toschi, Phys. Rev. E 74, 021509 (2006); M. Sbragaglia, R. Benzi, L. Biferale, S. Succi, and F. Toschi, Phys. Rev. Lett. 97, 204503 (2006).
- (19) L. D. Landau and E. M. Lifschitz, Fluid Mechanics (Pergamon, London, 1959)
- (20) T. Cubaud and M. Fermigier,Europhys. Lett. 55, 239-245 (2001).
- (21) Wulff G., Z. Kristallogr 34, 449-530 (1901).
- (22) Pirat C., Sbragaglia M., Peters A., Borkent B., Lammertink R., Wessling M. and Lohse D., in preparation (2007).