Detailed Spectral Analysis of the Type Ib Supernova 1999dn. Paper I: Hydrogen-free Models
Abstract
We present spectral fits to five epochs of the typical Type Ib supernova 1999dn using the generalized, non-LTE, stellar atmospheres code PHOENIX. Our goal is threefold: to determine basic physical properties of the supernova ejecta, such as velocity, temperature, and density gradients; to reproduce He I absorption lines by invoking non-thermal excitation; and, to investigate possible spectral signatures of hydrogen, especially a feature around 6200 Å, which has been attributed to high velocity H. Our models assume an atmosphere with uniform composition devoid of any hydrogen. Our model spectra fit the observed spectra well, successfully reproducing most of the features, including the prominent He I absorptions. The most plausible alternative to H as the source of the 6200 Å feature is a blend of Fe II and Si II lines, which can be made stronger to fit the observed feature better by increasing the metallicity of the ejecta. High-metallicity models fit well at early epochs, but not as well as solar-metallicity models after maximum light. While this blend of metal lines is a reasonable explanation of the source of the 6200 Å feature, it is still important to investigate hydrogen as the source; therefore, a second paper will present models that include a thin shell of hydrogen around the main composition structure.
1 Introduction
Supernovae (SNe) are divided into two different types, I and II, based on the presence of hydrogen in their optical spectra. Type II supernovae spectra have conspicuous hydrogen lines while Type I supernovae spectra do not. SNe I can further be divided into three more spectral types: Ia, Ib, and Ic. SNe Ia characteristically contain strong absorption lines caused by singly-ionized silicon; SNe Ib contain strong neutral helium absorption lines; and, SNe Ic lack both of these characteristics (Filippenko, 1997).
Because of their almost exclusive location in the star-forming regions of spiral galaxies, and because of their spectral properties, it is believed that Type II, Ib, and Ic supernovae all result from the core-collapse of massive stars. Furthermore, studies have shown that SNe Ib/c are likely to result from binary star systems (Heger et al., 2003).
Until recently, the very small number of SNe Ib spectra available near the period of maximum luminosity limited the study of these events in detail. However, a great number of Ib spectra have become available thanks to the published spectra of Matheson et al. (2001) and others. Recent work with these spectra has shown that there may be traces of hydrogen in SNe Ib spectra, and of both hydrogen and helium in SNe Ic (Branch et al., 2002, 2006; Elmhamdi et al., 2006; Parrent et al., 2007). This work used SYNOW—a highly-parameterized, supernova spectrum-synthesis code that assumes a sharp photosphere that emits a blackbody continuous spectrum and line formation by resonance scattering, treated in the Sobolev approximation—to calculate spectral models. Other work on modeling the spectra of SNe Ib has also used SYNOW (Deng et al., 2000; Benetti et al., 2002; Anupama et al., 2005).
The speed and relative simplicity of SYNOW makes it very useful for identifying spectral lines, line velocities, and other constraints on the ejected mater (Branch et al., 2002). However, these model spectra do not naturally account for non-thermal excitation, which is required to see He I absorption lines; the optical depth of He I absorptions is an adjustable modeling parameter. For this purpose, as well as to gain more information about the physical properties of SNe Ib, we conduct a more detailed spectral analysis using the generalized, non-LTE, stellar atmospheres code PHOENIX (Hauschildt & Baron, 1999) to complement this work. We choose to study SN Ib 1999dn: a typical, well-covered Ib supernova (Deng et al., 2000; Matheson et al., 2001). SN 1999dn has also been modeled using SYNOW by Deng et al. (2000) and Branch et al. (2002). It is believed by both sets of authors that an absorption feature around 6200 Å is most likely Hat early times, though they leave open as possibilities Ne I, Si II, and C II. Deng et al. (2000) argue that the feature later evolves into C II in the post-maximum light spectra; Branch et al. (2002) suggest that the feature may be attributed to lines of Fe II.
We hope to accomplish the following in a two-paper study: (1) determine basic properties of the supernova such as effective temperature and velocity of the photosphere, (2) determine if He I absorption lines can be properly formed by including non-thermal excitation, and (3) study the issue of the existence of spectral signatures of hydrogen, particularly determine the most plausible source of the 6200 Å feature. Here we present synthetic spectra of SN 1999dn assuming that no hydrogen is present; we use a homogeneous helium core as a basic model atmosphere. §2 contains an overview of the supernova and the observed spectra, PHOENIX code calculations, and the basic parameters adjusted to better our fits. §3 features our best fits for five of the observed spectra with a brief analysis of each fit. Also, we investigate some of the alternatives to H for the 6200 Å feature. In §4 we offer a discussion of our results and a look forward to Paper II where we will add hydrogen to the models.
2 Methods
SN 1999dn was discovered on August 20 by Qiu et al. (1999) in NGC 7714, which has a recession velocity of 2700 and an (Schlegel et al., 1998). In total, six spectra of SN 1999dn have been published, ranging from ten days before until 38 days after maximum brightness in the R-band, which occurred on August 31 (Matheson et al., 2001). The five spectra we model are shown in Figure 1. While there was some early confusion about its classification, being identified early as a Ia or Ic, SN 1999dn contains conspicuous He I absorption lines, and so is classified as a Type Ib (Matheson et al., 2001). Branch et al. (2002) consider SN 1999dn a typical SN Ib, and so a study of its spectra should provide insight into SNe Ib as a whole.
We present spectral fits of the first five epochs of SN 1999dn obtained from the multi-purpose stellar atmospheres program PHOENIX (Hauschildt & Baron, 1999; Baron & Hauschildt, 1998; Hauschildt et al., 1997a, b, 1996). PHOENIX solves the radiative transfer equation along characteristic rays in spherical symmetry, taking into account relativistic effects. The non-LTE (NLTE) rate equations for selected ionization states are solved, thereby including effects of non-thermal electrons from the -rays produced by the radioactive decay of Ni-56, which are essential to making He I and any Ne I absorptions.
Table 1 lists the 27 ions that are treated in NLTE in our models. Each model atom includes primary NLTE transitions, used to calculate the level populations and opacity, and weaker LTE transitions, which are included in the opacity, but also which affect the rate equations because of their effect on the solution to the transport equation (Hauschildt & Baron, 1999). All LTE line opacities not treated in NLTE are treated with an equivalent two-level atom source function, using a thermalization parameter, = 0.05. The atmospheres are iterated to energy balance in the co-moving frame; while we neglect explicit effects of time dependence on the transport equation, we implicitly include them by including the -ray deposition rate in the radiative equilibrium equation and in the rate equations for the NLTE populations.
All of the models shown have a uniform composition structure with -ray deposition that follows the density of the ejecta to provide for the non-thermal excitation necessary to produce the observed He I absorption lines (and any Ne I absorption as well). The “standard composition” models have solar metallicities, except we assume all hydrogen has been burned to helium; the “high-metallicity” models have three times solar metallicity. The models are parameterized by a few quantities: the time since explosion (with an assumed 12-day rise time, ), the effective temperature (), the photospheric velocity (the velocity, , where the continuum optical depth in extinction at 5000 Å , , is unity), the metallicity (given as a factor times solar), and the density profile’s power law index , which follows the relation .
3 Spectral Fits
We produced spectra from the calculations of over 100 models, and compared them to the observed spectra. Table 2 contains the adjustable parameters for the best fits for all five epochs we modeled. The goodness of the fit is determined in a “-by-eye” fashion; the human eye is very adept at pattern recognition. In general, we fit the basic shape of the continuum by varying , fit the Doppler shift of the spectra by varying (we most often fit the 5876 Å He I absorption), and fit the widths of the observed absorption lines by varying and .
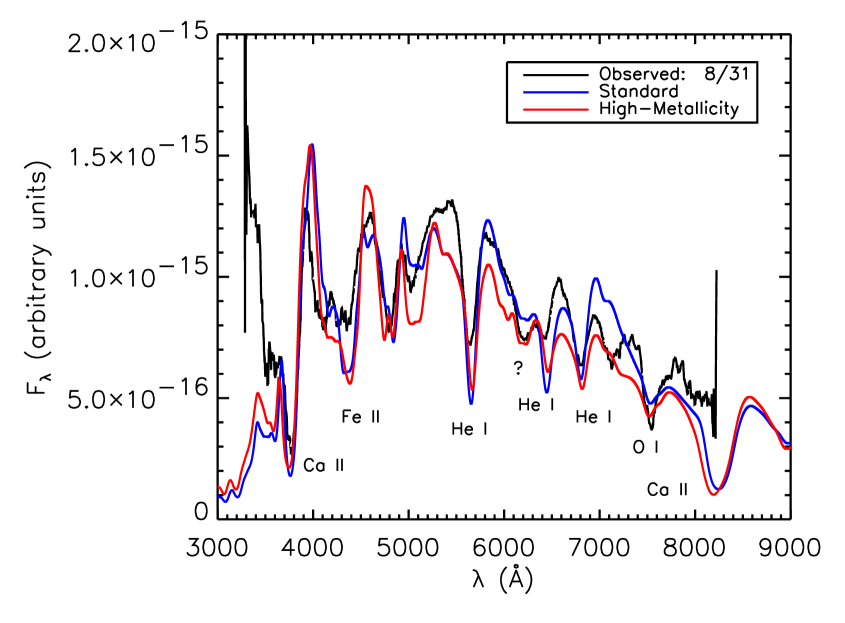
Figure 2 shows the day of maximum light (epoch +0, obtained August 31) observed spectrum and two model spectra (with parameters given in Table 2). For this particular epoch we calculated 44 different models varying the basic fitting parameters mentioned in the paragraph above, but mostly varying the abundances of elements included in the calculations. Identifications for the major features are shown in the figure, corresponding to (reading the labels from left to right): Ca II H and K, a multitude of Fe II lines (with a small contribution from Mg II, most likely 4481 Å; overall it is difficult to uniquely identify any one of the features due to the large amount of blending in the spectra), He I 5876 Å, the unknown 6200 Å feature, He I 6678 Å, He I 7065 Å, O I 7772 Å, and the Ca II infrared triplet. While not shown, the He I 10830 Å absorption feature is very strong in the model spectra.
Overall, both models, the standard composition and high-metallicity, fit the observed spectrum well. The Ca II H and K absorptions match the observed spectrum very well, while the emission is slightly overshot. The (mostly) Fe II absorption region is on the whole fit well by both models, though perhaps slightly better by the standard composition model as it has more subdued absorptions and emissions. Neither model reproduces an absorption feature near 5100 Å in the observed spectrum, presumably due to Fe II, very well. Both models have an absorption too deep for the He I 5876 Å feature, though the standard composition has a well matched emission. Both models show a feature that fits the 6200 Å feature, with the higher-metallicity model getting the strength nearly perfect. Both models then produce too strong an absorption for He I 6678 Å and He I 7065 Å, and have trouble reproducing the O I 7772 Å feature well. Unfortunately the range of the observed spectrum does not extend far enough to include the Ca II infrared triplet.
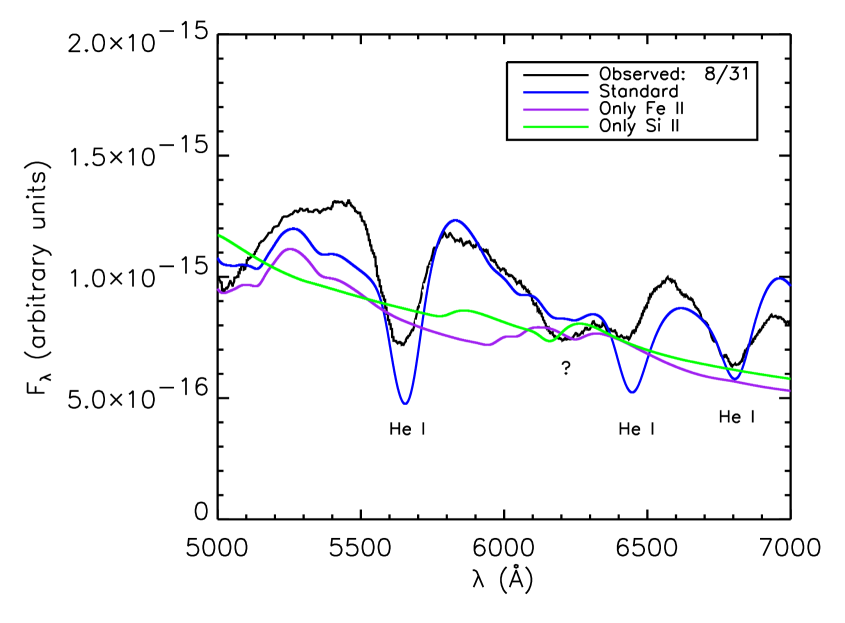
As we can see in Figure 2, the simple non-thermal excitation provided in the models was enough to reproduce the neutral helium absorptions fairly well. Of particular interest in this fit, however, is the good fit for the 6200 Å feature, especially in the high-metallicity model. We can see the source of this feature in the model spectra in Figure 3, which contains the observed spectrum and standard composition model along with single-ion spectra of Fe II and Si II produced from the standard composition model. The single-ion spectra show the spectral features due only to Fe II or Si II in the standard composition model spectrum. The 6200 Å feature in the model spectra is the result of blending of Si II 6355 Å, which is formed a little far to the blue, and an Fe II feature that is formed a little far to the red. Together, they make the feature seen in the standard composition model spectrum; their strength is amplified by the increased abundance of both ions in the high-metallicity model.
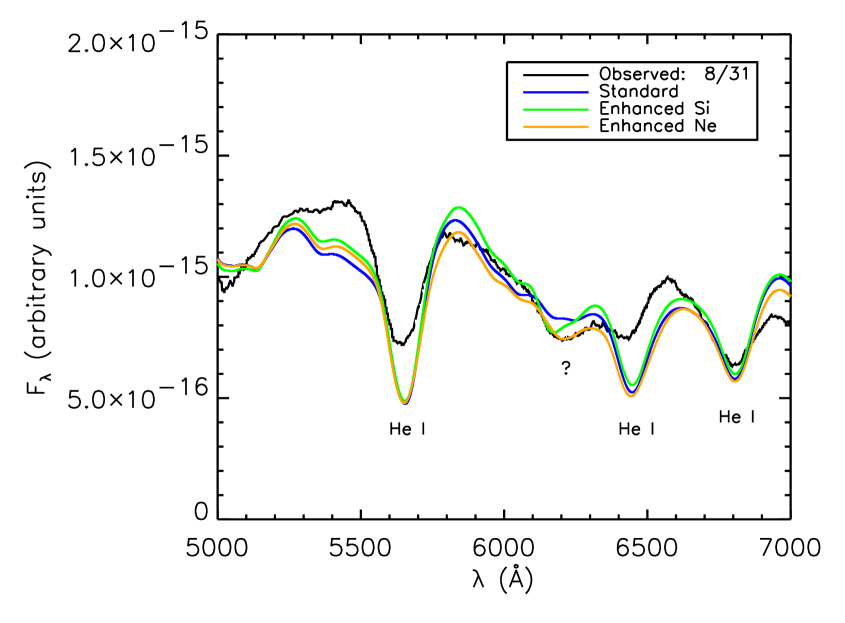
Figure 4 shows the observed spectrum from the +0 epoch with the standard composition models and two other revised models: one with 10 times as much silicon abundance and one with 100 times as much neon abundance. We can see that the former revised model produces a feature on the blue edge of the observed 6200 Å feature, but it does not extend far enough to the red to be a real candidate for the source of the absorption. However, the latter revised model, with 100 times as much neon as the standard composition, reproduces the 6200 Å feature very well. The Ne I (6402 Å) absorption line, produced like neutral helium lines by non-thermal excitation, fits the feature remarkably well, without introducing any unwanted features in other regions of the spectrum. Yet, such a large neon abundance does not seem reasonable. This could be an indication that the density profile for non-thermal excitation is not as simple as we have modeled it, or it may be coincidence. While a model with enhanced carbon is not shown, C II makes no obvious effects in the standard composition model at this epoch, and so we disregard it as the source of the 6200 Å feature as well. The most plausible identification from our models remains that of Si II and Fe II blended together.
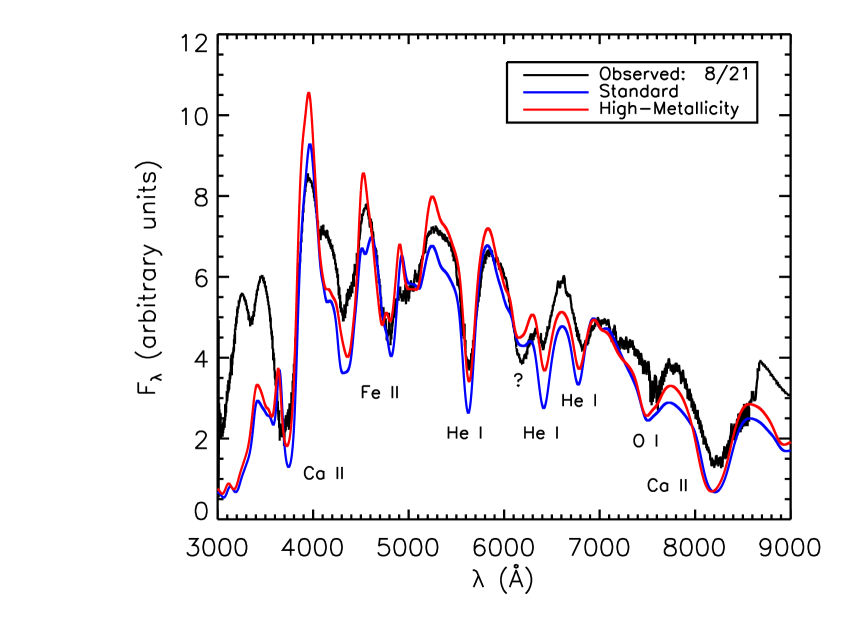
Figure 5 shows the observed spectrum obtained ten days before maximum light (epoch -10, obtained on August 21) with two spectral fits: a standard composition model and a high-metallicity model. The observed spectrum contains similar features to those in the maximum light spectrum. The two models fit most of these features fairly well. The Ca II H and K absorptions are slightly too strong in the models; likewise in the emissions. Both models fit the observed spectrum fairly well over the region dominated by Fe II lines, between 4100 Å and 5200 Å. The He I 5876 Å absorption is fit particularly well by the high-metallicity model, while the emission is better modeled with the standard composition. Both models produce a feature near 6200 Å. That feature is stronger and better fit to the observed spectrum in the high-metallicity model; however, it is hardly a poor fit of the feature using the standard composition. The He I 6678 Å feature is particularly weak in the observed spectrum, a subtlety the models fail to replicate. Both models also appear to form the He I 7065 Å feature a little too far to the blue, which may be a result of the simple -ray deposition that produces the non-thermal excitation responsible for the formation of the neutral helium lines in the models. Likewise, the O I absorption and the Ca II infrared triplet are formed a little blue in the model spectra, though the features are otherwise fit reasonably well.
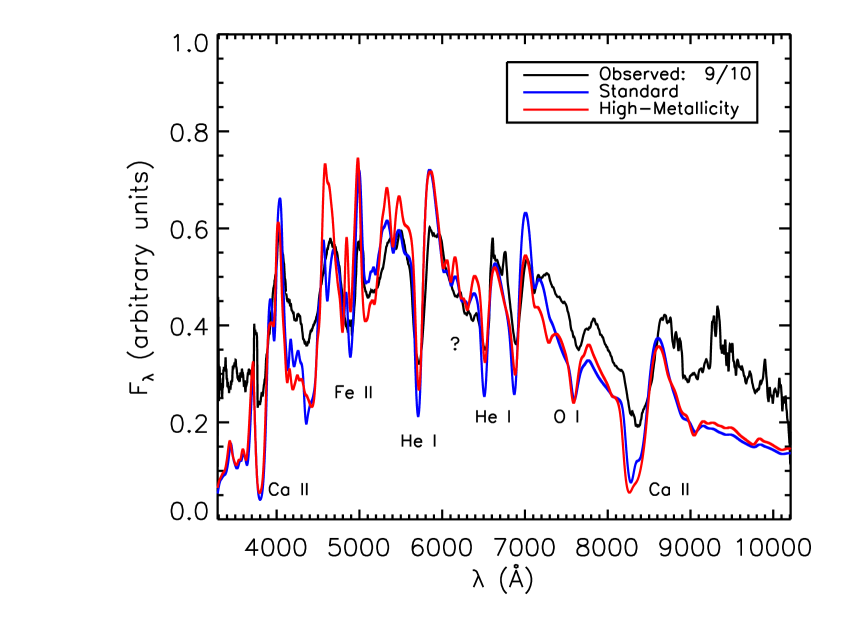
Moving to post-maximum light spectra, Figure 6 shows the observed spectrum obtained ten days after maximum light (epoch +10, obtained September 10) with two spectral fits: again, a standard composition model and a high-metallicity model. The observed spectral features are largely the same as those seen in the two previous epochs. Both fits are of good quality, though the standard composition model fits the observed spectrum better overall, particularly at shorter wavelengths. Both models have too strong an absorption for Ca II H and K, but their emissions fit well. In the Fe II dominated region (which is now becoming blanketed by Ti II lines as well, see Figure 10) the high-metallicity model fails to fit as well as the standard composition, which in turn struggles to fit some of the observed features at the correct strengths. (However, as opposed to the +0 day spectrum, the feature at 5100 Å fits much better.) The standard composition model fits the He I 5876 Å feature more closely, especially on the blue edge, but the high-metallicity model fits the other two He I absorptions marginally better. The 6200 Å feature at this later epoch is not nearly as pronounced and has evolved considerably from the feature at earlier times; the feature actually appears to be two distinct features centered around 6200 Å. This is not unlike the proposed explanation for the feature at earlier epochs, except now the two features are resolvable. In the region around 6200 Å, the standard composition model reproduces features that are more than strong enough to fit the observed. Again, the He I 7065 Å, O I, and Ca II infrared triplet absorptions are produced a little to the blue in the model spectra
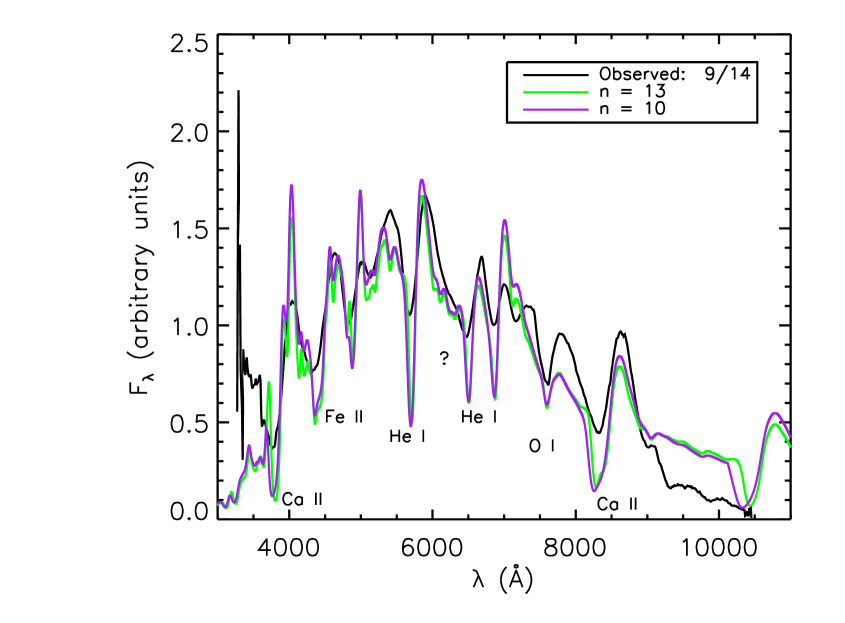
In Figure 7 the observed spectrum obtained 14 days after maximum light (epoch +14, obtained September 14) is shown with two spectral fits. Both models have standard composition, but they vary between and . Both models fit the observed spectra fairly well. One main difference between the two are the line strengths, particularly in the Fe II dominated region. The model fits the strength of the absorptions better at 5300 Å and 4200 Å. The shapes of some of the absorption lines, like He I 5876 Å are also fit slightly better in the model. Similar observations can be made about later epochs as well. Therefore, for this and later epochs the models will have , rather than .
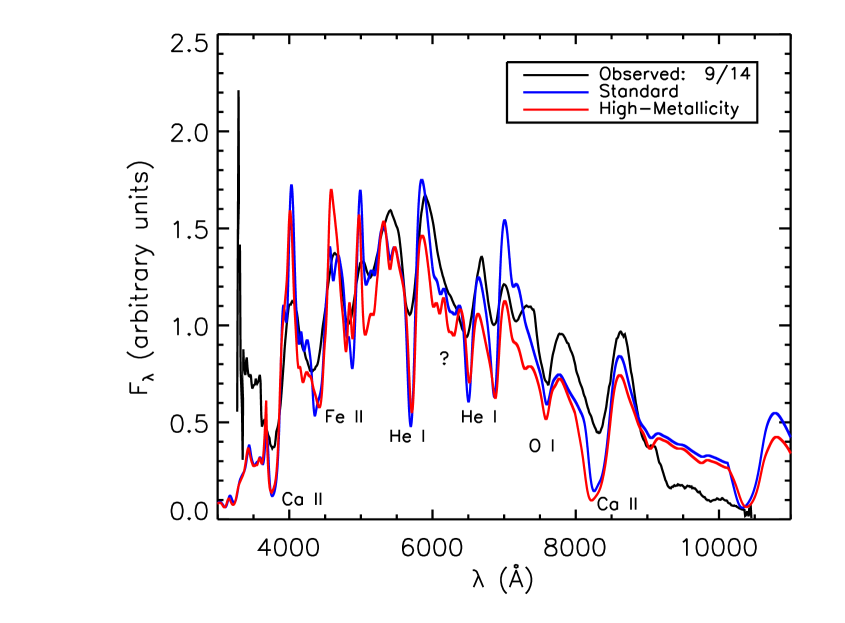
The September 14 observed spectrum is shown alongside two best fits with varying metallicity in Figure 8: one with the standard composition and one with increased metallicity. While both are good fits overall, the standard composition model fits the observed absorption depths better in the blue end of the spectrum, and marginally worse in the redder end. Both models have absorptions and emissions of the Ca II H and K lines that are stronger than observed. As mentioned above, the standard composition model fits the absorption strengths in the Fe II/Ti II dominated region better than the high-metallicity model. Both models have strong absorption of He I that fail to match the observed features perfectly. In the observed spectrum barely anything remains of the 6200 Å feature; the models produce features similar to those seen in the +10 day spectrum. The standard composition model fits the region much better because of the decreased feature strength. The models produce features that are at the same wavelength of the observed spectrum for the He I 7065 Å and O I lines; the Ca II infrared triplet absorption is only slightly too blue, though a touch too strong, in the models compared to the observed spectrum.
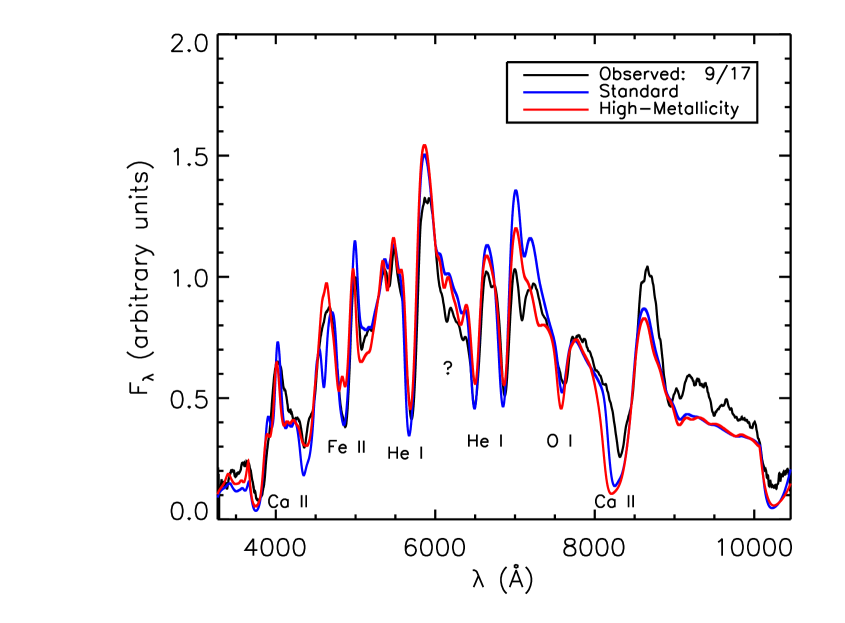
Figure 9 shows the observed spectrum of SN 1999dn obtained 17 days after maximum light (epoch +17, obtained on September 17) with two spectral fits: a standard composition model spectrum and a high-metallicity model spectrum. Both models fit the spectrum well. The absorption and emission of the Ca II H and K lines are fit reasonably well in both models. Neither model fits the Fe II region perfectly, but both reproduce the features seen with varying degrees of accuracy: the standard composition model fits the 4900 Å absorption perfectly, while the high-metallicity model reproduces the features at 4400 Å and 5900 Å slightly better. The standard composition model’s He I 5876 Å absorption is slightly strong and blue, but the other He I absorption features are fit well. Note that the features around 6200 Å are in the observed spectrum again, looking much like they did in the +10 day spectrum. The shape of these features are reproduced better in the standard composition model, though the absorption strengths are reproduced better in the high-metallicity model. The features in the model spectra that appear in the same region can be attributed to a blending of Fe II, Si II, and C II. The O I feature is fit well by both models (though slightly better by the standard composition), and both models produce a too strong and too blue Ca II infrared triplet feature.
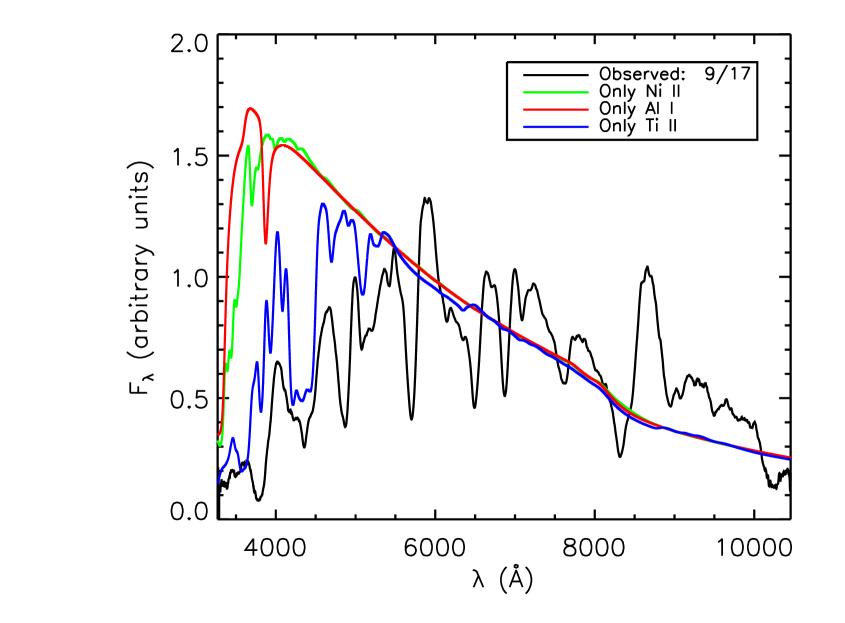
As the temperature in the supernova has decreased substantially since maximum light (our model temperatures decrease from 6000 K to 5000 K), we expect to see some new contributions to spectral features at later times. Figure 10 shows the observed spectrum for the +17 day epoch along with three single-ion spectra of lines that have only been considered in LTE: Ni II, Al I, and Ti II. Ni II and Al I both have some effect on the model spectra close to the Ca II H and K absorption (near 3750 Å). Ti II, however, has significant contributions to the spectrum all the way up to a wavelength of 5500 Å, in what we previously called the Fe II dominated region. The presence of Ti II lines was noted as a possibility in SYNOW analysis of this spectrum by Branch et al. (2002). The presence of Ti II in our models is perhaps part of the reason why the high-metallicity models fail to reproduce this region of the spectrum as well as the standard composition models: they have too much Ti II, causing their absorptions to be too strong. Ti II also has a very small feature in the 6200 Å region in our models, which may affect the evolution of that feature.
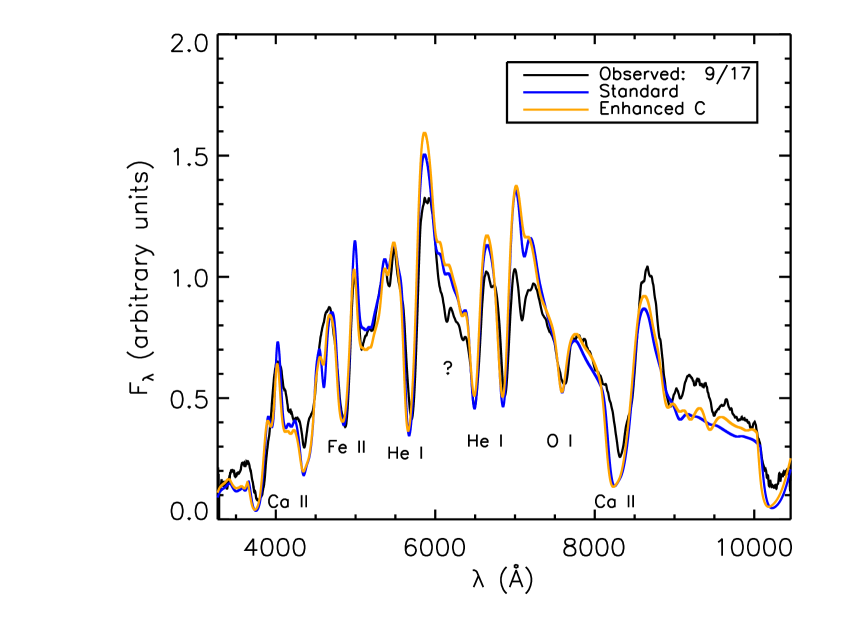
Finally, we investigate the affects of increasing carbon abundance at late times in Figure 11. Deng et al. (2000) claimed that at +14 days C II was unambiguously in the spectrum. Our late-time models show some weak features of C II around the 6200 Å feature, but the effect is minimal. Increasing the carbon abundance by ten times in our +17 day standard composition model makes little effect on the overall spectrum. C II may be responsible for an observed feature near 9500 Å that is seen in the enhanced carbon model. Unlike at earlier epochs, near maximum light, C II has some affect on the shape of particular features in the spectrum at late times, including around 6200 Å, though its effect is small.
4 Discussion
Our goal in this series of papers is to (1) determine basic physical properties of SN 1999dn at different epochs such as its effective temperature and photospheric velocity, (2) determine if He I absorption lines can be properly formed in a natural way by including non-thermal excitation, and (3) determine whether there are spectral signatures of hydrogen in this “normal” SN Ib. We have presented models to fit five epochs of SN 1999dn that did not include hydrogen; our models were homogeneous stellar atmospheres that had been stripped of their hydrogen envelopes. While this model is very simple, our spectral fits are on the whole remarkably good by PHOENIX standards. Table 2 contains a list of some of the most basic physical parameters we determined, and in all epochs He I absorptions were successfully produced in the models by including a -ray deposition that followed the density of the ejecta that allowed for non-thermal excitation.
Finally, we looked carefully at the prime candidate for H absorption, a feature around 6200 Å in the observed spectra, and tested alternative ways to reproduce the feature in models. The most successful, and a perfectly plausible, alternative is an increased metallicity of the ejecta. By increasing the metallicity to three times solar, we were able to reproduce the feature as a blend of Fe II and Si II lines well at early times without affecting the rest of the spectrum too much. At later times, as the 6200 Å becomes weaker and the spectral contribution of metals like Fe II and Ti II becomes more pronounced, the standard composition models fit better, but we cannot rule out the high-metallicity case. We considered several other alternatives to the identification of the 6200 Å feature: Si II alone created a feature too far to the blue; C II made no obvious effects in the standard composition model at maximum light; and, Ne I reproduced the feature, but only after enhancing the neon abundance by a factor of 100. Given a uniform composition with -ray deposition following the density profile of the ejecta, the most plausible alternative to H appears to be a blending of Fe II and Si II, possibly strengthened by increased metallicity.
We have noted that the 6200 Å feature evolves with time. At early epochs it appears to be a single, strong absorption feature, though this single absorption could actually be a blend of more than one line, as we showed in our high-metallicity models. However, at later times, the observed feature separates into multiple, distinct, weaker features, possibly from Fe II, Si II, C II, and Ti II. This change could be an indication that the 6200 Å feature is H at early times, and is a blend of the above ions at epochs after maximum light. However, this evolution is also seen in our models, suggesting that other physical properties play a role in, and are perhaps important causes of the observed change. Decreased temperatures affect the shapes and strengths of the Fe II and Si II lines, and allow other ions, like C II and Ti II, to become more prominent in our models. Decreased ejecta velocities cause less line blending, allowing greater resolution of nearby features. Furthermore, while our models do not include them as possibilities, stratified compositions and density structures that do not follow a single power law may affect the feature at later times as well. With our simple homogeneous parameterization, it is difficult to draw a strong conclusion. We hope to address the true nature and cause of this evolution in Paper II.
In Paper II of this series, we will add a thin shell of hydrogen to the outside of our current PHOENIX models, and attempt to fine tune its velocity coordinate and density profile to see if a model can reproduce the 6200 Å feature.
References
- Anupama et al. (2005) Anupama, G., Sahu, D., Deng, J., Nomoto, K., Tominaga, N., Tanaka, M., Mazzali, P., & Prabhu, T. 2005, ApJ, 631, L125
- Baron & Hauschildt (1998) Baron, E. & Hauschildt, P. H. 1998, ApJ, 495, 370
- Benetti et al. (2002) Benetti, S., Branch, D., Turatto, M., Cappellaro, E., Baron, E., Zampieri, L., Valle, M. D., & Pastorello, A. 2002, MNRAS, 336, 91
- Branch et al. (2006) Branch, D., Jeffery, D. J., Young, T. R., & Baron, E. 2006, PASP, 118, 791
- Branch et al. (2002) Branch, D. et al. 2002, ApJ, 566, 1005
- Cardelli et al. (1989) Cardelli, J. A., Clayton, G. C., & Mathis, J. S. 1989, ApJ, 345, 245
- Deng et al. (2000) Deng, J. S., Qiu, Y. L., Hu, J. Y., Hatano, K., & Branch, D. 2000, ApJ, 540, 452
- Elmhamdi et al. (2006) Elmhamdi, A., Danziger, I. J., Branch, D., Leibundgut, B., Baron, E., & Kirshner, R. P. 2006, A&A, 450, 305
- Filippenko (1997) Filippenko, A. V. 1997, Ann. Rev. Astr. Ap., 35, 309
- Hauschildt & Baron (1999) Hauschildt, P. H. & Baron, E. 1999, J. Comp. Applied Math., 109, 41
- Hauschildt et al. (1997a) Hauschildt, P. H., Baron, E., & Allard, F. 1997a, ApJ, 483, 390
- Hauschildt et al. (1996) Hauschildt, P. H., Baron, E., Starrfield, S., & Allard, F. 1996, ApJ, 462, 386
- Hauschildt et al. (1997b) Hauschildt, P. H., Schwarz, G., Baron, E., Starrfield, S., Shore, S., & Allard, F. 1997b, ApJ, 490, 803
- Heger et al. (2003) Heger, A., Fryer, C. L., Woosley, S. E., Langer, N., & Hartmann, D. H. 2003, ApJ, 591, 288
- Matheson et al. (2001) Matheson, T., Filippenko, A. V., Li, W., Leonard, D., & Shields, J. 2001, AJ, 121, 1648
- Parrent et al. (2007) Parrent, J., Branch, D., Troxel, M. A., Casebeer, D., Jeffery, D. J., Ketchum, W., Baron, E., Serduke, F. J. D., & Filippenko, A. V. 2007, PASP, 119, 135
- Qiu et al. (1999) Qiu, Y., Li, W., Qiao, Q., & Hu, J. 1999, AJ, 117, 736
- Schlegel et al. (1998) Schlegel, D., Finkbeiner, D., & Davis, M. 1998, ApJ, 500, 525
| H I | O I | Si I |
| He I | O II | Si II |
| He II | O III | Si III |
| C I | Ne I | Ca I |
| C II | Na I | Ca II |
| C III | Na II | Ca III |
| N I | Mg I | Fe I |
| N II | Mg II | Fe II |
| N III | Mg III | Fe III |
| Obs. Spectrum Date | Epoch | Metallicity () | (K) | () | |
|---|---|---|---|---|---|
| August 21 aaFrom Deng et al. (2000). | -10 | 1 | 6750 | 11000 | 13 |
| 3 | 7250 | 11000 | 13 | ||
| August 31 aaFrom Deng et al. (2000). | +0 | 1 | 6000 | 10000 | 13 |
| 3 | 6500 | 10000 | 13 | ||
| September 10 bbFrom Matheson et al. (2001). | +10 | 1 | 5500 | 7000 | 13 |
| 3 | 6000 | 7000 | 13 | ||
| September 14 aaFrom Deng et al. (2000). | +14 | 1 | 5500 | 7000 | 10 |
| 3 | 6000 | 7000 | 10 | ||
| September 17 bbFrom Matheson et al. (2001). | +17 | 1 | 5000 | 7000 | 10 |
| 3 | 5500 | 7000 | 10 |