Peculiar Motions in the Region of the Ursa
Major Supercluster of Galaxies
Flera G. Kopylova∗ and Alexander I. Kopylov
Special Astrophysical Observatory, Russian Academy of Sciences,
Nizhnii Arkhyz,
369167 Karachai-Cherkessian Republic, Russia
Abstract
We have investigated the peculiar motions of clusters of galaxies in the Ursa Major (UMa) supercluster and its neighborhood. Based on SDSS (Sloan Digital Sky Survey) data, we have compiled a sample of early-type galaxies and used their fundamental plane to determine the cluster distances and peculiar velocities. The samples of early-type galaxies in the central regions (within ) of 12 UMa clusters of galaxies, in three main subsystems of the supercluster — the filamentary structures connecting the clusters, and in nine clusters from the nearest UMa neighborhood have similar parameters. The fairly high overdensity (3 by the galaxy number and 15 by the cluster number) suggests that the supercluster as a whole is gravitationally bound, while no significant peculiar motions have been found: the peculiar velocities do not exceed the measurement errors by more than a factor of 1.5–2. The mean random peculiar velocities of clusters and the systematic deviations from the overall Hubble expansion in the supercluster are consistent with theoretical estimates. For the possible approach of the three UMa subsystems to be confirmed, the measurement accuracy must be increased by a factor of 2–3.
Key words: galaxies, clusters of galaxies.
Introduction
The superclusters of galaxies, the largest systems in the Universe, are giant filamentary structures in the large-scale structure (e.g., such superclusters as Perseus (Gregory et al. 2000) Pisces – Cetus (Porter and Raychaudhury 2005)) and are not virialized structures. The peculiar motions in the region of various superclusters were investigated by many authors (by Aaronson et al. (1989) in the Hydra – Centaurus supercluster and by Han and Mould (1992), Baffa et al. (1993), Hudson et al. (1997), and Springob et al. (2003) in the Perseus – Pisces supercluster). Investigation of the dynamical state of two large superclusters, Shapley (Ettory et al. 1997) and Corona Borealis (Small et al. 1998), suggests that their central regions are at the stage of gravitational collapse. Gramann and Suhhonenko (2002) found (in terms of models using Nbodies) the fraction of such superclusters to be insignificant.
We found the overdensity of the Ursa Major (UMa) system in its central part (, , ) compared to the surrounding region (, , , ) with a size of about 150 Mpc from galaxies with redshifts (according to NED data; these are mainly SDSS DR4 data) to be by the galaxy number and by the Abell cluster number (Abell et al. 1989) together with additional clusters (according to NED data) discovered in X-rays. This overdensity is high enough for the system to be gravitationally bound, for example, for the spherical case (Dünner et al. 2006). For comparison, the galaxy number overdensity for the richer Corona Borealis supercluster is 7 (Small et al. 1998). The simulation performed in this paper and the Hubble diagram constructed previously (Kopylova and Kopylov 1998) show that the core of the system may be at the stage of gravitational collapse.
The UMa supercluster is a large flattened structure (Figs. 1 and 2) with sizes of Mpc in right ascension, declination, and line of sight, respectively, a wall in the classification of large-scale structure elements (Doroshkevich et al. 2004) that is divided along the line of sight into three filamentary subsystems (Figs. 1a–1c, 2). The UMa system is an isolated one and is of interest in studying the composition of the system and the evolution of its constituent elements (galaxies, filaments, and clusters of galaxies) as well as the dynamical state of the system as a whole, which characterizes the mass distribution on these scales.
In this paper, we used photometric and spectroscopic measurements from the SDSS DR4 catalog. Our goal was to measure the peculiar motions of clusters of galaxies inside filaments, the motions of the filaments themselves, and clusters surrounding the UMa supercluster using the fundamental plane of the early-type galaxies. The paper is structured as follows. In the first part, we compile and describe a sample of early-type galaxies and give their distributions in various parameters. In the second part, we present the fundamental plane of the early-type galaxies for our sample and the peculiarities of using it to determine the distances. In the third part, we determine the peculiar velocities of various subsystems of UMa and its neighborhood. In conclusion, we give our main results. Here, we used the following cosmological parameters: , , km s-1 Mpc-1.
The selection of early-type galaxies
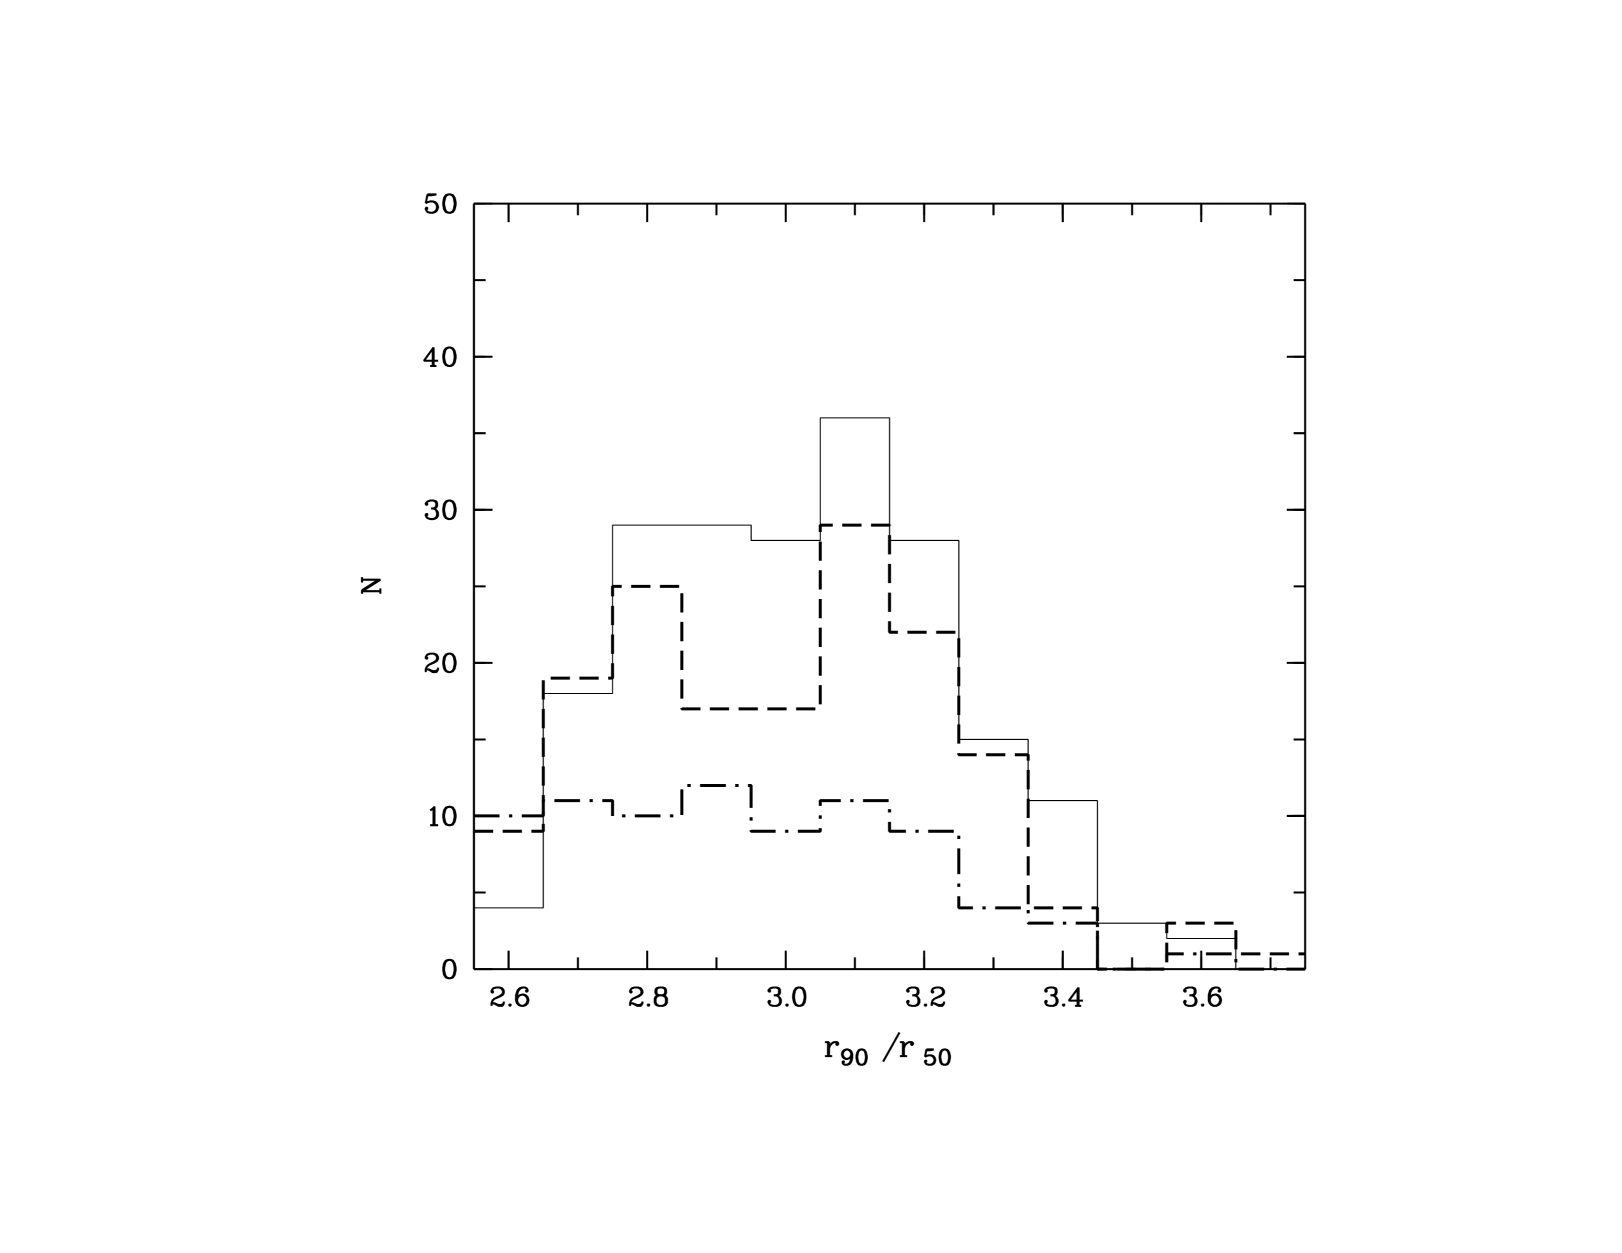
The fourth edition of the SDSS DR4 catalog (Adelman-McCarthy et al. 2006) allowed us to compile a sample of early-type galaxies in the supercluster region () in the filter. The galaxies were selected according to the following criteria: (the parameter characterizes the contribution from the de Vaucouleurs bulge to the galaxy surface brightness profile), km s-1, (the parameter characterizes the galaxy spectrum — there are no detectable emission lines in the spectrum), and (the concentration index is equal to the ratio of the radii within which 90% and 50% of the Petrosian fluxes are contained). According to Strateva et al. (2001) and Kauffmann et al. (2003), precisely this index identifies early-type galaxies. Different authors use different values of the index: 2.86 (Shimasaku et al. 2001) and 2.5 (Blanton et al. 2003).
Thus, we compiled three samples of galaxies. The first sample includes early-type galaxies in UMa clusters within the radii that we determined previously (Kopylova and Kopylov 2006). The second sample includes galaxies located in three large layers (filamentary subsystems) of the supercluster, except for the galaxies belonging to virialized cluster regions. The third sample represents clusters of galaxies surrounding the supercluster and located within 80 Mpc of the UMa center. These clusters will be studied in more detail in a subsequent paper.
Table 1 gives the following cluster parameters: equatorial coordinates for epoch J2000.0, redshifts (relative to the Sun), radial velocity dispersion within , the radius within which the galaxy density exceeds the critical density by a factor of 200, and the number of galaxies with measured radial velocities within . The clusters A1279 and RXCJ1010 were not involved in the radial velocity determination, because there is only one galaxy and no galaxy with a measured velocity dispersion, respectively, in the central region of the former cluster and in the latter cluster in SDSS DR4. We took the data for UMa from our previous paper (Kopylova and Kopylov 2006) and will publish the data for the clusters from the UMa neighborhood in a subsequent paper. We selected 58 galaxies () in UMa layer I; their mean is 0.051. The boundary between layers II and III was chosen to be different from that shown in Fig. 2 of the above paper. It was displaced toward the higher by 0.01. Layer II contains 83 galaxies () with a mean and layer III contains 57 galaxies () with a mean . Figure 3 shows the distribution of galaxies belonging to these filaments in the plane of the sky of the supercluster. We selected 153 galaxies in virialized regions of 12 UMa clusters and 80 galaxies in virialized regions of 9 clusters surrounding the supercluster. As a result, our sample consists of 431 early-type galaxies.
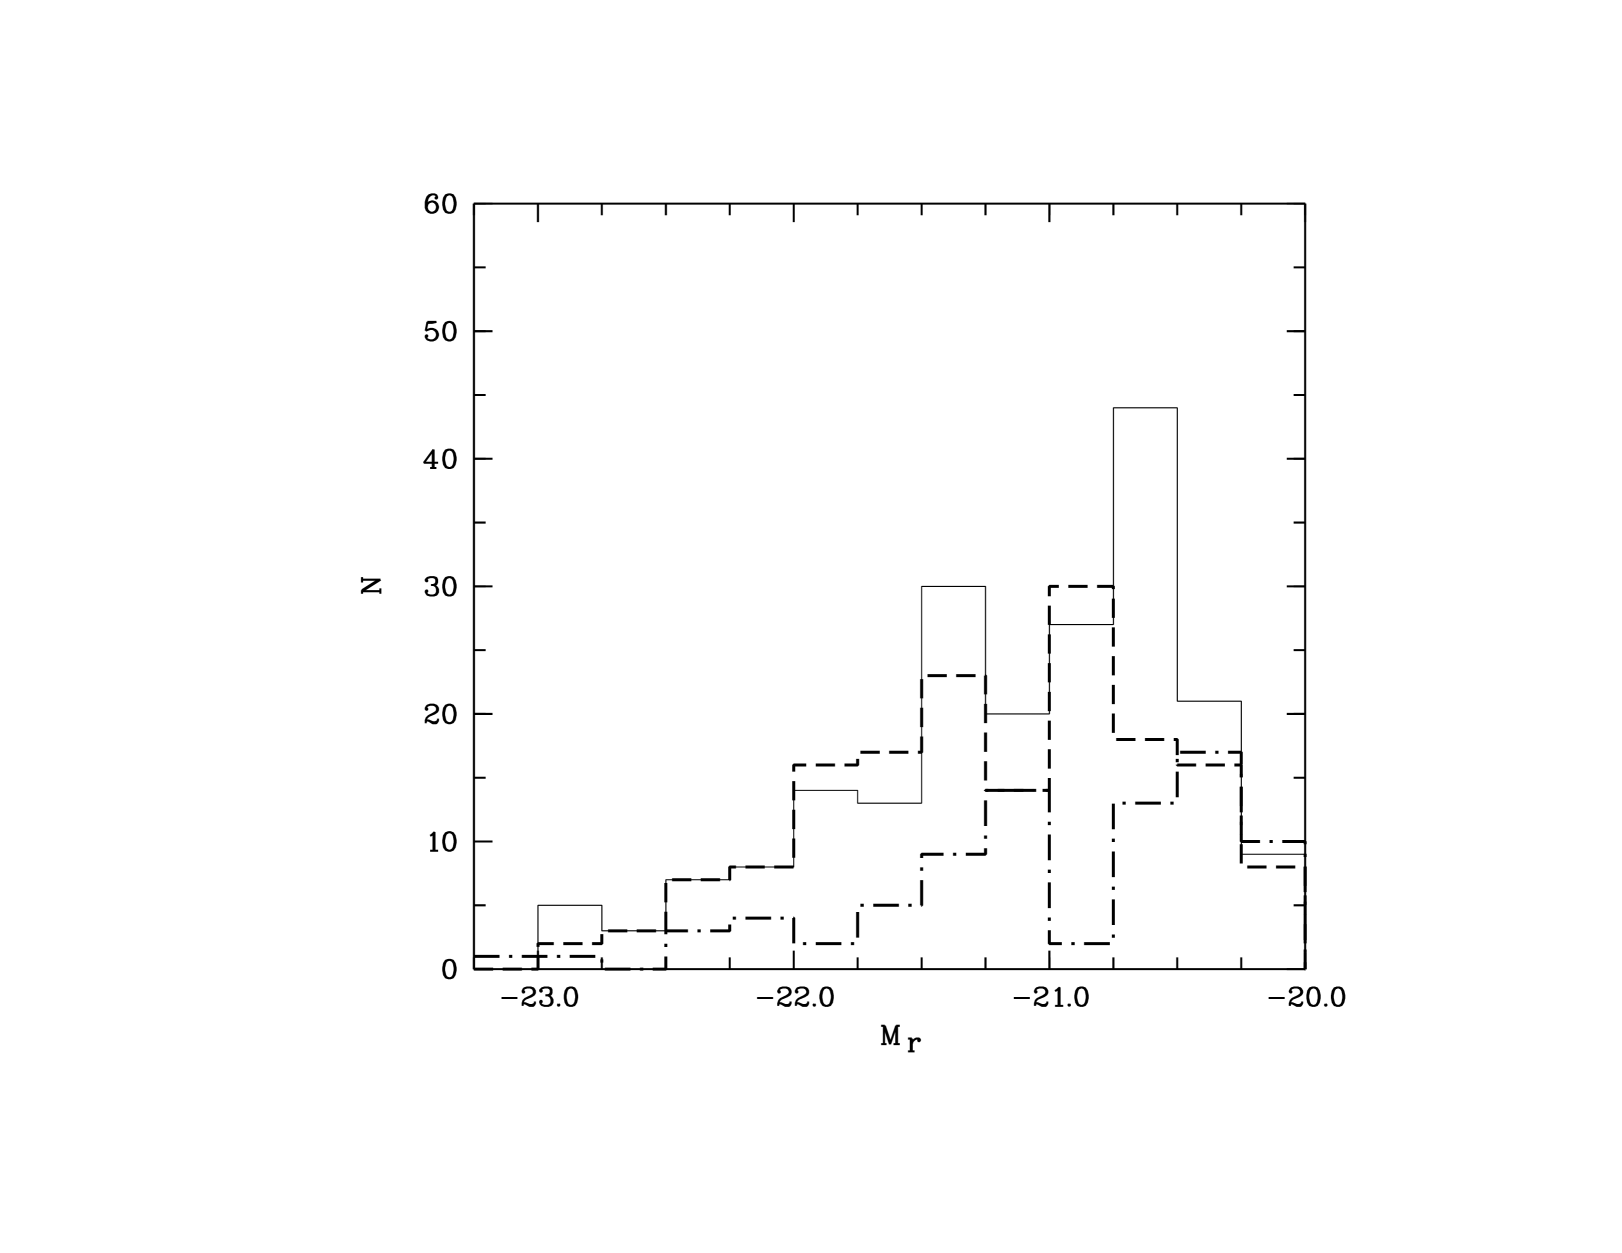
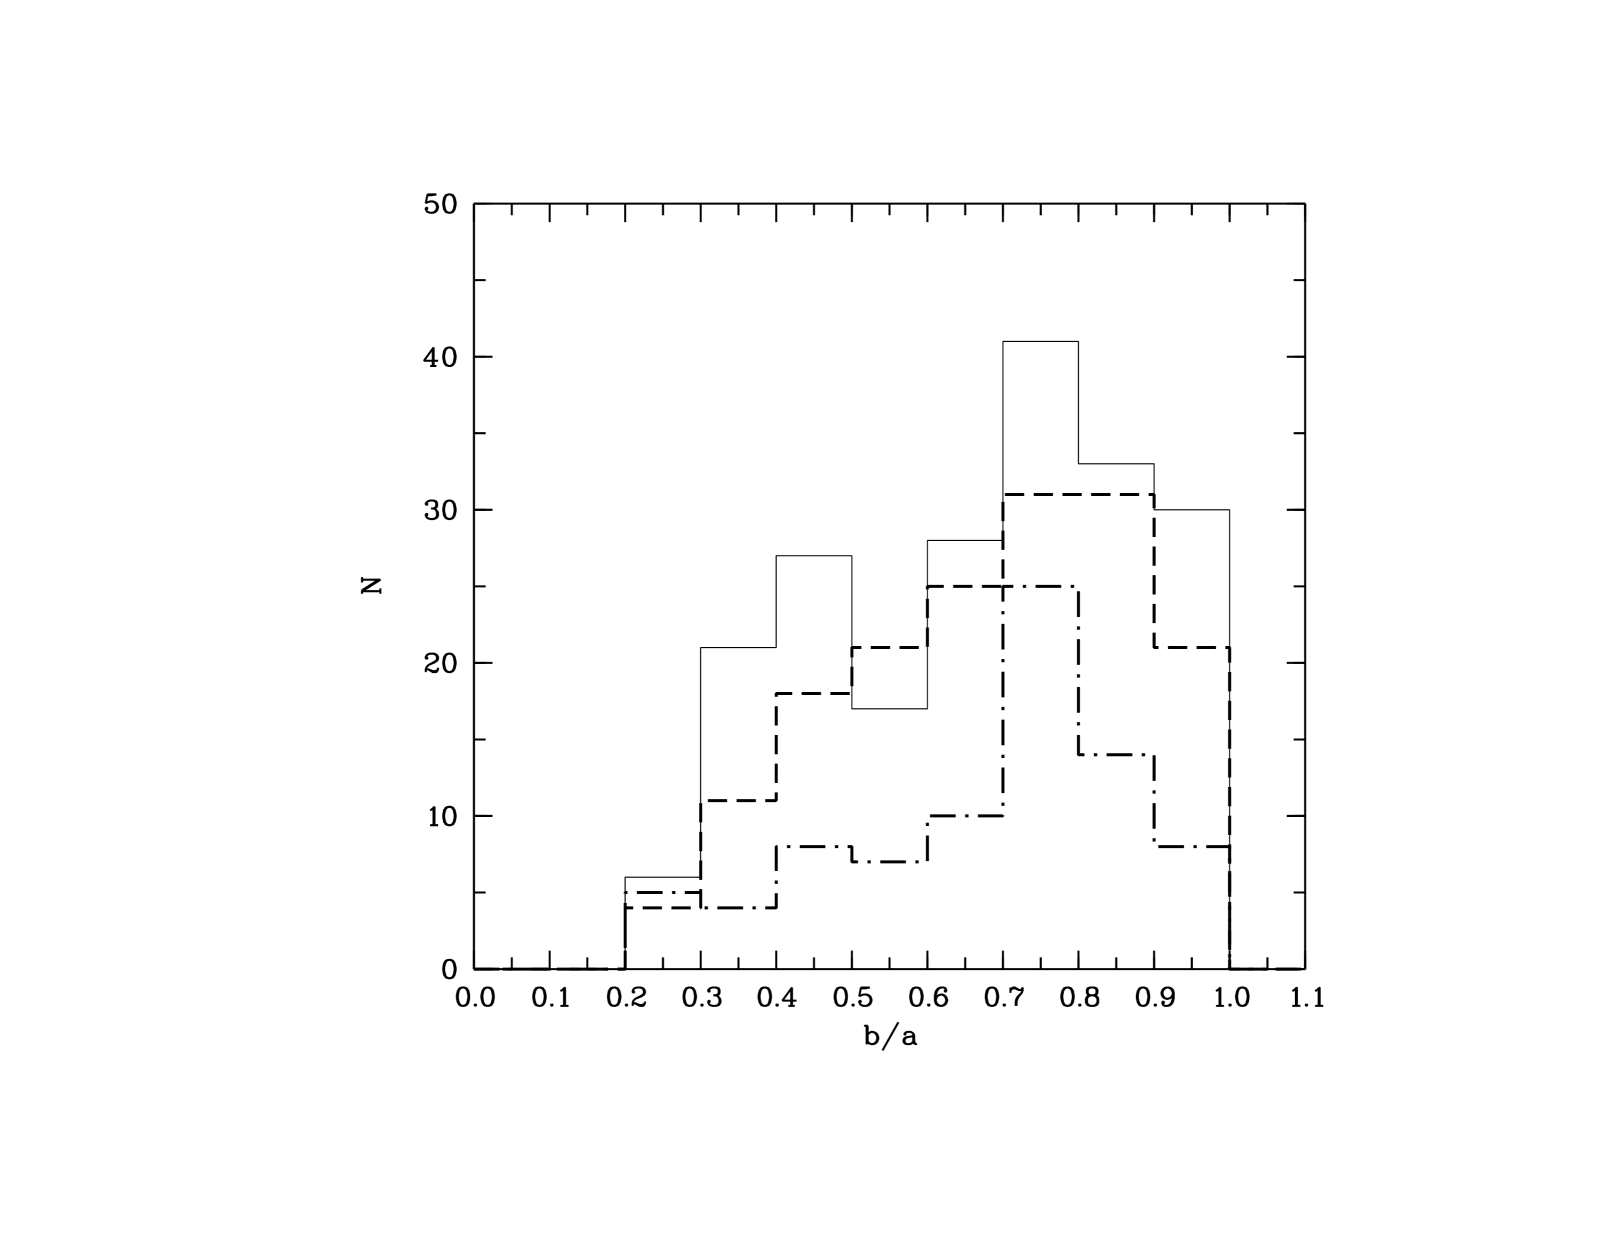
Figure 4 presents the distributions of early-type galaxies from the three samples in the following parameters: absolute magnitude, ellipticity , logarithm of the velocity dispersion, and concentration index . Analysis of the histograms suggests that the early-type galaxies in all three samples have similar distributions. For example, galaxies fainter than account for about 50% of the galaxies in all three samples. The axial ratio for the most flattened E7-type elliptical galaxies is known to be 0.3, while most of the elliptical galaxies have (Bernardi et al. 2003). A visual examination of the galaxies with (33% in UMa, 27% in the surrounding clusters, and 35% in the filaments) shows that these are mostly S0-type galaxies. Our sample of early-type galaxies has magnitudes from ; the magnitude was taken as the sample limit (there are few galaxies fainter than this limit). Table 2 presents the means and their standard deviations for some of the parameters of galaxies from each sample.
The fundamental plane and distance determination
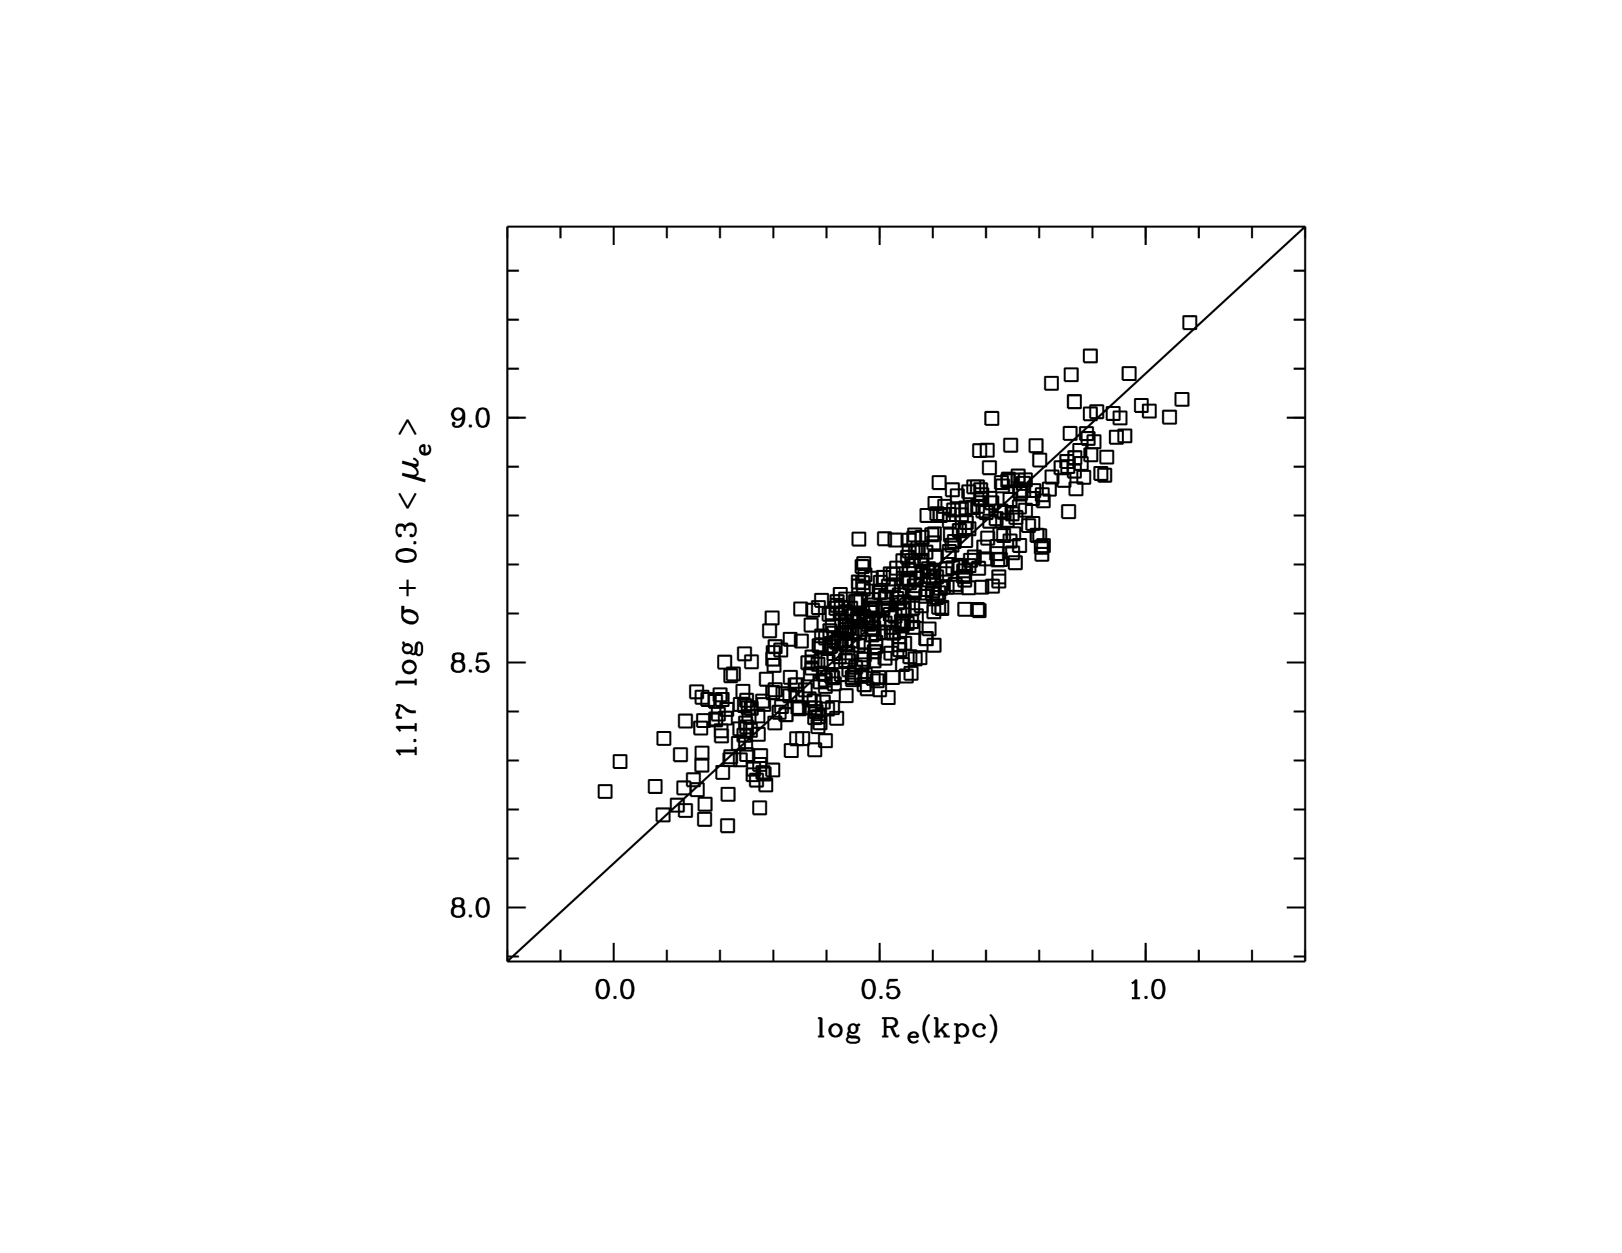
Most of the parameters of early-type galaxies determined from photometric and spectroscopic observations are correlated. The fundamental plane (FP) is the most convenient combination of parameters for measuring the relative distances of clusters of galaxies (Dressler et al. 1987; Djorgovski and Davis 1987). This plane combines a spectroscopically measured parameter — the central stellar velocity dispersion of a galaxy and photometrically measured parameters — the effective radius within which the galaxy’s luminosity is half of its total luminosity and the effective surface brightness at or (more commonly) within the effective radius. The FP generally has an rms scatter of 0.08–0.09 corresponding to the accuracy of determining the distance to an individual galaxy 19–21%. Depending on the number of galaxies used, the accuracy in clusters is 3–10%. Various studies show that clusters with intense X-ray emission, i.e., the most massive virialized clusters (Gibbons et al. 2001), have the smallest scatter on the FP. In the SDSS catalog, the model parameters of early-type galaxies were determined by fitting two-dimensional (bulge + disk) models to the observed profile by taking into account the image quality and the atmospheric and galactic extinctions. We used the derived parameters — the equivalent (in a circular aperture) effective radius () measured in arcseconds was converted to kiloparsecs (), the mean effective surface brightness was calculated using the formula , and the central velocity dispersion was reduced, as recommended, to the standard circular aperture — to calculate the peculiar velocities of the clusters. A correction, , was applied to the surface brightnesses; the K correction and the evolutionary correction are approximately equal, but have opposite signs (Poggianti 1997). Thus, all of the data were reduced to the comoving reference frame.
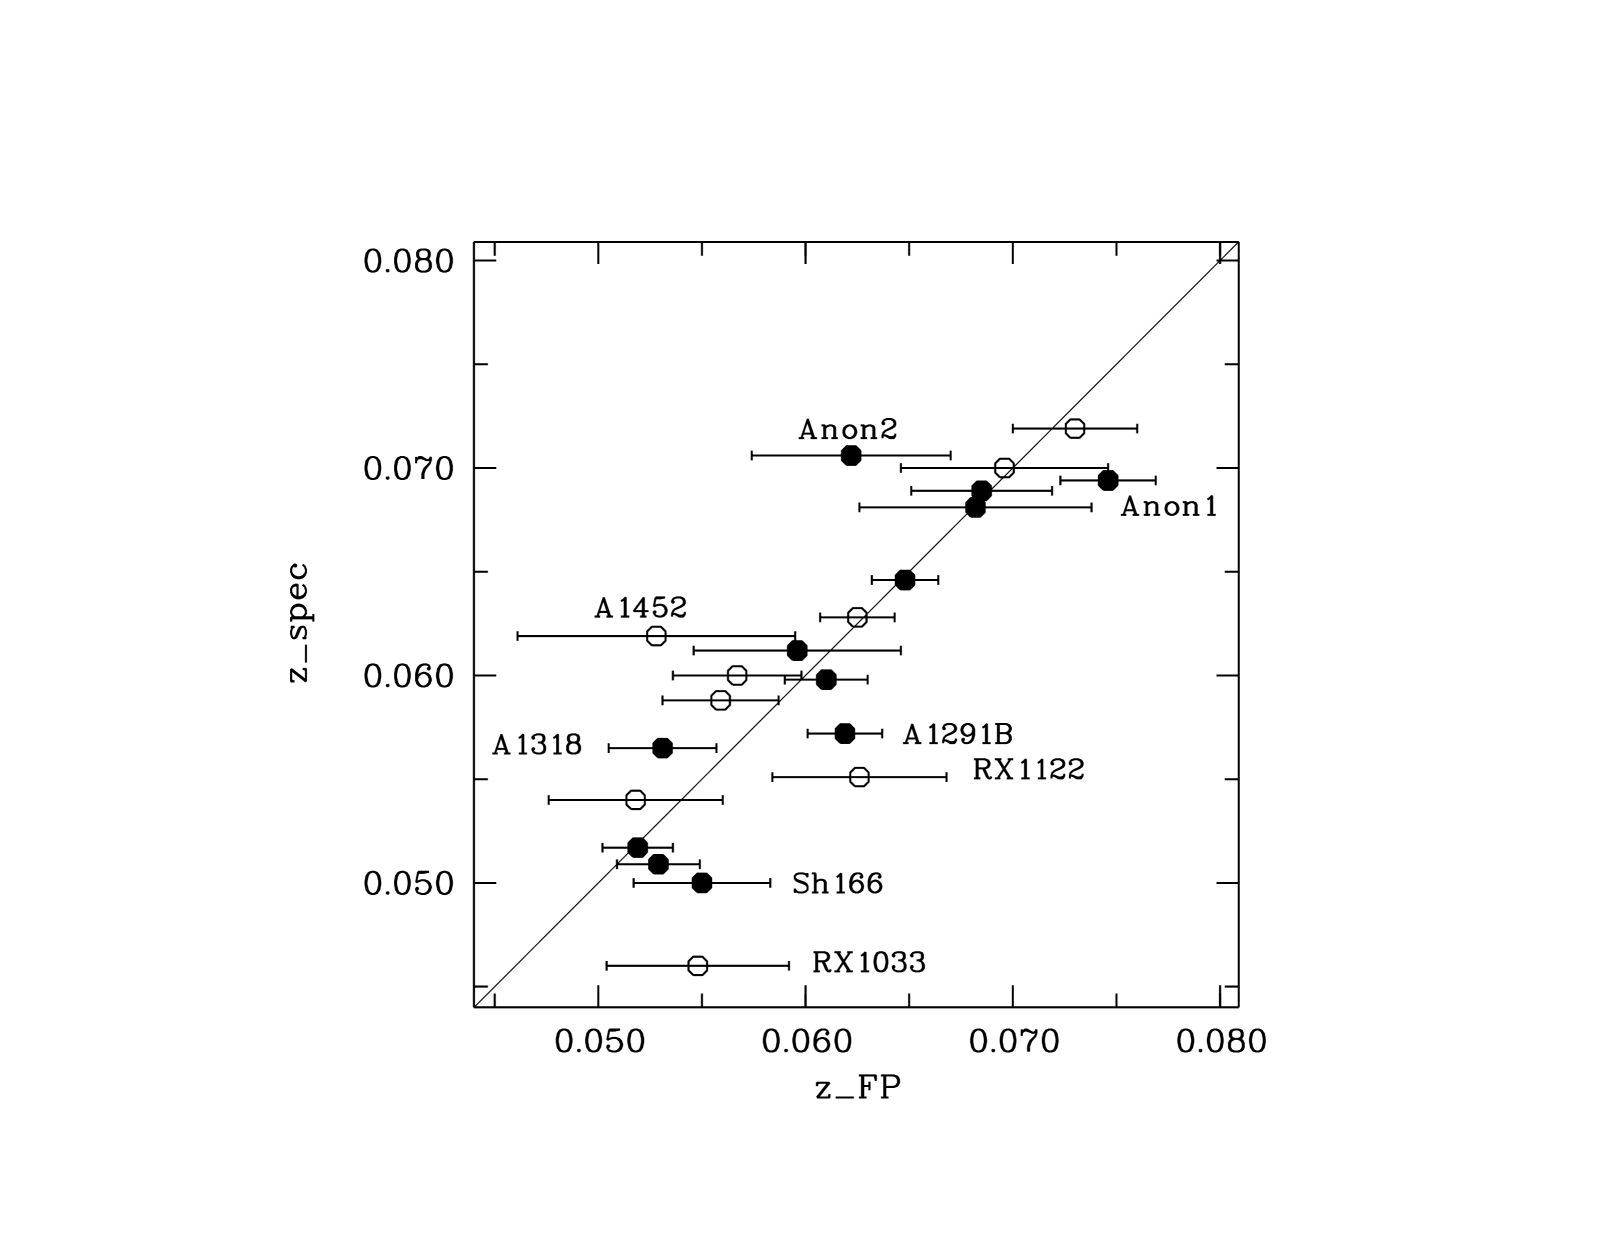
The fundamental plane of the early-type galaxies based on SDSS data for determining the distances was obtained by minimizing the deviations relative to and in the filter is (Bernardi et al. 2003) = (, the rms deviation is 0.088). For orthogonal minimization, the coefficient of is 1.49, the coefficient of surface brightness does not change, and the rms deviation is 0.094. Figure 5 shows the FP for the early-type galaxies of our sample seen along the ”long edge” — the effective radius. The line corresponds to the SDSS FP with the zero point for our sample. The scatter in Fig. 5 is 0.082, which corresponds to an error in the distance to an individual galaxy of 19%. The mean error in the distances to clusters of galaxies is 6%. The residual deviations from the FP defined as (where C — is the derived zero point of the sample, ) show a dependence on the galaxy magnitude and on other parameters that correlate with the magnitude (, the concentration index, and the color index). Jørgensen et al. (1996) pointed to the existence of such a dependence on the galaxy magnitude. Adding the color or the concentration index to the FP as the fourth parameter does not change the situation significantly. The magnitude dependence begins to manifest itself for galaxies fainter than . For orthogonal regression, the magnitude dependence is weaker, the scatter is larger, and a weak dependence on the velocity dispersion is observed. Therefore, we decided to use both regressions to determine the distances to clusters of galaxies and to average the peculiar velocities determined from these distances. The galaxies that deviated by more than (11) were not involved in the distance determination (these are not shown in Fig. 5).
Peculiar motions in the UMa Supercluster region
For low redshifts, the Hubble law is — the velocity of mutual recession of the galaxies is proportional to the distance , is the Hubble constant. The Hubble law makes it possible to determine the distance to a galaxy in the first approximation by ignoring the peculiar velocity of the object. Measuring the distance by a different method, we can separate an additional component (along the line of sight), the peculiar velocity of a galaxy or a cluster of galaxies, from the directly observed radial velocity (): . In practice, the determined difference between the zero point of a cluster and the mean zero point is used to calculate the photometric redshifts (distances) .The peculiar velocities of clusters of galaxies in the comoving reference frame are equal to the difference between the spectroscopic and photometric redshifts: .
One might expect several types of peculiar motions in the UMa supercluster and its neighborhood: the motion of clusters along the filaments, the approach of the filaments themselves, and the motion of clusters from the nearest neighborhood of UMa toward the supercluster if it is massive enough. We confirmed our previously obtained result using the photometric distances (statistically corrected for the dependence on the galaxy magnitude; Kopylova and Kopylov 2001) measured using Kormendy’s relation that the UMa system on the whole obeys the Hubble relation between and (Fig. 6). In this study, the individual peculiar velocities of the clusters are, on average, low; they do not exceed the measurement errors by more than a factor of 1.5–2. The mean dispersion around the FP (direct regression relative to ) is 0.063 for the UMa clusters, 0.075 for the surrounding clusters, and 0.066 for the clusters with (N — is the number of galaxies involved in the cluster distance determination). The error in the relative distances to the clusters of galaxies (the mean for all clusters) is 6%. The peculiar velocities of the UMa clusters are presented in Table 3. In addition to the cluster name, this table gives the number of early-type galaxies involved in the cluster distance determination, , the peculiar velocities determined from direct regression and then from orthogonal regression, and their mean value. The peculiar velocities of the three filamentary structures as a whole that constitute the UMa supercluster are presented in Table 4. The peculiar velocities found are low and comparable to the measurement errors. The following main conclusion can be reached: the UMa system begins to deviate from the overall Hubble expansion (along the line of sight). At least the signs of the peculiar velocities of the filamentary structures suggest that there is already a tendency for this deviation.
The peculiar motions of clusters of galaxies differ in different cosmological models and provide constraints on the mass density in the Universe (see, e.g., Bahcall and Oh (1996) and references therein). For the clusters of galaxies in our sample (21 clusters), we determined the dispersion of the observed peculiar velocity distribution, km s-1, and, with a quadratic allowance for the measurement errors, km s-1. For the UMa supercluster, we obtained km s-1; including the measurement errors yields km s-1. For the clusters of galaxies from the nearest UMa neighborhood, we found km s-1 and, including the measurement errors, km s-1. For the clusters of galaxies with 8 members (the more galaxies are involved in the cluster distance determination, the higher the accuracy), we found km s-1 and, including the errors, . For comparison, we determined the peculiar velocity dispersion for 20 nearby rich clusters of galaxies from Gibbons et al. (2001) in a similar way. It was found to be km s-1 and, including the errors, km s-1. Our estimates of the (random) peculiar velocities for the clusters agree, within the error limits, with the dependences found by Sheth and Diaferio (2001) from computer simulations as part of the Virgo Consortium project at the corresponding mean ambient overdensity.
On the whole, the pattern of peculiar velocities inside UMa is consistent with the observed overdensity. For a spherical mass concentration at a linear stage of collapse, the radial peculiar velocity is defined by the equation (Yahil 1985) . At and km s-1, we obtain km s-1. However, since the UMa supercluster is highly elongated along the line of sight, the peculiar velocity along its major axis should be lower than that for a spherical mass distribution. According to our data (Table 4), the radial velocities of the two extreme layers (filaments) relative to the central layer are km s-1, which is consistent with the theoretical estimate, given the low measurement accuracy. The overdensity in the layers (filaments) is higher than that in the supercluster as a whole (Fig. 3). Therefore, one might expect the peculiar velocities to be higher inside the filaments. This is probably observed at least for the two closest pairs of clusters: A1291B, A1318 and Anon1, Anon2. The peculiar velocities for all these clusters are high and are directed oppositely in each of the pairs.
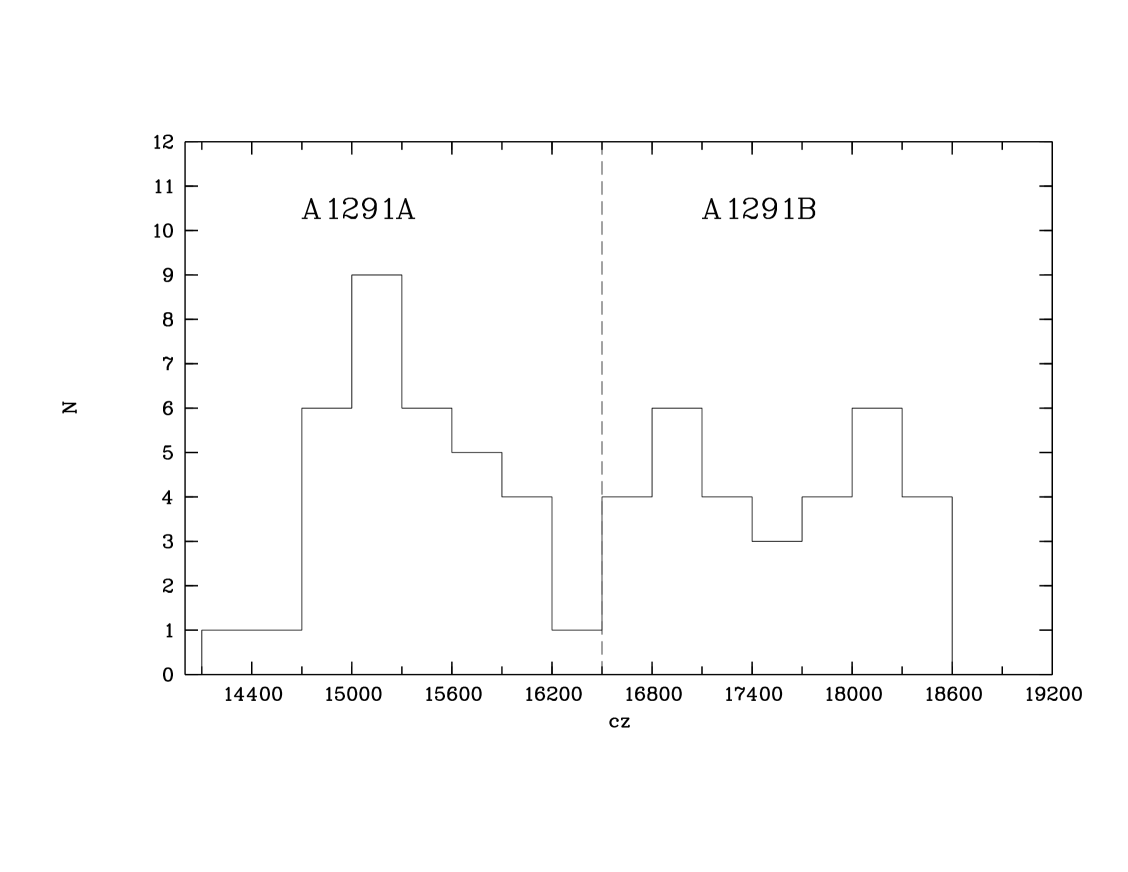
The cluster A1291 in the ACO catalog (Abell et al. 1989) was determined as a cluster of richness class 1. According to SDSS DR4 data, here there are several peaks in the radial velocity distribution (Fig. 7) from 14000 to 18500 km s-1, i.e., the galaxies may form a filamentary structure oriented along the line of sight. We identified two clusters: one cluster, A1291A, is associated with the largest peak (the velocity range 14100–16500 km s-1)and includes the brightest cluster galaxy (no. 74 in Kopylova and Kopylov (2001); the other cluster, A1291B, has the velocity range 16500–18600 km s-1 and may, in turn, consist of two subsystems. Both clusters have peculiar velocities directed to the observer. The cluster A1291B approaches A1318, which has a radial peculiar velocity component directed to the UMa center. A similar situation, but with a lower measurement accuracy, is observed in the pair of clusters Anon1 and Anon2 in the third filament.
The peculiar velocity dispersion for the clusters of galaxies from the nearest UMa neighborhood and the scatter of galaxies on the FP are considerably larger than those for the supercluster. This can be explained in two ways. The clusters in the central regions are not virialized enough: half of them have clearly distinguishable subsystems in the plane of the sky (e.g., the cluster RXJ1033 has three subsystems). Since we investigate the central part of the cluster with radius (the cluster center is close to the X-ray emission center), the relative motion of the subsystems inside the cluster may be responsible for the derived peculiar velocity (and the additional FP broadening). In addition, the influence of the supercluster may be responsible for the peculiar velocities of the clusters: for example, the clusters A1452 and A1507 closest to UMa show motions toward the supercluster (or the subsystem associated with the cluster A1436 (Fig. 3)).
Conclusions
The UMa supercluster comprises (according to the radial velocity measurements of galaxies in SDSS) three large filamentary structures that are clearly distinguishable both in projection onto the plane of the sky and from radial velocity measurements. We compiled a sample of early-type galaxies in the central parts of 12 clusters of galaxies and in the filamentary structures constituting the UMa system as well as in the nine nearest clusters of galaxies in the UMa neighborhood. Using the fundamental plane of the early-type galaxies, we determined the distances and found the peculiar velocities of the clusters of galaxies in the comoving reference frame associated with the supercluster as a whole independently of the radial velocity measurements for galaxies.
Our main conclusions are the following.
(1) The early-type galaxies in the central regions of 12 UMa clusters, in the filamentary structures connecting the clusters, and in 9 relatively isolated clusters from the nearest UMa neighborhood have similar distributions in absolute magnitude , central velocity dispersion , concentration index , and axial ratio .
(2) The peculiar velocities in the UMa system are low. They do not exceed the measurement errors by more than a factor of 1.5–2 and correspond in order of magnitude to the observed overdensity in the central part of the supercluster relative to the mean density in the surrounding volume 150 Mpc in size (about 3 by the galaxy number and 15 by the cluster number).
(3) The deviations from the Hubble law in the UMa system consisting of three filamentary structures (which are clearly distinguishable both from radial velocity measurements and in the plane of the sky) are insignificant, but they point to an approach of the filaments. To confirm the possible approach of the three UMa subsystems, the measurement accuracy must be increased by a factor of 2–3.
Acknowledgments
The creation and distribution of the SDSS Archive has been funded by the Alfred P. Sloan Foundation, the Participating Institutions, the National Aeronautics and Space Administration, the National Science Foundation, the US Department of Energy, the Japanese Monbukagakusho, and the Max Planck Society. The SDSS Web site is http://www.sdss.org/.
References
- 1.
-
M. Aaronson, G. D. Bothun, M. E. Cornell, et al., Astrophys. J. 338, 654 (1989).
- 2.
-
G. O. Abell, H. G. Corwin, Jr., and R. P. Olowin, Astrophys. J., Suppl. Ser. 70, 1 (1989).
- 3.
-
J. K. Adelman-McCarthy, M.A.Aqueros, S.S. Alam, et al., Astrophys. J., Suppl. Ser. 162, 38 (2006).
- 4.
-
C. Baffa, G. Chincarini, R.B.C.Henry, and J. Manousoyanaki, Astron. Astrophys. 280, 20 (1993).
- 5.
-
N. A. Bahcall and S. P. Oh, Astrophys. J. 462, L49 (1996).
- 6.
-
M. Bernardi, R.K.Sheth, J.Annis, et al., Astron.J. 125, 1866 (2003).
- 7.
-
M. R. Blanton, D. W. Hogg, N. A. Bahcall, et al., Astrophys. J. 594, 186 (2003).
- 8.
-
S. Djorgovski and M. Davis, Astrophys. J. 313, 59 (1987).
- 9.
-
A. Doroshkevich, D.L.Tucker, S. Allam, and M. J. Way, Astron. Astrophys. 418, 7 (2004).
- 10.
-
A. Dressler, D. Lynden-Bell, D. Burstein, et al., Astrophys. J. 313, 42 (1987).
- 11.
-
R. Dünner, P. A. Araya, A. Meza, and A. Reizenegger, astro-ph/0603709 (2006).
- 12.
-
S. Ettory, A. C. Fabian, and D. A. White, Mon. Not. R. Astron. Soc. 289, 787 (1997).
- 13.
-
R. A. Gibbons, A. S. Fruchter, and G. D. Bothun, Astron. J. 121, 649 (2001).
- 14.
-
M. Gramann and I. Suhhonenko, Mon. Not. R. Astron. Soc. 329, L47 (2002).
- 15.
-
S. A. Gregory, W. G. Tifft, J. W. Moody, et al., Astron. J. 119, 567 (2000).
- 16.
-
M. Han and J. R. Mould, Astrophys. J. 396, 453 (1992).
- 17.
-
M. J. Hudson,J.R. Lucey,R. J.Smith,etal., Mon. Not. R. Astron. Soc. 291, 488 (1997).
- 18.
-
I.Jørgensen, M. Franx, and P. Kjaergaard, Mon. Not. R. Astron. Soc. 280, 167 (1996).
- 19.
-
G. Kauffmann, T. M. Heckman, S. D. M. White, et al., Mon. Not. R. Astron. Soc. 341, 54 (2003).
- 20.
-
F. G. Kopylova and A. I. Kopylov, Pis’ma Astron. Zh. 24, 573 (1998) [Astron. Lett. 24, 491 (1998)].
- 21.
-
F. G. Kopylova and A. I. Kopylov, Pis’ma Astron. Zh. 27, 403 (2001) [Astron. Lett. 27, 345 (2001)].
- 22.
-
F. G. Kopylova and A. I. Kopylov, Pis’ma Astron. Zh. 32, 95 (2006) [Astron. Lett. 32, 84 (2006)].
- 23.
-
B. M. Poggianti, Astron. Astrophys., Suppl. Ser. 122, 399 (1997).
- 24.
-
S. C. Porter and S. Raychaudhury, Mon. Not. R. Astron. Soc. 364, 1387 (2005).
- 25.
-
R. K. Sheth and A. Diaferio, Mon. Not. R. Astron. Soc. 322, 901 (2001).
- 26.
-
K. Shimasaku, M. Fukugita, M. Doi, et al., Astron. J. 122, 1238 (2001).
- 27.
-
T. A. Small, Ching-Pei Ma, W. L. W. Sargent, and D. Hamilton, Astrophys. J. 492, 45 (1998).
- 28.
-
C. M. Springob, M. P. Haynes, and R. Giovanelli, Bull.Am. Astron.Soc. 35, 1283 (2003).
- 29.
-
I. Strateva, I. Ẑeliko, G.R.Knapp, et al., Astron.J. 122, 1861 (2001).
- 30.
-
A. Yahil, The Virgo Cluster of Galaxies, Ed. by O. Richter and B. Binggeli (ESO, Garching, 1985), p.359.
Translated by V. Astakhov
Table 1. Parameters of galaxy clusters in the UMa supercluster and its neighborhood
| Cluster | RA J2000.0 | DEC J2000.0 | , km s-1 | , Mpc | ||
|---|---|---|---|---|---|---|
| A1270 | 11 29 42.0 | +54 05 56 | 0.06890 | 53 | 553 | 1.24 |
| A1291A | 11 32 21.1 | +55 58 03 | 0.05092 | 17 | 424 | 0.97 |
| A1291B | 11 32 02.4 | +56 04 12 | 0.05715 | 10 | 450 | 1.02 |
| A1318 | 11 36 03.5 | +55 04 31 | 0.05647 | 37 | 411 | 0.94 |
| A1377 | 11 47 21.3 | +55 43 49 | 0.05170 | 74 | 613 | 1.40 |
| A1383 | 11 48 05.8 | +54 38 47 | 0.05979 | 55 | 527 | 1.20 |
| A1436 | 12 00 08.8 | +56 10 52 | 0.06517 | 71 | 701 | 1.60 |
| Anon1 | 11 15 23.8 | +54 26 39 | 0.06944 | 41 | 561 | 1.25 |
| Anon2 | 11 19 46.0 | +54 28 02 | 0.07056 | 13 | 253 | 0.60 |
| Anon3 | 11 29 32.3 | +55 25 20 | 0.06806 | 23 | 362 | 0.81 |
| Anon4 | 11 39 08.5 | +55 39 52 | 0.06118 | 24 | 391 | 0.89 |
| Sh166 | 12 03 11.9 | +54 50 50 | 0.04996 | 18 | 318 | 0.73 |
| A1003 | 10 25 01.6 | +47 50 30 | 0.06282 | 29 | 606 | 1.37 |
| A1169 | 11 07 49.3 | +43 55 00 | 0.05882 | 52 | 581 | 1.32 |
| A1279 | 11 31 39.3 | +67 13 27 | 0.05432 | 6 | 187 | 0.43 |
| A1452 | 12 03 28.4 | +51 42 56 | 0.06186 | 20 | 513 | 1.16 |
| A1461 | 12 04 24.7 | +42 33 43 | 0.05405 | 12 | 317 | 0.72 |
| A1507 | 12 14 48.6 | +59 54 22 | 0.06002 | 34 | 401 | 0.91 |
| A1534 | 12 24 42.8 | +61 28 15 | 0.06999 | 17 | 304 | 0.68 |
| RXCJ1010 | 10 10 16.1 | +54 30 06 | 0.04581 | 44 | 407 | 0.94 |
| RXJ1033 | 10 33 51.2 | +57 03 21 | 0.04598 | 25 | 398 | 0.92 |
| RXCJ1053 | 10 54 11.2 | +54 50 18 | 0.07186 | 47 | 506 | 1.13 |
| RXCJ1122 | 11 22 15.4 | +67 13 19 | 0.05511 | 11 | 236 | 0.54 |
Table 2. Mean parameters of early-type galaxies: (1) UMa clusters, (2) filaments,
and (3) surrounding clusters
| Sample | ||||||
|---|---|---|---|---|---|---|
| (1) | 153 | 0.68 (0.19) | 2.99 (0.24) | 2.24 (0.09) | ||
| (2) | 198 | 0.67 (0.20) | 3.02 (0.22) | 2.24 (0.09) | ||
| (3) | 80 | 0.70 (0.19) | 2.96 (0.24) | 2.23 (0.10) |
Table 3. Peculiar velocities of clusters
| Cluster | , km s-1 | , km s-1 | , km s-1 | ||
|---|---|---|---|---|---|
| A1270 | 18 | 0.06819 | |||
| A1291A | 8 | 0.05265 | |||
| A1291B | 5 | 0.06089 | |||
| A1318 | 8 | 0.05288 | |||
| A1377 | 20 | 0.05158 | |||
| A1383 | 22 | 0.06069 | |||
| A1436 | 34 | 0.06450 | |||
| Anon1 | 18 | 0.07424 | |||
| Anon2 | 5 | 0.07002 | |||
| Anon3 | 5 | 0.06791 | |||
| Anon4 | 4 | 0.05677 | |||
| Sh166 | 6 | 0.05472 | |||
| A1003 | 9 | 0.06421 | |||
| A1169 | 14 | 0.05592 | |||
| A1452 | 6 | 0.05285 | |||
| A1461 | 4 | 0.05177 | |||
| A1507 | 15 | 0.05673 | |||
| A1534 | 8 | 0.06959 | |||
| RXJ1033 | 4 | 0.05484 | |||
| RXCJ1053 | 15 | 0.07303 | |||
| RXCJ1122 | 5 | 0.06256 |
Table 4. Peculiar velocities of filaments
| Filament | , km s-1 | , km s-1 | , km s-1 | |||
|---|---|---|---|---|---|---|
| I | 58 | 0.05078 | 0.04906 | |||
| II | 83 | 0.06107 | 0.06037 | |||
| III | 57 | 0.07098 | 0.07181 |