BL Lac contribution to the extragalactic gamma-ray background
Very high energy gamma-rays from blazars traversing cosmological distances through the metagalactic radiation field can convert into electron-positron pairs in photon-photon collisions. The converted gamma-rays initiate electromagnetic cascades driven by inverse-Compton scattering off the microwave background photons. Using a model for the time-dependent metagalactic radiation field consistent with all currently available far-infrared-to-optical data, we calculate the cascade contribution from faint, unresolved high- and low-peaked blazars to the extragalactic gamma-ray background as measured by EGRET. For low-peaked blazars, we adopt a spectral index consistent with the mean spectral index of EGRET detected blazars, and the EGRET luminosity function. For high-peaked blazars, we adopt template spectra matching prototype sources observed with air-Cherenkov telescopes up to 30 TeV, and a luminosity function based on X-ray measurements. The low number of for nearby high-peaked blazars with a flux exceeding above 300 GeV inferred from the luminosity function is consistent with the results from air-Cherenkov telescope observations. Including the cascade emission from higher redshifts, the total high-peaked blazar contribution to the observed gamma-ray background at GeV energies can account for .
Key Words.:
galaxies: BL Lacertae objects: general - galaxies: BL Lacertae objects: individual: Mkn501, 1ES1959+650, Mkn421, PKS2005-489, PKS2155-304 - cosmology: diffuse radiation - gamma rays: observations1 Introduction
Isotropic, diffuse background radiation presumably due to faint, unresolved extragalactic sources has been observed in nearly all energy bands. The confirmation of an extragalactic gamma-ray background by EGRET (Energetic Gamma-Ray Experiment Telescope) on board the Compton Gamma Ray Observatory has extended the spectrum up to an energy of 50 GeV. A first analysis of the data resulted in a total flux of photons cm-2 s-1 sr-1 above 100 MeV and a spectrum that could be fitted by a power law with an spectral index of (Sreekumar et al 1998). These values are strongly dependent on the foreground emission model which is subtracted from the observed intensity to obtain the extragalactic residual. Since, using the foreground model by Hunter et al (1997), a residual GeV halo remained after subtraction (in addition to the isotropic extragalactic background), the foreground model had to be improved. This led to a new analysis of the EGRET data, and a new result for the extragalactic background spectrum, now showing a dip at GeV energies and an overall weaker intensity of photons cm-2 s-1 sr-1 (Strong, Moskalenko & Reimer 2004). This new result can help us to understand the origin of the extragalactic background radiation.
Since EGRET detected a large number of extragalactic gamma-ray sources belonging to the blazar class of AGN, a reasonable assumption is that the gamma background is produced by unresolved AGN. Stecker & Salamon (1996) were able to explain 100% of the background by including the effect of variabiliy. But the resulting number of faint, nearby blazars was too low compared to the numbers detected by EGRET (Chiang & Mukherjee 1998). Using a gamma-ray luminosity function from EGRET data, Chiang & Mukherjee (1998) found that only 25% to 50% of the gamma-ray background could be explained by blazars. This result was questioned by Stecker (2001) who argued that a statistically independent analysis is contrary to his assumption of a correlated radio and gamma-ray emission and introduces a bias. Giommi et al. (2006) estimate the gamma-ray background contribution of blazars from deep blazar counts in the radio band, from multi-frequency surveys, and from interpolations of data using synchrotron-self-Compton models. They found that blazars possibly can contribute 100% in the MeV band. Since their calculation over-predicts the observations at energies ( MeV) by a large factor they conclude that the duty cycle of blazars must be rather low, and this is consistent with the results from long-term monitoring of TeV blazars such as Mrk421 or Mrk501. Due to the gap in sensitivity in the 100 keV to 100 MeV band, the spectral shape of blazars between medium energy gamma rays and high energy gamma rays is poorly constrained by observations.
Here extending the existing models we assume a population of BL Lacertae objects (BL Lac) with a spectral energy distribution such that their flux at EGRET energies is generally too low to be detected, while their very high energy gamma ray flux is strong. Most of these sources are at redshifts high enough for pair attenuation with the UV-IR metagalactic radiation field (MRF) to take place. A significant part of their VHE emission is reprocessed by inverse Compton cascades (Protheroe 1986, Maciolek-Niedzwiecki, Zdzarski & Coppi 1995, Protheroe & Stanev 1993). For a low extragalactic magnetic field strength ( G) the emission contributes to the source spectrum (Dai et al. 2002, Fan, Dai & Wei 2004). Assuming a much higher magnetic field of G the electrons and positrons become isotropized. The photons produce the so-called gamma-ray halo (Aharonian, Coppi & Völk 1994). The inverse Compton emission of blazars can contribute to the GeV gamma-ray background (Coppi & Aharonian 1997).
The paper is organized as follows: in the next section we present the set of equations used to calculate the gamma-ray background including the component from undetected sources and, assuming no extragalactic magnetic field, from cascade emission. In Sections 3 and 4 we give the choice of parameters for two populations of AGN, the undetected EGRET blazars and high peaked BL Lacs. The results are shown in Section 5, followed by a discussion in Section 6.
In this paper we use a Hubble constant of km s-1 Mpc-1 and a flat Universe with the cosmological parameters =0.3 and =0.7.
2 Gamma-ray background
The emission in units of [GeV-1 cm-2 s-1 sr-1] of a population of unresolved gamma-ray sources to the extragalactic gamma-ray background can be described by
| (1) | |||||
with as the intrinsic gamma-ray flux and the cascade emission from a source at redshift , tacitly assuming that the cascade contributes at the redshift of the source which is the case for all pair creation optical depths . This assumption is valid for most of the absorbed spectra, which we assume to generically extend to 30 TeV, since the majority of sources at redshifts have above GeV. The cosmological volume element is , is the total luminosity of the weakest source, the luminosity function and is the normalization constant for a single source spectrum defined as a function of the total intrinsic luminosity
| (2) |
Here the limits and depend on the definition of the energy range of the luminosity used in the luminosity function.
2.1 Extragalactic gamma-ray absorption
The high energy photons ( 20 GeV) of cosmic gamma-ray sources undergo interactions with the UV-FIR metagalactic radiation field (MRF). Therefore gamma-ray photons are absorbed due to pair-production (Kneiske et al. 2004 and references therein).
We use a broken power-law for the intrinsic spectrum in the energy range from 100 MeV to 30 TeV
| (3) |
with for and for .
The two slopes and peak energy will be determined by the spectrum of the observed sources.
2.2 Cascade contribution
The following analytical approximation, similar to the one in Fan, Dai & Wei (2004), used to calculate the particle flux of a pair-cascade following the pair production process from a gamma-ray source at redshift . The cascade term in Eq. (1) accounts for the first generation of electrons produced in photon-photon pair production. Corrections for the second generation of electrons is negligible since the contribution is very small for the chosen gamma energy range. For all spectra we assume a maximum energy of 30 TeV, so the inverse Compton scattering takes place in the Thomson regime only. The choice of this energy limit is motivated by the highest energies observed in BL Lac spectra. Note that the effect of a higher maximum energy has been studied in Protheroe & Stanev (1993), and can generally be assumed to be weak for plausible spectral indices above 30 TeV. We ignore magnetic fields in the following calculations, although in a realistic scenario the cascade emission will likely be isotropized due to the deflections of the electrons and positrons by intergalactic magnetic fields. Taking magnetic fields into account, we would have to extend the luminosity function to include the unbeamed host sources of blazars, the radio galaxies. Their greater number density would compensate for the lower luminosity resulting from the absence of relativistic beaming. We can thus approximate the cascade component given by
| (4) |
| (5) |
with and . The isotropic photon density of the cosmic microwave background is a black body with a temperature of
| (6) |
In this calculation positrons will be treated as electrons. On average, each absorbed gamma-ray photon produces two electrons with an energy , since pair creation has no preferred direction in the center-of-mass frame. (Note that we use the index 1 to show that the gamma energy is different from the gamma energy in Eq. (4) and (5).) The electron spectrum as a function of the Lorenz factor for , and max is given by
| (7) |
For numerical reasons the time integral has been replaced by an inverse-Compton time-scale multiplication. A comparison between the result using Eq. (4)-(7) and a more exact calculation as in Protheroe & Stanev (1993) shows good agreement.
3 Undetected EGRET blazars
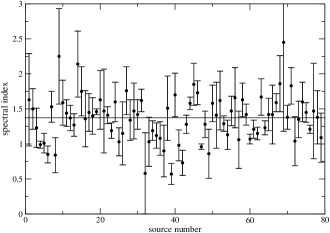
The luminosity function of resolved EGRET sources, extended to the faint end, has been computed by Chiang & Mukherjee (1998). We used their model changing only the spectral index from to . The new spectral index was determined by fitting the newly determined EGRET background spectrum at energies GeV. This choice is supported by averaging the spectral indices for detected blazars from the 3rd EGRET catalog (see Figure 1) which led to a mean spectral index of . We also included the cascade emission of the sources. Although the total intensity of the newly determined spectrum of the extragalactic background has become lower, the total contribution of this blazar population (consisting mainly of flat-spectrum radio quasars) to the extragalactic background in the energy range 100 MeV20 GeV amounts to about 60%.
4 High peaked BL Lacs
The remaining excess of the measured gamma-ray background could be produced by the cascade emission of high-energy peaked or X-ray blazars belonging to the HBL (XBL) class (def. for HBL see e.g. Ghisellini et al 1998). To test this idea we adopt an average HBL spectrum and a TeV-luminosity function obtained from X-ray properties.
4.1 Template spectra
A number of extragalactic gamma-ray sources have been detected with imaging air-Cherenkov telescopes (e.g., Wei 2006). Some of them were bright enough to resolve their spectra in the TeV energy band. At first glance the spectral energy distributions show a variety of shapes. However, by calculating their intrinsic spectra taking the extragalactic absorption into account, the spectra in the source frames are consistent with a remarkably similar shape which can well be approximated with a broken power-law. The spectral index above the peak is close to (cf. Mannheim 1998), while it is much flatter below the peak ( in order to remain below the EGRET limits).
In order to assess the background contribution from cascading, it is important to constrain as much as possible the template spectra and the metagalactic radiation field from observations. Since the cascade emission depends on the maximum energy and spectral index (Protheroe & Stanev 1993), we try to adopt realistic templates for the spectra obtained from observations. The total flux of the cascade emission also depends on the photon density of the MRF for which we will use models differing within the observational uncertainties.
We construct a template gamma-ray spectrum for Eq. 3 by fitting a broken power-law model to the data from detected BL Lacs. For a set of data points with flux of a source at redshift and an optical depth for gamma-rays in the Universe (10 GeV 100 TeV) the flux from the same source located at any given redshift is
| (8) |
To test the influence of different, but realistic templates and the metagalactic radiation field (MRF) we will discuss four different cases:
-
1.
A template obtained from observations of Mkn501 and 1ES1959+650 and a high MRF model. These are standard sources with similar slopes around the peak energy.
-
2.
A template obtained from observations of Mkn501 and 1ES1959+650 and a low MRF model, to test the uncertainty of the MRF.
-
3.
A template obtained from observations of Mkn421, PKS2005-489, PKS2155-304 and a high MRF model. These sources show a steeper decline at higher energies, which could be a sign of intrinsic absorption.
-
4.
A template obtained from observations of H1426+428 and a high MRF model, to show the effect of an extremely high value for the peak energy.
| model | [TeV] | ||
|---|---|---|---|
| 1 | 3.0 | 1.7 | 2.3 |
| 2 | 2.3 | 1.7 | 2.8 |
| 3 | 0.6 | 1.7 | 2.5 |
| 4 | 10.0 | 1.2 | 2.0 |
The parameters of the HBL templates are the two spectral indices and the location of the maximum (the normalization is obtained from the luminosity function, see below). The numbers in Table 1 are the result of fits of the intrinsic spectral energy distribution that have been calculated using Eq. (8) and the MRF model presented in Kneiske et al. (2002, 2004).
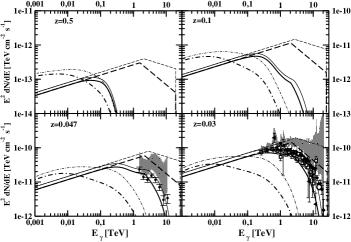
For the high MRF we have assumed the ”high-UV” model including the ”warm-dust” component. The low MRF is the ”low-IR” model without any UV emission. The cascade emission from an average HBL is then given by Eq. (4)-(7). The results can be seen in Fig. 2 and Fig. 3.
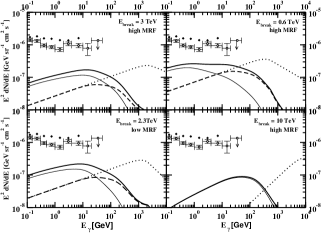
In Fig. 2 the intrinsic spectra (dashed lines), the absorbed spectra (solid lines) and the cascade emission (dot-dashed lines) are plotted for a source of case 1 (thin lines) and case 2 (thick lines). The four different panels show the change in the average spectrum if the HBL is located at different redshifts. Due to the increasing distance the flux is smaller and the extragalactic absorption higher. For comparison the data and allowed regions for the intrinsic spectra of Mkn501 are shown in the lower right panel at a redshift and for 1ES1995+650 in the lower left panel at a redshift .
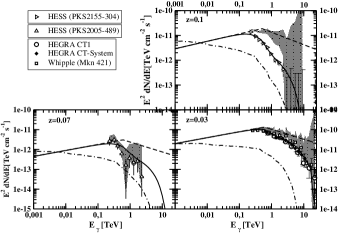
In Fig. 3 the same is plotted as in Fig. 2 except for a source of case 3. The data and allowed regions for the intrinsic spectra are taken from Mkn421, PKS2005-489 and PKS2155-304 and plotted in the panel depending on their redshift range. Within the uncertainties of the data all sources in the same figure can be fitted roughly with the same template.
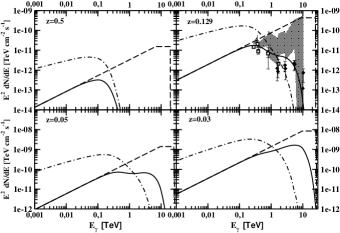
The location of the peak energy in the synchrotron spectrum of blazars apparently varies across a wide range from the near-infrared (LBLs) to X-rays (HBLs), although thermal emission from heated dust and starlight as well as photoelectric absorption in the EUV and soft X-rays hampers an unbiased measurement of the non-thermal spectrum. Blazars such as H1426+428 seem to exhibit, at least occasionally, a peak energy beyond keV, and a gamma-ray peak beyond TeV when accounting for extragalactic absorption (Costamante et al. 2001 and 2003, Kneiske et al. 2004). In Fig. 4 we show the effects of cascading on such a spectral energy distribution (SED), adopting =10 TeV, and . The duty cycle of the extreme behavior is unknown, and we consider a sizeable contribution of such extreme BL Lacs as rather speculative. In Fig. 4 the same is plotted as in Fig. 2 except for a source of case 4 and data of H1426+428 at a redshift of .
4.2 TeV-luminosity function
The luminosity function at gamma-ray energies (TeV-LF) of HBL is poorly known, since there has not been a complete survey, and the number of known sources is still rather low. We construct a LF based on the somewhat better known X-ray properties of HBLs. Bade et al. (1998) and Laurent-Mühleisen et al. (1999) obtained a luminosity function based on the samples from the ROSAT All Sky Survey, Rector et al. (2000) and Caccianiga et al. (2002) used samples from the Einstein Medium Sensitivity Survey and the Radio Emitting X-ray Sources catalog. For this study, we used the LF of Beckmann et al. (2003) who combined all the available data and derived a LF for BL Lacs. To obtain the TeV-LF we assume the luminosity between 0.5 keV to 2 keV equals the gamma-ray luminosity above 0.3 TeV . This assumption is based on the statistics from 246 sources using an SSC model and relations from blazar observations (Costamante & Ghisellini 2002). A minimum, maximum and break luminosity of erg s-1, erg s-1 and erg s-1 respectively is used.
5 Results
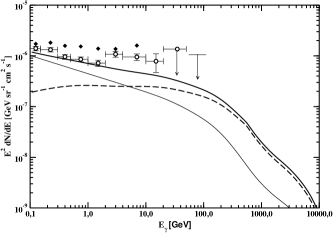
The contribution of the HBL component for all 4 cases is shown in Fig. 5. Without the effect of absorption and the resulting cascade emission the contribution to the background would be small. The cascade emission enhances the background intensity by up to an order of magnitude in the EGRET energy range. HBL can thus contribute 7%, 11%, 19% or 1% to the gamma-ray background in the energy range 100 MeV20 GeV for case 1 to case 4 respectively.
For comparison, the contribution from EGRET blazars (LBL, FSRQ) is shown together with the result for case 3 in Fig. 6. Due to the new spectral index, the change of cosmological parameters, the additional cascade emission and the reanalyzed EGRET data, the unresolved EGRET blazars now produce % of the background intensity. Comparing the total intensity as a sum of the two contributions (thick solid line) and the EGRET data, the agreement is acceptable at energies below 2 GeV but is too small above this energy.
Using
| (9) |
and
| (10) |
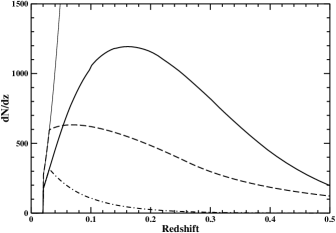
we can check the number counts of HBLs above 300 GeV which could be observed above a flux limit of cm-2 s-1 according to our choice of the LF with and without extragalactic absorption (see dot-dashed and dashed line in Fig. 7, for case 1). The total population consists of about HBLs for (thin-solid line). We obtain 23, 24, 30 or 22 sources at redshifts for case 1 to case 4 respectively. The peak redshift of the observed sources would be . The results are slightly higher than the number counts obtained from HBL observations with HEGRA and Whipple. However we did not include the change of flux limit due to different zenith angles or other observational based effects. The number of detectable sources with the new Cherenkov telescopes (MAGIC, H.E.S.S., Veritas, Cangaroo) should increase by a factor of 10 observing at lower energy and in both hemispheres, which is in agreement with the 100 HBL from integration of the X-ray luminosity function within one Gpc. From Fig.7 it is clear that independent of the telescope parameters the maximum number of sources will be detected at a redshift of (thick solid line).
6 Discussion
The EGRET extragalactic gamma-ray background data may be affected by large systematic errors. They are strongly dependent on the galactic foreground emission, which must be subtracted from the measured signal. Improvements in the modeling of the foreground emission were the reason for the new determination of the extragalactic background by Strong, Moskalenko & Reimer (2004). Recently, large amounts of gas, possibly connected with the Gould Belt, which are not accounted for in existing HI and CO surveys, have been found using infrared and gamma-ray observations. This implies severe revisions of the gamma-ray interstellar emission models to high latitudes. Grenier, Casandijan &Terrier (2005) obtained a new estimate of the extragalactic gamma-ray background including this newly found interstellar matter.
The largest uncertainties in determining the blazar contribution to the extragalactic background are their unknown SED and LF where only coarse estimates could be derived. In particular, at the low luminosity end of the LF, blazars could hide inside elliptical galaxies. At the present stage, the shape of the intrinsic spectra of blazars, as well as the number of blazars, seem to suffice to produce most of the background from faint, unresolved sources. This has also been discussed in Giommi et al. (2006). They have used 5 GHz radio number counts and a SSC model to calculate the contribution of blazars to the CMB, X-ray and gamma-ray background. They extrapolate the number counts to very low fluxes below 1 Jansky. As a result they found that the high energy gamma-ray background is overproduced by blazars if their SED shows an all-time high-energy gamma-ray bump. It is not clear if all faint radio sources which are included in their sample are producing gamma-rays and including these sources could lead to an overestimate of the background flux at gamma-ray energies. A more accurate treatment could start from generalizing the known correlations between X-ray/gamma-ray peak and luminosity for a single, luminosity-dependent template using leptonic and hadronic models. It is not clear whether accelerated electrons or hadrons (or both) are responsible for the gamma-ray emission. Both models can reproduce the multi-wavelength data equally well, since not enough simultaneous data are available (Aharonian et al. 2005). Therefore we have used simple power-laws for the spectral energy distribution. Recent observations at GeV and TeV energies have also shown flares in blazars which are only bright in gamma-rays. These so-called orphan flares have to be explained by more complex models (Reimer, Böttcher & Postnikov 2005). To obtain more precise blazar SED templates, detailed modeling of single sources with leptonic and hadronic models are needed, which will be possible if more simultaneous data from multi-wavelength campaigns are available. Number counts of HBLs found with IACTs will also be crucial to test the assumed LF and templates.
Blazars show variability across a wide band of time scales, from minutes to years, and estimates of their contribution to the extragalactic background must take into account selection effects due to the excess of flaring sources among detected sources found in incomplete surveys, and on the shape of the SED. Since the duty cycle of flares seems to be rather small, we have ignored such selection effects in this work.
Another source of uncertainty in the above calculations is the strength of the magnetic fields in the blazar host galaxies, in clusters of galaxies, and in intergalactic space. The magnetic field strength in the Coma cluster of galaxies has been measured to be (1.70.9) G (see Kronberg 1994 for a review). The cluster magnetic field seems to be correlated also with larger filaments of the matter concentration in the Universe. Using rotation measurements of radio sources Ryu, Kang & Biermann (1998) could show that the magnetic fields in these regions could be as strong as G. For the gamma-ray templates considered in this work, the mean free path takes values between a few hundred Megaparsec and some Gigaparsecs, enough to assure that the gamma-rays escape freely from the intracluster medium before pair production occurs. In general, they would then enter void regions, unless the jet directions are correlated with the supergalactic filament orientation. The magnetic field in void regions is not well known, but it seems that it drops to G or less (Lee, Olinto& Sigl 1995). Detailed cascade simulations and observations of gamma-ray halos can help to set limits on the extragalactic magnetic field. Aharonian et al. (2001) found no sign of a halo in Mkn501 in its quiescent phase. This would lead to much smaller magnetic fields like G. The calculations presented above were made assuming no magnetic field. The effects of weak magnetic fields (G) on cascade emission in Mkn501 and H1426+428 are discussed in Dai et al. (2002) and Fan, Dai & Wei (2004), respectively. For Mkn501 magnetic fields up to G have almost no influence on the cascade emission at energies above 100 MeV. A magnetic field of G reduces the flux by almost one order of magnitude at 100 MeV. Comparing this result with the calculations of H1426+428 the effect seems to depend strongly on the intrinsic spectrum and redshift of the BL Lac. Therefore an estimate for the gamma-ray background seems only possible by an exact simulation including the extragalactic magnetic field as a parameter. This will be done in future work.
Stronger magnetic fields ( G) would lower the cascade flux from the blazars emitting beamed radiation by about a factor of hundred. However, the correspondingly larger number of blazar host galaxies (radio galaxies) would then come into play to compensate for the loss in flux per source.
An analysis by Gorbunov et al. (2005) suggested a very weak correlation between the diffuse photons above 10 GeV detected by EGRET and some BL Lacs (LBL and HBL). The low number of blazars to which the photons can be traced back might indicate a greater value of the intergalactic magnetic field strength, sufficient to isotropize the cascade emission.
The hard feature in the background spectrum at a few GeV might also indicate other emission components, with less broad continuum radiation. It has been suggested that neutralino annihilation in clumpy dark matter halos might naturally give rise to this bump (Elsässer and Mannheim 2005).
Stawarz, Kneiske & Kataoka (2005) studied another possible contribution from the parsec scale jets of Faranoff-Riley type I galaxies. The observed X-ray emission in the knots of the extended jets could result in an inverse Compton component at gamma-ray energies. But neither the direct emission nor the faint cascade emission will lead to a larger contribution than 1%. Using a consistent model where the TeV emission is produced in the inner core region and in the extended jets as well could increase the contribution of FR-I galaxies to the extragalactic gamma-ray background (for the case of M87, see Reimer, Protheroe & Donea 2004, Stawarz et al. 2005).
Based on the observational finding of an increasing number of HBLs detected above 100 GeV energies, and the inescapable effect of intergalactic cascading on their emission, we have shown that they can indirectly contribute a sizeable fraction of the extragalactic gamma-ray background below 100 GeV. Ongoing observations with IACTs (e.g., H.E.S.S., MAGIC, VERITAS) will allow one to probe the assumed source population at very high energies. Monitoring campaigns will be important to obtain the time-averaged flux emitted by the blazar population at gamma-ray energies, and to better understand the selection effects due to flaring sources. A significant increase in source statistics will be needed to test the assumed luminosity function.
7 Acknowledgments
This research was supported by the BMB+f under grant 05AM9MGA. We thank Ray Protheroe for helpful discussions and the anonymous referees for comments and suggestions.
References
- (1) Aharonian, F. A., Coppi, P. S. & Völk, H. J.1994, ApJ, 423, 5
- (2) Aharonian, F. A. et al. (H.E.S.S. Collaboration), 2001, A&A, 366, 746
- (3) Aharonian, F. A. et al. (H.E.S.S. Collaboration), 2005, A&A, 442, 895
- (4) Bade, N., Beckmann, V., Douglas, N. G., Barthel, P. D., Engels, D., Cordis, L., Nass, P. & Voges, W. 1998, A&A, 334, 459
- (5) Beckmann, V., Engels, D., Bade, N. & Wucknitz, O. 2003, A&A, 401, 927
- (6) Caccianiga, A., Maccacaro, T., Wolter, A., Della Ceca, R.& Gioia, I. M.2002, ApJ, 566, 181
- (7) Chiang, J. & Mukherjee, R. 1998, ApJ, 496, 752
- (8) Coppi, P.S. & Aharonian, F.A., ApJ, 487, L9
- (9) Costamante, L., Ghisellini, G., Giommi, P., Tagliaferri, G., Celotti, A., Chiaberge, M., Fossati, G., Maraschi, L., Tavecchio, F., Treves, A. & Wolter, A. 2001, A&A, 371, 512
- (10) Costamante, L. & Ghisellini, G. 2002, A&A, 384, 56
- (11) Costamante, L., Aharonian, F., Ghisellini, G. & Horns, D. 2003, NewAR, 47, 677
- (12) Dai, Z.G., Zhang, B., Gou, L.J., Meszaros & Waxman, E. 2002, ApJ, 580, 7
- (13) Elsässer, D & Mannheim, K. 2005, PhRvL, 94, 1302
- (14) Fan, Y.Z., Dai, Z.G.& Wei, D.M. 2004, A&A, 415, 483
- (15) Fossati, G., Maraschi, L., Celotti, A., Comastri, A. & Ghisellini, G. 1998, MNRAS, 299, 433
- (16) Giommi, P., Colafrancesco, S., Cavazzuti, E., Perri, M. & Pittori, C., 2006, A&A, 445, 843
- (17) Gorbunov, D. S., Tinyakov, P. G., Tkachev, I. I. & Troitsky, S. V.2005, MNRAS, 362, 30
- (18) Ghisellini, G., Celotti, A., Fossati, G., Maraschi, L., & Comastri, A. 1998, MNRAS, 301, 451
- (19) Grenier, I.A., Casandjian, J.M. & Terrier, R., 2005, 29th ICRC Proceedings, Pune, 4, 13
- (20) Hunter, S.D. et al. 1997, ApJ, 481, 205
- (21) Kneiske, T.M., Mannheim, K. & Hartmann, D. 2002, A&A, 386, 1
- (22) Kneiske, T.M., Bretz, T., Mannheim, K. & Hartmann, D. 2004, A&A, 413, 807
- (23) Kronberg, P.P. 1994, RPPh, 57, 325
- (24) Laurent-Mühleisen, S.A., Kollgaard, R. I., Feigelson, E. D., Brinkmann, W. & Siebert, J. 1999, ApJ, 525, 127
- (25) Lee, S., Olinto A.V. & Sigl, G. 1995, ApJ, 455, 21
- (26) Maciolek-Niedzwiecki, A., Zdziarski, A. A. & Coppi, P. S.1995, MNRAS, 276, 273
- (27) Mannheim, K., 1998, Science, 279, 684
- (28) Protheroe, R. J. 1986, MNRAS, 221, 769
- (29) Protheroe, R. J. & Stanev, T. 1993, MNRAS, 264, 191
- (30) Rector, T.A., Stocke, John T., Perlman, Eric S., Morris, Simon L. & Gioia, Isabella M. 2000, AJ, 120, 1626
- (31) Reimer, A., Protheroe, R.J. & Donea, A.-C. 2004, A&A, 419, 89
- (32) Reimer, A., Böttcher, M. & Postnikov, S. 2005 ApJ, 630, 186
- (33) Rybicki, G.B. & Lightman, A.P. , 1979, ”Radiative processes in astrophysics”, Wiley&Sons
- (34) Ryu, D., Kang, H. & Biermann, P.L. 2003, ASPC, 301, 327
- (35) Sreekumar, P. et al. 1998, ApJ, 494 523
- (36) Stawarz, L., Kneiske, T. M. & Kataoka, J., 2006, ApJ, 637, 693
- (37) Stawarz, L., Siemiginowska, A., Ostrowski, M. & Sikora, M. 2005, ApJ, 626, 120
- (38) Stecker, F. W. & Salamon, M.H. 1996, ApJ, 464, 600
- (39) Stecker, F. W. & Salamon, M.H. 2001, proc. ”Gamma 2001”, Baltimore, USA, astro-ph/0104368
- (40) Strong, A.W., Moskalenko I.V. & O. Reimer, O. 2004, ApJ, 613, 956
- (41) Wei, C. 2006, proc. of the Vulcano Workshop 2006 ”Frontier Objects in Astrophysics and Particle Physics”, F. Giovannelli & G. Mannocchi (eds.), Italian Physical Society, Editrice Compositori, Bologna, Italy.