SIM PlanetQuest Key Project Precursor Observations to Detect Gas Giant Planets Around Young Stars
Abstract
We present a review of precursor observing programs for the SIM PlanetQuest Key project devoted to detecting Jupiter mass planets around young stars. In order to ensure that the stars in the sample are free of various sources of astrometric noise that might impede the detection of planets, we have initiated programs to collect photometry, high contrast images, interferometric data and radial velocities for stars in both the Northern and Southern hemispheres. We have completed a high contrast imaging survey of target stars in Taurus and the Pleiades and found no definitive common proper motion companions within one arcsecond (140 AU) of the SIM targets. Our radial velocity surveys have shown that many of the target stars in Sco-Cen are fast rotators and a few stars in Taurus and the Pleiades may have sub-stellar companions. Interferometric data of a few stars in Taurus show no signs of stellar or sub-stellar companions with separations of 5 mas. The photometric survey suggests that approximately half of the stars initially selected for this program are variable to a degree (0.1 mag) that would degrade the astrometric accuracy achievable for that star. While the precursor programs are still a work in progress, we provide a comprehensive list of all targets ranked according to their viability as a result of the observations taken to date. By far, the observable that removes the most targets from the SIM-YSO program is photometric variability.
Subject headings:
astrometry — stars: pre-main sequence — extrasolar planets1. Introduction
The majority of the over 200 planets found to date have been detected using either radial velocity (RV) or transit studies in orbits ranging from less than 0.1 AU out to beyond 5 AU, with a wide range of eccentricities, and masses ranging from less than that of Uranus up to many times that of Jupiter (Butler et al. 2006). However, the host stars of these planets are mature main sequence stars which were chosen based on their having quiescent photospheres for the successful measurement of small Doppler velocities (10 m s-1). Similarly, stellar photospheres must be quiescent at the milli-magnitude level for transit detections since a Jupiter mass planet transiting a solar type star reduces the photometric signal by about 1.4%. Since young stars often have radial velocity fluctuations or rotationally broadened line widths of at least 500 m s-1 and brightness fluctuations of many percent, RV measurements accurate to 100 m s-1 or transit observations cannot be used to detect planets around young stars111A number of groups are attempting RV observations in the near-IR since at these wavelengths it may be possible to improve on these limits and find a few “hot Jupiters” within 0.1 AU. A few potentially planetary mass objects have been detected at 20-100 AU from young host stars (10 Myr) by direct, coronagraphic imaging, e.g 2MASSW J1207334-393254 (Chauvin et al. 2005) and GQ Lup (Neuhäuser et al. 2005). However, these companions are only inferred to be of planetary mass by comparison to uncertain evolutionary models that predict the brightness of “young Jupiters” as a function of mass and age (Wuchterl & Tscharnuter 2003; Baraffe et al. 2003; Burrows et al. 1997). Since dynamical determinations of mass are impossible for objects on such distant orbits, it is difficult to be sure that these are planets and not brown dwarfs. Nor is it even clear than the origin of these distant “young Jupiters” is due to same formation processes as planets found closer-in. Multiple fragmentation events (Boss 2001), rather than core accretion in a dense disk (Ida & Lin 2004), may be responsible for the formation of these distant objects. As a result of the selection biases of the radial velocity, transit and direct imaging techniques, we know little about the incidence of close-in planets around young stars, leaving us with many questions about the formation and evolution of gas giant planets.
Given the observational limitations and uncertainties that are inherent to radial velocity and direct imaging, micro-arcsecond astrometry is a feasible and direct method for estimating the masses of giant planets around stars in young clusters which lie at distances closer than 140 parsecs (Beichman et al. 2001). Equation (1) gives the astrometric amplitude, , in units appropriate to the search for planets around young stars:
where is the astrometric amplitude in as, is the distance to the star in parsecs, is the orbital semi-major axis of the planet in AU, , is the planet mass in Jupiter masses, and is the star s mass in solar masses. Thus, a Jupiter orbiting 5.2 AU away from a 0.8 star at the distance of youngest stellar associations (1-10 Myr) such as Taurus and Chamaeleon 140 pc away would produce an astrometric amplitude of 44 as. At the 25-50 pc distance of the nearest young stars (10-50 Myr) such as members of the Pic and TW Hya moving groups, the same system would have an astrometric amplitude in excess of 100 as. Moving a Jupiter into a 1 AU orbit would reduce the signal by a factor of 5.2, or 50 as for a star at 25 pc and 8 as for one in Taurus. Table 1 lists the star formation regions and young moving groups being included in the SIM-YSO survey, a SIM PlanetQuest key project aimed at detecting Jupiter-mass planets around young stars. Since SIM will be able to detect astrometric signals with a Single Measurement Accuracy (SMA) of 4 as (1) in a fairly quick “Narrow Angle (NA)” observation and 11 as in single “Wide Angle (WA)” observation, a search for gas giants falls well within SIM s capabilities for wide and narrow angle astrometry and forms the core of the SIM-YSO program. With SIM’s sensitivity it is reasonable to study stars brighter than R12 mag to a level such that the expected astrometric amplitude of 8 as for stars at 140 pc is detected with 2 confidence in each measurement. This astrometric accuracy is appropriate for detecting planets of unknown orbital parameters with a series of approximately 75-100 1-D measurements (Sozzetti et al. 2003; Catanzarite et al. 2006).
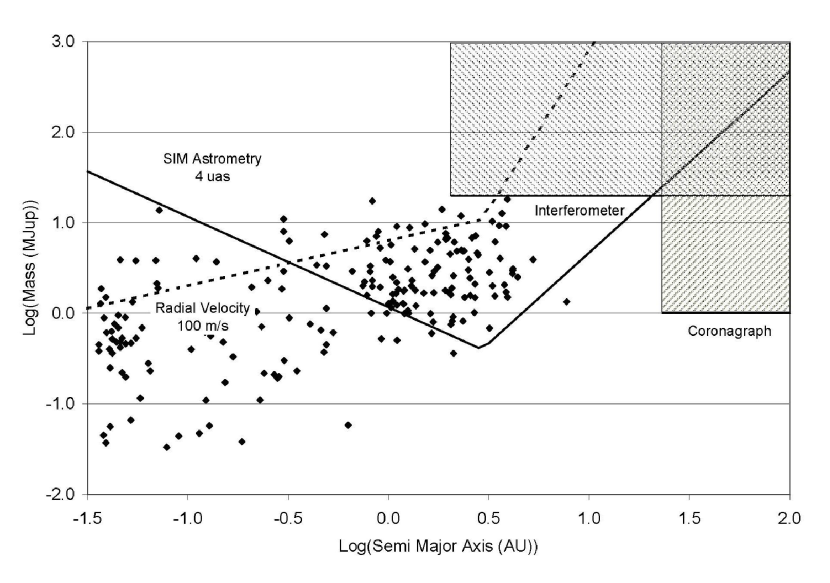
Figure 1 shows orbital location (semi-major axis) and Msin(i) for over 200 known planets orbiting nearby mature stars222Planet information from Schneider (2007). These planets were found using radial velocity measurements with noise levels as low as 1 m s-1. However, for the the young stars considered here, the radial velocity measurements will be limited, even in the near-infrared, to 100-500 m s-1 (or greater) due to rapid rotation, veiling, and photospheric variability. Thus, we plot a RV sensitivity curve for planets orbiting a 1 M☉ star assuming a limiting accuracy of 100 m s-1. For comparison, we plot the astrometric sensitivity curve for our SIM-YSO project where we demand that the minimum detectable planet have an amplitude twice the single measurement accuracy of 4 as. The curve is plotted for a 1 M☉ star located at the distance of Taurus (140 pc). For planets with periods greater than the nominal mission duration of 5 years, we have degraded the sensitivity as shown schematically in the plot. Finally, we estimate how a coronagraph on a 30-m telescope or an interferometer with an 85 m baseline, both operating at 1.6 m and reaching down to the Jovian mass range at orbital distances of 10 AU or greater would complement, but not replace, SIM observations.
In order to maximize the scientific yield of this SIM key project, a significant effort is required to gather information about the target stars prior to the launch of SIM. A careful vetting of the target list is required to reject stars that might be problematic due to the presence of starspots that might induce large astrometric offsets, to the presence of circumstellar emission from scattered light, or the presence of either visible and spectroscopic companions.
To ensure that we observe astrometrically stable systems, we have initiated a series of precursor observations to check for nearby infrared companions (3), radial velocity variations due to unseen companions (4), and photometric variability (5). Table 2 summarizes those precursor programs presently being conducted along with the telescope and the principal investigator. In subsequent sections we summarize the different programs and give detailed results from a number of them. The SIM-YSO target list will continue to evolve as we add new stars for their scientific interest and remove stars due to one failing or another. In the end, we intend to have a complete sample in both stellar age and mass that will allow for a statistically significant study of planets around young stars.
This paper describes the present status of the SIM-YSO sample, the overall strategy for the precursor vetting program, and detailed results of one specific program, the Palomar AO survey aimed at identifying companions to the SIM-YSO targets in the Pleiades and Taurus. We will summarize briefly the progress being made on our photometric and radial velocity surveys of both the Northern and Southern targets and their implications for the SIM-YSO target sample.
2. The SIM-YSO Stellar Sample of Young Stars
In a survey of 200 young stars we expect to find anywhere from 10-20 to 200 planetary systems depending on whether the 5-10% of stars with known radial velocity planets are representative of the younger planet population or whether all young stars have planets only to lose them to inward migration. The youngest stars in the sample (see Table 1) will be located in well known star-forming regions and will be observed in Narrow Angle mode which is capable of achieving single measurement accuracies of 4 as. Somewhat older stars, such as those in the Pictoris and TW Hydrae Associations, are only 25-50 pc away, and can be observed less expensively in Wide Angle mode capable of a single measurement accuracy of 11 as (Unwin 2005).
We have set our sensitivity threshold to ensure the detection of Jupiter-mass planets in the critical orbital range of 1 to 5 AU. These observations, when combined with the results of the SIM planetary searches of mature stars, will allow us to test theories of planetary formation and early solar system evolution. By searching for planets around pre-main sequence stars carefully selected to span an age range from 1 to 100 Myr, we will learn at what epoch and with what frequency giant planets are found at the water-ice “snowline” where they are expected to form (Pollack et al 1996). This will provide insight into the physical mechanisms by which planets form and migrate from their place of birth, as well as their survival rate. With these observations in hand, we will provide data, for the first time, on such important questions as: What processes affect the formation and dynamical evolution of planets? When and where do planets form? What is initial mass distribution of planetary systems around young stars? How might planets be destroyed? What is the origin of the eccentricity of planetary orbits? What is the origin of the apparent dearth of companion objects between planets and brown dwarfs seen in mature stars? How might the formation and migration of gas giant planets affect the formation of terrestrial planets?
Our observational strategy is a compromise between the desire to extend the planetary mass function as low as possible and the essential need to build up sufficient statistics on planetary occurrence. About half of the sample will be used to address the “where” and “when” of planet formation. We will study classical T Tauri stars (cTTs) which have massive accretion disks as well as post-accretion, weak-lined T Tauri stars (wTTs). Preliminary estimates suggest the sample will consist of 30% cTTs and 70% wTTs, driven in part by the difficulty of making accurate astrometric measurements toward objects with strong variability or prominent disks. The extent to which this distribution of cTTs and wTTs survives the screening programs for photometric and dynamic stability will be addressed in 6. The second half of the sample will be drawn from the closest, young clusters with ages starting around 5 Myr to the 10 Myr thought to mark the end of prominent disks, and ending around the 100 Myr age at which theory suggests that the properties of young planetary systems should become indistinguishable from those of mature stars. The properties of the planetary systems found around stars in these later age bins will be used to address the effects of dynamical evolution and planet destruction (Lin et al. 2001).
We have adopted the following criteria in developing our initial list of candidates: a) stellar mass between 0.2 and 2.0 M⊙; b) R mag for reasonable integration times; c) distance less than 140 pc to ensure an astrometric signal greater than 6 as; d) no companions within 2′′ or 100 AU for instrumental and scientific considerations, respectively; e) no nebulosity to confuse the astrometric measurements; f) variability 0.1 mag; and g) a spread of ages between 1 Myr and 100 Myr to encompass the expected time period of planet-disk and early planet-planet interactions. With proper selection, the effect of various astrophysical disturbances can be kept to less than the few as needed to detect Jupiter-mass planets at 50-140 pc.
The initial SIM-YSO sample (see Table 13) consists of stars in the well known star-forming regions and close associations. Figure 2 shows histograms of the properties of the stars in the sample including distance, V magnitude and age. The stars included in the initial sample have been screened for binarity in either imaging (Stauffer et al. 1998; Lowrance et al. 2005) or spectroscopic surveys (White & Ghez 2001; Mathieu et al. 1997; Steffen et al. 2001).
| Cluster | Age | Distance | # stars |
|---|---|---|---|
| [Myr] | [pc] | ||
| Beta Pic | 20 | 10-50 | 16 |
| Chameleon | 1-10 | 140 | 8 |
| Eta Cha | 4-7 | 100 | 2 |
| Horologium | 30 | 60 | 12 |
| IC2391 | 53 | 155 | 12 |
| Ophiuchus | 2 | 160 | 5 |
| Pleiades | 125 | 130 | 14 |
| TW Hydra | 10 | 60 | 15 |
| Taurus-Aureiga | 2 | 140 | 25 |
| Tucanae | 20 | 45 | 20 |
| Upper Sco | 1-10 | 145 | 49 |
| Sco Cen | 1-25 | 130 | 81 |
| Program | Telescope | PI |
|---|---|---|
| AO Imaging (North) | Palomar | Tanner |
| AO Imaging (South) | VLT | Dumas |
| Speckle Imaging (North) | Keck | Ghez/Konopacky |
| V2 (North) | Keck | Akeson |
| RV Survey (North) | McDonald | Prato |
| RV Survey (South) | CTIO/Magellan | Mohanty |
| Photometry (North) | Maidanak | Grankin |
| Photometry (South) | SMARTS | Simon |
3. High Contrast Direct Imaging
We begin by presenting the results of a companion survey to those SIM-YSO targets in our Taurus and Pleiades samples (see Table 3). Companions within the 15 field-of-view of the SIM interferometer which have magnitudes within V 4 (M. Shao, private comm.) could cause a bias in the position of the fringe used to make the astrometric measurements. Additionally, a massive, unknown stellar companion will induce astrometric perturbations complicating the astrometric solution for a planet around the primary star. To look for common proper motion companions to the SIM-YSO stars, we have conducted an adaptive optics (AO) coronagraphic imaging survey around 31 stars in the Taurus (2 Myr, 140 pc, Kenyon et al. 1994) and Pleiades (120 Myr, 135 pc, Stauffer et al. 1998; Pan et al. 2004) clusters with the PALAO adaptive optics system and its near-infrared camera, PHARO, on the Hale 200-inch telescope at Palomar (Hayward et al. 2001). These data will reveal the presence of stellar and brown dwarf companions located between 50 and 1000 AU, and, in the case of the youngest stars in these systems (2 Myr), will be sensitive to hot, young planets with masses in the range of 10-20 MJ (Burrows et al. 1997; Baraffe et al. 2003).
In the process of searching for unseen companions around these stars, we are also addressing planet formation issues. By investigating whether the “brown dwarf desert” observed for separations of 5 AU around main sequence stars (Marcy et al. 2000) also exists at larger separations for young stars, we can test whether brown dwarfs are formed at this separation and subsequently migrate inward and are destroyed by falling onto the star. In this case we might find that T-Tauri stars have a larger population of brown dwarfs than main sequence stars at these separations.
| Target | V | 2MASS Ks | SpTy | Age | Distance |
|---|---|---|---|---|---|
| [mag] | [mag] | [Myr] | [pc] | ||
| HII 1032 | 11.1 | 9.160.02 | G8 | 125 | 130 |
| HII 1095 | 11.92 | 9.670.02 | K0 | 125 | 130 |
| HII 1124 | 12.12 | 9.860.02 | K1 | 125 | 130 |
| HII 1136 | 12.02 | 12.140.02 | G8 | 125 | 130 |
| HII 1275 | 11.47 | 9.530.02 | G8 | 125 | 130 |
| HII 1309 | 9.58 | 8.280.02 | F6 | 125 | 130 |
| HII 1514 | 10.48 | 8.950.02 | G5 | 125 | 130 |
| HII 1613 | 9.87 | 8.570.02 | F8 | 125 | 130 |
| HII 1794 | 10.2 | 8.890.02 | F8 | 125 | 130 |
| HII 1797 | 10.09 | 15.040.11 | F9 | 125 | 130 |
| HII 1856 | 10.2 | 8.660.02 | F8 | 125 | 130 |
| HII 2366 | 11.53 | 9.550.02 | G2 | 125 | 130 |
| HII 430 | 11.4 | 9.470.02 | G8 | 125 | 130 |
| HII 489 | 10.38 | 8.870.02 | F8 | 125 | 130 |
| AA Tau | 12.82 | 8.050.02 | K7 | 2 | 140 |
| BP Tau | 11.96 | 7.740.02 | K7 | 2 | 140 |
| DL Tau | 13.55 | 7.960.02 | G | 2 | 140 |
| DM Tau | 13.78 | 9.520.02 | K5 | 2 | 140 |
| DN Tau | 12.53 | 8.020.02 | M0 | 2 | 140 |
| DQ Tau | 13.66 | 7.980.02 | M0 | 2 | 140 |
| DR Tau | 13.6 | 6.870.02 | K5 | 2 | 140 |
| GK Tau | 12.5 | 7.470.02 | K7 | 2 | 140 |
| IP Tau | 13.04 | 8.350.02 | M0 | 2 | 140 |
| IQ Tau | 14.5 | 7.780.02 | M0.5 | 2 | 140 |
| IW Tau | 12.51 | 8.280.03 | K7 | 2 | 140 |
| LkCa 19 | 10.85 | 8.150.02 | K0 | 2 | 140 |
| V1072 Tau | 10.3 | 8.300.02 | K1 | 2 | 140 |
| V830 Tau | 12.21 | 8.420.02 | K7 | 2 | 140 |
| V836 Tau | 13.13 | 8.600.02 | K7 | 2 | 140 |
3.1. Data Reduction and Analysis
The Palomar observations were obtained over three observing runs - Oct. 23, 2003; Dec. 4-6 2003; and Nov. 12-14 2005 - with good (02) to moderate (05) seeing throughout the nights. The PHARO/PALAO camera has a pixel scale of 25 mas pixel-1 and a field-of-view of 25 arcseconds. Each target was observed with the 097 diameter occulting spot placed over the star with integration times of 60 seconds each and multiple (10-20) images collected per target. Sky images were also taken adjacent to each set of target images by offsetting 30′′ from the target in the four cardinal directions. For flux calibration, observations of the target stars were taken with the star offset from the coronagraph in a five point dither pattern to allow for adequate sky subtraction. To improve observing efficiency, those stars with similar magnitudes and colors were paired together to act as each other’s point spread function. Two sets of known binary stars with high quality orbital solutions (WDC 09008+4148 and WDC 23052-0742) were also observed to provide an accurate determination of the plate scale and image orientation. During these observations, each binary was placed in multiple positions over the field of view of the camera.
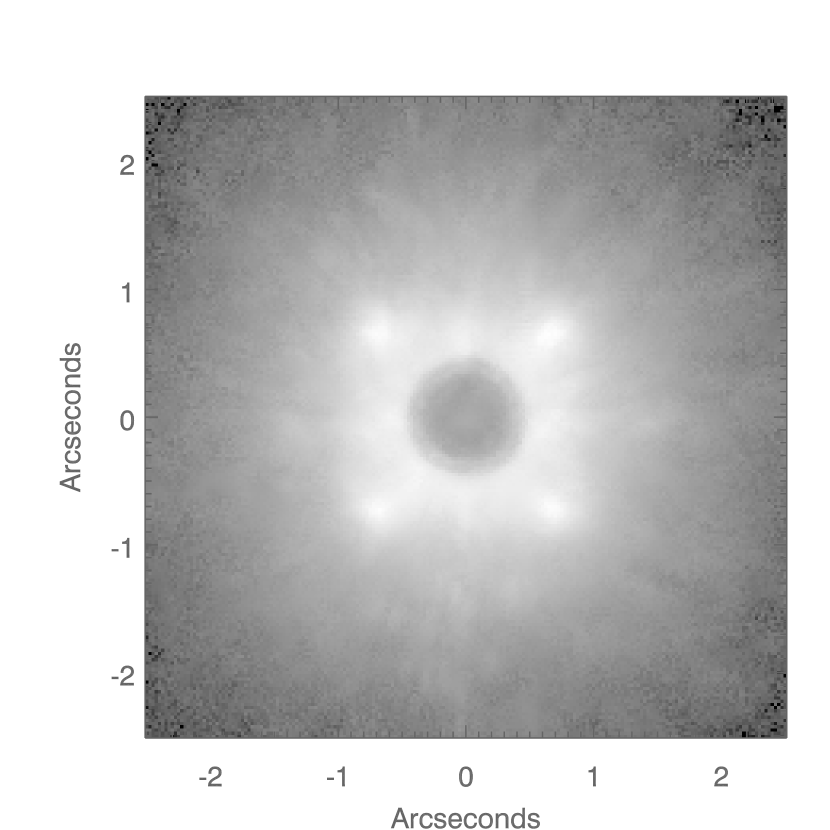
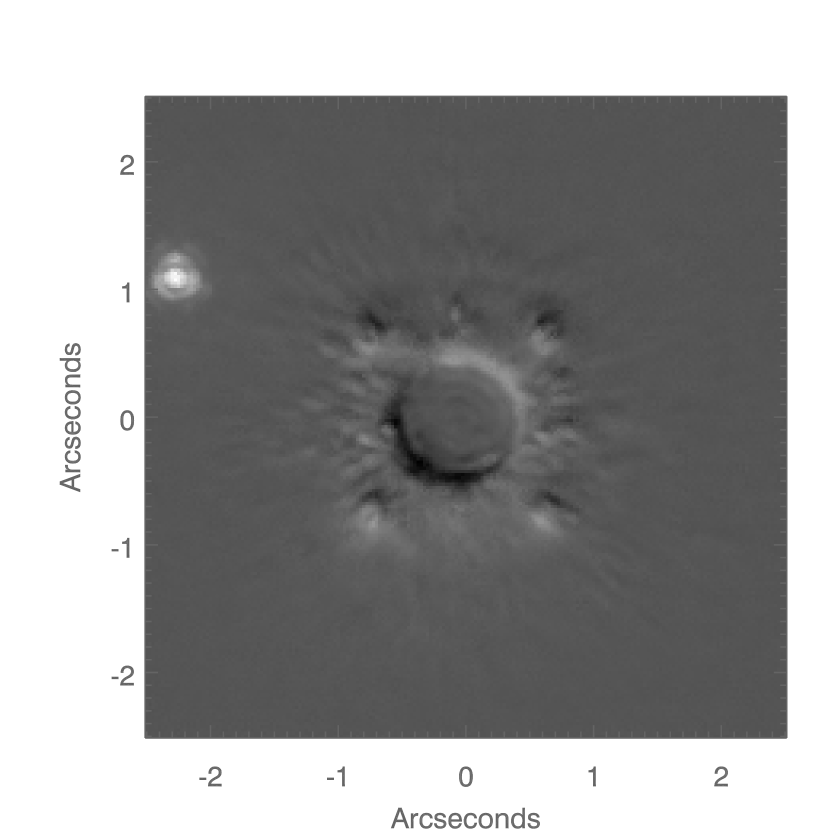
All the images were sky-subtracted, flat-fielded and corrected for bad-pixels. We utilized a number of methods for image registration prior to PSF subtraction. The best method involved using the centroid of either the waffle pattern or the “Poisson” spot (Metchev 2005). Using these methods we were able to achieve a registration accuracy of 2.3 and 0.7 pixels, respectively, which is comparable to the accuracy achieved in a similar survey using the same instrument (Metchev et al. 2004). After registration, the median of each image stack was calculated to produce the final image (see Figure 3). The images of those target stars with similar magnitudes and colors are paired and subtracted to produce a difference image intended to reduce the residual flux within one arcsecond of the coronagraphic spot. Prior to subtraction, each pair of images was scaled to have the same peak flux within the coronagraph halo to ensure a minimal residual flux after subtraction. Figure 4 shows the difference image of GK Tau and V830 Tau with a bright companion candidate next to GK Tau.
A thorough visual inspection of both the median-averaged, coronagraphic images and the difference images was performed to identify all potential companions. All visual companions identified in these images are listed in Table 4 along with their distance from the center of the coronagraph, position angle and magnitude difference compared to the target star. The coronagraphic images have been flux calibrated using the images taken with the primary star off-set from the coronagraph while accounting for a difference in integration time and the well-defined neutral density filter used for the off-spot images (Metchev et al. 2004). The magnitudes for both the primary stars in the off-spot images and the companions in the coronagraphic images are estimated from aperture photometry with an aperture of 09 and sky annulus of 11-14. The Ks band magnitudes of the primaries were taken from the Two Micron All-Sky Survey (Cutri et al. 2006). Since many of the target stars are variable in the optical, the near-infrared photometric calibration may be uncertain although these stars are typically 2-3 times less variable in the infrared than the visible (Eiroa et al. 2002).
3.2. Results
In Taurus and the Pleiades, 10 out of 16 of the targets (63%) and 5 out of 14 (36%), respectively, have visual companions within the 25′′ (1750 AU) field-of-view. Almost all of the companions lie 2 arcseconds away from the target corresponding to a distance greater than 300 AU. To estimate the sensitivities of our images as a function of distance from the star, we employ “PSF planting” in which a PSF corresponding to an object of known brightness is inserted into the image to determine whether it is detectable. A PSF extracted from the off-spot image of each target is sky subtracted, normalized, multiplied by an array of contrast values (=7.7-15.1 mags) and placed at a range (0-5′′) of distances from the target at random position angles. We completed 10,000 iterations of the PSF planting algorithm to fill out the parameter space of contrast and distance from the primary star. To determine whether the planted star is detected, the image is cross-correlated with a flux normalized PSF. The correlation values are binned according to the distance of the PSF from the star in increments of 01. For each distance bin we estimate the minimum PSF intensities which resulted in a correlation value of 0.9 or higher. The intensities are converted into magnitudes using the flux calibration from the off-spot image and the 2MASS Ks magnitude of the star. Figure 5 plots the largest Ks magnitude difference between the target star and planted PSF with a correlation of 0.9 as a function of distance from the star for all targets with calibration data. Table 6 lists the values of the faintest detectable Ks magnitudes at 0.5, 1, 2, 5 and 9 arcseconds. On average, we were able to detect sources with a magnitude contrast of = 4-7 mag at 2′′ and 8-10 at 5′′. The range of image contrasts is due primarily to variations in seeing conditions throughout the night since all the targets had similar magnitudes and integration times.
| Target | Separation | PA | Ks |
|---|---|---|---|
| [”] | [degrees] | [mag] | |
| HII 1032 | 12.7 | 45.0 | 16.0 |
| HII 1309 | 11.2 | -27.2 | 15.0 |
| HII 1309 | 12.1 | 108.8 | 15.2 |
| HII 1797 | 6.6 | -8.8 | 15.7 |
| HII 489 | 13.4 | 144.4 | 17.1 |
| AA Tau | 5.9 | 98.6 | 15.2 |
| BP Tau | 3.1 | -83.6 | 14.0 |
| BP Tau | 5.6 | 8.0 | 15.0 |
| DL Tau | 12.8 | 22.7 | 13.4 |
| DL Tau | 8.5 | 61.8 | 14.5 |
| DL Tau | 16.7 | 134.8 | 14.8 |
| DL Tau | 11.9 | 15.0 | 15.4 |
| DQ Tau | 7.3 | 149.6 | 15.3 |
| GI Tau | 8.3 | 1.7 | 14.6 |
| GK Tau | 2.4 | 62.1 | 12.1 |
| IP Tau | 3.7 | 124.3 | 15.1 |
| IQ Tau | 9.8 | 165.5 | 14.9 |
| IQ Tau | 13.9 | -64.6 | 15.3 |
| IQ Tau | 10.7 | -35.9 | 13.4 |
| IQ Tau | 10.2 | -33.9 | 13.6 |
| LkCa 19 | 4.3 | -77.4 | 16.2 |
| LkCa 19 | 11.8 | -36.2 | 13.9 |
| V830 Tau | 7.1 | -52.3 | 17.0 |
| V830 Tau | 11.2 | 58.3 | 15.8 |
| V830 Tau | 11.8 | 100.3 | 17.5 |
| V830 Tau | 7.8 | 146.1 | 17.7 |
Calibration binaries were used to estimate the plate scale of the PHARO camera. For the Oct 2004 data, we adopt a plate scale of 25.110.04 mas pixel-1 estimated from 3 different binary stars (WDS 09006+4147, WDS 18055+0230, WDS 20467+1607) that were observed very close to our observations using the same instrument (Oct 4-5, 2004, Metchev 2005). For the 2005 data we estimate a plate scale of 25.210.36 mas pixel-1 . This plate scale and its uncertainty comes from the average and standard deviation of the separation of one binary (WDS 09006+4147) placed in multiple positions across the field of view after correction for the known distortion in the camera.
To estimate the position of the occulted target star in these images, we use the waffle pattern inherent to every PSF (see Figure 3). Each waffle pattern consists of four points in a box pattern around the star. The center of the coronagraphic PSF is determined from the intersection of the two diagonal lines fitted to the centroid positions of the four peaks in the waffle pattern. Using this method, we are able to determine the position of the star to within 0.35 pixels estimated from the standard deviation of the stellar position in a stack of sub-frames. The positions of the companion candidates are estimated from their centroids and have errors of 0.5-1 pixels depending on the brightness of the companion, seeing conditions and telescope drift. The pixel positions for all primaries and their companions are corrected for the distortion determined for the PHARO camera (Metchev 2005). The errors in the stellar position and PHARO pixel scale are propagated into the error of the offsets of the companion candidates from their primaries.
Figure 6 plots the offset in RA and Dec of companion candidates to BP Tau, IP Tau, GK Tau, and LkCa 19. These four sources all have objects within at least 4.5 arcseconds (675 AU). While the probability of these companion candidates being background sources goes up with their separation from the target star, the discovery of a number of brown dwarf companions at wide separations (200 AU) makes these companion candidates worth investigating further. The crosses denote the positional offsets at the observing epochs of the Palomar data (2004, 2005) as well as data taken from Hubble Space Telescope (HST) WFPC2 and NICMOS data when available. The HST data was collected in 1999 as part of a program to detect faint debris disks (Krist et al. 2000) and therefore provides a long time baseline for the determination of common proper motion. In most cases, the target star in the WFPC2 data is saturated and the position of the star is estimated from the intersection of the diffraction spikes. The size of the crosses denote the 3 positional uncertainties (112 mas for the Palomar data and 13 mas for the WFPC2 data, J. Krist, private comm.) The curvy solid lines depict the changes in the offsets expected if the companion were a stationary, background object. The dotted lines represent the errors in the published proper motions (Frink et al. 1997). If the companions are associated with the target stars, the offsets would coincide with one another at all epochs since the objects would share the same space motions. Table 5 lists the reduced chi-squared values estimated from the positional data and uncertainties. Two hypotheses are tested - common proper motion and non-common proper motion. In the first scenario the is derived from the assumption that all the data points should lie on top of the first epoch (1999) data point. For the second scenario, the is derived from the assumption that the data points should lie on the vector produced by the change in the offset between the science target and stationary background star. The uncertainties for this case include both the positional uncertainties and the uncertainty in the proper motion of the T Tauri star (Frink et al. 1997). An unmodeled source of uncertainty that may inflate the s in the second scenario is the unknown proper motion of the companions. Based on this analysis, we conclude that there is evidence for common proper motion for the companion to GK Tau, evidence for non-common proper motion for the companion to BP Tau and ambiguous evidence for either scenario for IP Tau and LkCa19. These last two sources would benefit from more accurate positional data and a longer time baseline. If the GK Tau companion is truly a physical companion, then based on its Ks magnitude it would be roughly a M2-3 star with mass 0.5 M☉.
| Target | Reduced CommonPM | Reduced Non-commonPM |
|---|---|---|
| BP Tau | 26 | 2.5 |
| GK Tau | 1.4 | 4.1 |
| IP Tau | 4.2 | 4.4 |
| LkCa19 | 43 | 6.3 |
We have begun a similar high contrast imaging survey of the SIM-YSO targets in the Upper Sco subgroup of the Sco Cen association (1-2 Myr, 145 pc) using the NACO camera on the VLT. The NACO camera has been used to discover a number of low-mass companions including 2M1207 and GQ Lupi (Neuhäuser et al. 2005; Chauvin et al. 2005). It has a pixel scale of 27 mas pixel-1, a FOV of 28′′ with the potential of achieving sensitivities of Ks of 10 at 1′′ (Chauvin et al. 2004). So far, we have collected data on 20 targets with a number of them having companion candidates within one arcsecond. We will collect second epoch observations for these sources at a later date.
| Target | Tint [sec] | 05 | 1” | 2” | 5” | 9” |
|---|---|---|---|---|---|---|
| HII 1032 | 1200 | 12.84 | 13.55 | 15.91 | 18.01 | 18.17 |
| HII 1136 | 1200 | 14.26 | 14.99 | 16.74 | 17.86 | 17.65 |
| HII 1797 | 1200 | 12.17 | 12.04 | 14.53 | 17.19 | 17.28 |
| HII 1794 | 1200 | 12.18 | 12.53 | 14.70 | 17.78 | 17.87 |
| HII 489 | 1200 | 14.68 | 13.93 | 16.20 | 17.57 | 17.76 |
| AA Tau | 1200 | 13.31 | 11.44 | 15.20 | 17.16 | 17.36 |
| BP Tau | 1200 | 11.08 | 11.65 | 14.26 | 17.41 | 17.57 |
| CI Tau | 1200 | 12.02 | 12.10 | 13.68 | 17.67 | 17.67 |
| DL Tau | 1200 | 12.51 | 13.17 | 15.24 | 17.22 | 17.20 |
| DN Tau | 900 | 12.80 | 10.91 | 14.13 | 17.13 | 17.18 |
| DQ Tau | 1200 | 12.84 | 13.24 | 15.01 | 17.49 | 17.39 |
| GK Tau | 1200 | 11.58 | 11.22 | 12.90 | 16.94 | 17.15 |
| GI Tau | 1200 | 12.00 | 12.25 | 14.16 | 17.26 | 17.34 |
| IP Tau | 1200 | 13.86 | 13.00 | 15.78 | 17.04 | 17.11 |
| IQ Tau | 1200 | 12.27 | 13.18 | 14.93 | 16.82 | 16.93 |
| LkCa 19 | 900 | 12.46 | 12.55 | 14.93 | 17.97 | 18.22 |
| V830 Tau | 1200 | 13.59 | 14.85 | 17.09 | 20.15 | 20.36 |
3.3. Comparison to Other Surveys
There have been a few other ground AO and space-based surveys for low-mass companions to young stars (1-200 Myr) which have found a few brown dwarfs with separations between 75 to 1000 AU. These surveys had sample sizes ranging from 30-100 targets with two surveys finding 2-3 brown dwarfs when targeting stars in nearby associations (Metchev 2005; Lowrance et al. 2005) and one survey finding no brown dwarfs when targeting X-ray selected T-Tauri stars in the Chamaeleon and Sco-Cen OB associations (Brandner et al. 2000). Metchev (2005) has estimated a completeness corrected percentage of brown dwarfs at 73% (1 confidence) around F5-K5 stars with an age and separation range of 3-500 Myr and 30-1600 AU. Therefore our finding no very low-mass objects in a survey of 30 stars is consistent with previous programs given the stated uncertainties. Whether there is a significant dearth of brown dwarfs or planetary mass objects around young stars still requires a larger sample of targets with similar sensitivities to allow for a direct comparison of detection statistics.
Stellar multiplicity surveys of star formation regions such as Taurus and the Pleiades have revealed binary companion fractions of 60% (over 20-500 AU) and 30% (over 1-900 AU), respectively (Ghez et al. 1993; Bouvier et al. 1997). However, we used these and other surveys mentioned previously (see §2) to remove stars with stellar companions within two arcseconds in defining our initial sample. Thus it is not surprising that our survey did not add to the statistics for stellar multiplicity in these clusters.
3.4. Speckle Imaging and Additional AO imaging of the Taurus Sample
To complement the adaptive optics survey at Palomar, a number of the targets in the sample have been observed using high resolution imaging techniques at the Keck observatory. The purpose of this project was to look for companions at separations too close to be resolved with Palomar, and too wide to be detected via spectroscopic techniques. A summary of the results of this portion of the project is given in Table 8.
In total, seventeen objects in Taurus, TW Hydrae, or AB Doradus were surveyed at Keck. Three of these were imaged using speckle interferometry at K-band (2.2 ) on Keck I, and fourteen were observed using adaptive optics and K’ (2.3 ) or L’-band (3.5 ) on Keck II. The dates of these observations are given in Table 8, along with the total exposure time on each target. For details on the data reduction and analysis of both the speckle and the AO data taken at Keck, please see Konopacky et al (2007).
For all 17 sources, no companions were found to within 005. For each source we estimated our sensitivity to companions by finding the limiting detectable flux ratio with respect to the source as a function of radius, and then using the models of Baraffe et al. (1998; = 1.0) to convert these flux ratio limits into mass limits for the closest radius bin of 05. In general, the speckle measurements probe regions closer than 005 with much greater sensitivity than AO, but given the combination of the two techniques for this survey, we cut off our official completeness at 05. We plan to observe the remaining targets visible from the Northern hemisphere with either Keck AO or speckle imaging and are beginning a survey of the targets in the Southern hemisphere using Lucky imaging, a similar observational technique at optical wavelengths (Law et al. 2006).
4. Interferometric Observations of Stars in Taurus and the Pleiades
The Keck Interferometer (KI) was used to make near-infrared, long-baseline interferometry observations of three sources in the Pleiades and five sources in Taurus. These observations are part of a long-term program to study the multiplicity fraction of these sources. In particular, the interferometer is sensitive to companions within 30 mas of the primary star and with a K magnitude difference of 3 magnitudes or less.
The observations were taken on 10 November, 2006 with KI configured in the 5-channel, K band (2.18 microns central wavelength) mode described in Colavita et al. (2003). Calibrators were chosen to match the targets in K magnitude and were reduced with the standard parameters (Colavita et al 2003), including the ratio correction for imbalanced flux on the two paths of the interferometer. The calibrator sizes were all set to 0.1 0.05 mas diameter, but in all cases, the calibrator diameter did not contribute significantly to the final uncertainty. The primary KI data product is the normalized visibility amplitude squared, for which a value of 1 indicates an unresolved source. The uncertainty given is the quadrature combination of the scatter in the target measurement and the uncertainty in the system visibility (which is this case is dominated by the scatter in the calibrator measurements). Table 9 lists the targets, the numbers of integrations, the calibrated visibility and total uncertainty and the calibrators used for each target. The uncertainty varies due to the number of integrations and the difficulty in observing those sources with fainter V magnitudes.
All targets observed in this sample, except V830 Tau, are unresolved; i.e. consistent with a point source at this resolution. At the distance to Taurus or the Pleiades the central star will be unresolved (0.1 mas). Using the best uncertainties of 0.06, we can place limits on the size of the emission of 1.3 mas (1.8 AU) in diameter (3 ) for a uniform disk or on the presence of over-resolved (diffuse) emission within the 50 mas field-of-view of 10% (3 ). Additional observational epochs are needed to constrain the multiplicity. V830 Tau has visibilities estimated from earlier epochs of data (2003, 2004, Akeson et al. 2005) which differ from the expected value for an unresolved source by a few sigma (see Table 9). Future observations of this star with KI are planned to determine the nature of the resolved emission.
5. Radial Velocity Vetting
Some of the target stars will have stellar or sub-stellar companions that are not detectable by direct imaging (separations 50 AU). We are conducting a number of radial velocity (RV) surveys of potential SIM-YSO stars to determine whether the targets have unseen companions that might complicate the astrometric detection of planetary-mass objects. For example, a 20 MJ companion in a 1 year orbit around a 0.8 M☉ star has an RV amplitude of 660 m s-1. At 140 pc, this object would produce an astrometric signature of 160 as that would swamp the signal from any lower-mass planets. Located just a few milli-arcseconds from its parent star, the brown dwarf companion would be undetectable by direct, non-interferometric imaging. The goal of the RV program is to achieve accuracies on the order of 500 m s-1 over 3-4 years depending on the and photospheric instabilities of each star with the goal of getting limits on stellar and sub-stellar companions on orbits interior of 5 AU.
There are two radial velocity surveys presently being conducted on the SIM-YSO targets in both the Northern and Southern hemispheres. The Southern survey was begun in July 2003 using the echelle spectrograph (R=25,000) on the CTIO 4-m telescope (S. Mohanty, PI). All 42 of the targets in this survey were in the Sco-Cen association. Only one epoch of these targets have been collected to date because of the unfortunate retirement of this instrument on this telescope. Many of the stars in Sco-Cen turned out to be fast rotators (10 km s-1, see Table 7 and Figure 9) which is not surprising since, at 10-20 Myrs of age, there is ample time for the stars to spin-up due to stellar contraction.
The Northern survey began in October 2004, and used the coude echelle spectrograph (R=60,000) on the 2.7-m Harlan J. Smith telescope at McDonald Observatory (L. Prato, PI). Survey targets are located in the Pleiades cluster and in the Taurus star forming region. To date, 51 objects have been observed at multiple epochs with an RV precision of 140 m s-1. This survey makes use of simultaneous BVR photometry to search for correlations between rotation and RV periods, indicative of star spot modulation rather than the presence of a low-mass companion. Initial results which include a few targets with potential companions or signs of starspots will be presented in a forthcoming publication (Huerta et al. 2007; Huerta et al. 2005).
| Target | Vsin(i) | Target | Vsin(i) |
|---|---|---|---|
| [km s-1] | [km s-1] | ||
| TYC8648-446-1 | 10 | TYC8238-1462-1 | 25 |
| TYC8283-264-1 | 10 | TYC8654-1115-1 | 25 |
| TYC8282-516-1 | 13 | TYC8655-149-1 | 25 |
| TYC8645-1339-1 | 15 | TYC9245-617-1 | 25 |
| TYC9246-971-1 | 15 | TYC7833-2559-1 | 25 |
| TYC7796-1788-1 | 15 | TYC8295-1530-1 | 25 |
| TYC9244-814-1 | 15 | TYC7353-2640-1 | 25 |
| TYC7319-749-1 | 15 | TYC8636-2515-1 | 30 |
| TYC8317-551-1 | 15 | TYC8646-166-1 | 30 |
| TYC8242-1324-1 | 18 | TYC7310-2431-1 | 30 |
| TYC8249-52-1 | 18 | TYC8294-2230-1 | 30 |
| TYC8259-689-1 | 18 | TYC7824-1291-1 | 33 |
| TYC8297-1613-1 | 18 | TYC8652-1791-1 | 35 |
| TYC7848-1659-1 | 18 | TYC7852-51-1 | 40 |
| TYC8640-2515-1 | 20 | TYC8633-508-1 | 45 |
| TYC8644-340-1 | 20 | TYC8248-539-1 | 50 |
| TYC7811-2909-1 | 20 | TYC7333-1260-1 | 55 |
| TYC8667-283-1 | 23 | TYC7851-1-1 | 55 |
| TYC7822-158-1 | 23 | TYC7783-1908-1 | 63 |
| TYC9212-2011-1 | 25 | TYC8270-2015-1 | 65 |
6. Photometric Monitoring
The photospheric activity that affects radial velocity and transit measurements affects astrometric measurements as well, but, as we will now show, at levels consistent with the secure detection of gas giant planets with SIM. From measurements of photometric variability (Herbst et al. 1994; Bouvier & Bertout, 1989; Bouvier et al. 1995) plus Doppler imaging (Strassmeier & Rice 1998), T Tauri stars are known to have active photospheres with large starspots covering significant portions of their surfaces (Schussler et al. 1996), as well as hot spots due to infalling, accreting material (Mekkaden 1998). Day-to-day changes arise primarily because of rotation whereas month-to-month variations reflect changes in the spot sizes and their distribution across the surface. Long term monitoring is essential because different stars have different levels of magnetic activity, and these levels can change with time. These effects can produce large photometric variations which can significantly shift the photocenter of a star. In the simplest approximation, a completely black starspot, covering a small fraction, , of a stellar hemisphere, will shift the photocenter by an angle
where R⋆ is the stellar radius, D∗ is the distance to the star, and is the longitude of starspot relative to the line of sight. We have assumed that the spot is on the star’s equator and that the star is observed edge-on relative to its rotation axis. The shift in the photocenter, , will increase as the spot rotates away from a face-on longitude ( sin), following the rotation of the star as the spot shrinks in projected area ( cos) and eventually goes behind the star. Relative to the fractional change in stellar brightness, and averaging over , we get a root mean square (rms) dispersion in the location of the photocenter (the “astrometric jitter”) given by,
where is a geometric term of order 1.1. A more careful analysis takes into account the fact that the spots are not completely black, but rather emit with a temperature of 1,000 K cooler than the photosphere, are located over a range of typically high latitudes, and that an ensemble of stars will be observed at random angles to the line of sight. A Monte Carlo simulation shows a linear relationship like that of Eqn (3), but with a smaller coefficient:
For a typical T Tauri star radius of 3 in Taurus, we see that the astrometric jitter is less than 3 as for R-band variability less than or equal to 0.05 mag (1). Thus, the search for Jovian planets with astrometric amplitudes greater than 6 as is possible for stars less variable than about 0.05 mag in the visible even without a correction for jitter that may be possible using astrometric information at multiple wavelengths. Other astrophysical noise sources, such as offsets induced by the presence of nebulosity and stellar motions due to disk induced non-axisymmetric forces are negligible for appropriately selected stars. Finally, it is worth noting that searching for terrestrial planets will be difficult until stars reach an age such that their photometric variability falls well below 0.01 mag and the corresponding astrometric jitter below 1 as. Even then, color dependent astrometric corrections may be needed for the most sensitive measurements.
Since young stars have active photospheres it is important that we asses the degree of photospheric activity to determine the best targets for the program. The SIM-YSO team has two separate programs conducting photometric monitoring of the sample targets in the Northern and Southern hemispheres. The Southern targets are being observed in R band (0.9 ) at CTIO using the SMARTS (Small and Medium Aperture Research Telescope System) program (M. Simon, PI) which is comprised of small (0.9-1.5 meter) telescopes in the Southern Hemisphere. To date, they have observed 132 stars in the Sco-Cen and Upper-Sco associations. Figure 7 plots the R magnitudes of AA Tau and DN Tau taken with the SMARTS survey. The standard deviations of the photometry for these two sources is 0.17 and 1.5, respectively, making the latter source a problematic SIM-YSO target.
The Northern component of the SIM-YSO sample which includes stars in Taurus and the Pleiades has been monitored photometrically with small telescopes at the Maidanak Observatory (W. Herbst, PI; Grankin et al. 2007). Approximately ten data points are obtained on each star during each season to sample the range of the variability. The data are taken primarily in the B, V, and R bands, with a small amount taken in the U band. Forty-two stars are on the program and about 450 individual measurements have been obtained each season.
Out of those targets observed to date in both the Northern and Southern samples, 33% of them have photometric variability that produces astrometric noise greater than 3 as (or roughly 1 0.05 mag) in either the V or R band (see Table 15). Simultaneous monitoring of the variable stars both photometrically and with radial velocity measurements during the SIM observations might allow us to model the jitter and derive accurate astrometry. Those targets exhibiting significant amounts of photometric variability will be monitored further to asses whether they should remain in the target list or regulated to Wide Angle observations which will be sensitive to Jupiter mass planets further than one AU from the star.
7. Discussion
Through a series of precursor programs to observe all of the stars in the SIM-YSO target list it becomes clear that the observable affecting the viability of the targets the most is photometric variability. To date, 22% of the stars (33% of those stars observed) in the target list have variability which contributes more than 3 as of noise to the astrometric measurements. Table 13, which provides basic information on the entire SIM-YSO list, has been separated into “low variability”, “high variability” and “not observed” sections based on the degree of their variability and whether they have been observed to date. Each sublist is then ranked by the astrometric signal expected for a Jupiter mass planet at 1 AU from the stars which is listed under “Signal” in the table. To date, 67% of the sample has variability data with the remainder expected to be completed within the next year or two.
To replace those stars which might be lost to photometric variability, we will examine the literature for objects in other clusters or for newly classified T-Tauri stars. While many new young stars are being discovered in relatively nearby moving groups (i.e. Song et al. 2003), these typically have ages of 10-25 Myr. These stars can be observed inexpensively with SIM s Wide Angle mode and will probably not have problems of excessive variability. We will concentrate on finding bright enough replacement stars in the 1-5 Myr age range to avoid skewing our sample toward older stars.
7.1. Observing Scenarios and Reference Stars
While the nearer target stars (d50 pc) will have planetary astrometric signatures large enough to be detected by Wide Angle observations, more distant or more massive stars will have astrometric signatures on the order of 6 as requiring Narrow Angle observations. Narrow Angle observations require a set of at least three reference stars within the 1o5 field-of-view used for these observations. These reference stars must themselves be astrometrically stable to within 4 as. The best reference stars are K giants at distances 500 pc. There is an additional precursor program presently making photometric observations of the pool of reference stars available for every SIM-YSO target (or clusters of targets). When choosing the reference stars, we used a combined 2MASS-Tycho 2 catalog to select K giants based on visible-near IR colors as well as from reduced proper motions (RPM). The following selection criteria were also used to make the initial lists of reference stars: 1) separation from target 1.25 degrees, 2) 0.5 (J-Ks) 1.0, 3) 1.0 (BTycho-VTycho) 1.5, 4) VTycho 10, and 5) RPM = Ks + 5 log() 1. While some of the reference stars have published spectral types, many stars do not have any spectral type at all. We have begun a program of verification of the luminosity classes of the photometrically selected sample using the SMARTS telescopes.
Observing the stars in Narrow Angle mode requires roughly five times more integration time than doing so in Wide Angle mode, primarily due to the necessity of observing 3-5 reference stars. Putting together the final program will require a balance between observing fainter, more distant and young objects in Narrow Angle mode versus the brighter, closer, and older stars in Wide Angle mode.
8. Conclusions
We have presented the results for a number of precursor programs aimed at creating a robust list of young stars to be observed as part of a Key project for the SIM PlanetQuest mission. This program will detect Jupiter-mass planets at distances of 1-5 AU from the star, thereby probing planet formation at distances comparable to where radial velocity planets are found around mature, main-sequence stars. The imaging surveys did not find any stars with bright, nearby companions that could pose a problem for SIM; although we did find a potential M star companion 2′′.4 away from GK Tau. The radial velocity surveys may have found one or two stars with close-in companions. In the near future, the RV surveys will be supplemented with high spectral resolution RV surveys in the near-infrared. These observations are not as affected by the photometric variability of the star and are expected to achieve RMS accuracies of down to 100 m -1 thereby allowing for the detection of lower mass objects. One selection effect we will have to guard against is losing too many of the youngest stars due to large photometric variations. We will continue to supplement our target list with additional stars which meet our basic criteria as well as investigate ways to mitigate astrometic jitter using multi-wavelength data from SIM itself.
References
- (1)
- (2) Akeson, R. L., et al. 2005, ApJ, 635, 1173
- (3)
- (4) Baraffe, I., Chabrier, G., Barman, T. S., Allard, F., & Hauschildt, P. H. 2003, A&A, 402, 701
- (5)
- (6) Beichman, C. A. 2001 in Young Stars Near Earth: Progress and Prospects, ASP Conference Series Vol. 244. Edited by Ray Jayawardhana and Thomas Greene. San Francisco: Astronomical Society of the Pacific, p.376
- (7)
- (8) Boss, A. P. 2001, ApJ, 563, 367
- (9)
- (10) Bouvier, J., Rigaut, F., & Nadeau, D. 1997, A&A, 323, 139
- (11)
- (12) Bouvier, J., Covino, E., Kovo, O., Martin, E. L., Matthews, J. M., Terranegra, L., & Beck, S. C. 1995, A&A, 299, 89
- (13)
- (14) Bouvier, J., & Bertout, C. 1989, A&A, 211, 99
- (15)
- (16) Brandner, W., et al. 2000, AJ, 120, 950
- (17)
- (18) Burrows, A., et al. 1997, ApJ, 491, 856
- (19)
- (20) Butler, R. P., et al. 2006, ApJ, 646, 505
- (21)
- (22) Catanzarite, J., Shao, M., Tanner, A., Unwin, S., & Yu, J. 2006, PASP, 118, 1322
- (23)
- (24) Chauvin, G., et al. 2005, A&A, 438, L29
- (25)
- (26) Chauvin, G., Lagrange, A.-M., Dumas, C., Zuckerman, B., Mouillet, D., Song, I., Beuzit, J.-L., & Lowrance, P. 2004, A&A, 425, L29
- (27)
- (28) Colavita, M., et al. 2003, ApJ, 592, L83
- (29)
- (30) Cutri, R., et al., 2006, AJ, 31, 1163
- (31)
- (32) Eiroa, C., et al. 2002, A&A, 384, 1038
- (33)
- (34) Frink, S., Röser, S., Neuhäuser, R., & Sterzik, M. F. 1997, A&A, 325, 613
- (35)
- (36) Ghez, A. M., Neugebauer, G., & Matthews, K. 1993, AJ, 106, 2005
- (37)
- (38) Grankin, K. N., Melnikov, S. Y., Bouvier, J., Herbst, W., & Shevchenko, V. S. 2007, A&A, 461, 183
- (39)
- (40) Hayward, T. L., Brandl, B., Pirger, B., Blacken, C., Gull, G. E., Schoenwald, J., & Houck, J. R. 2001, PASP, 113, 105
- (41)
- (42) Herbst, W., Herbst, D. K., Grossman, E. J., & Weinstein, D. 1994, AJ, 108, 1906
- (43)
- (44) Huerta, M., et al. 2007, ApJ, in prep
- (45)
- (46) Huerta, M., Prato, L., Hartigan, P., Johns-Krull, C. M., & Jaffe, D. 2005, Bulletin of the American Astronomical Society, 37, 1267
- (47)
- (48) Kenyon, S. J., Dobrzycka, D., & Hartmann, L. 1994, AJ, 108, 1872
- (49)
- (50) Konopacky, Q. M., Ghez, A. M., Rice, E. L., & Duchene, G. 2007, ArXiv Astrophysics e-prints, arXiv:astro-ph/0703567
- (51)
- (52) Krist, J. E., Stapelfeldt, K. R., Ménard, F., Padgett, D. L., & Burrows, C. J. 2000, ApJ, 538, 793
- (53)
- (54) Ida, S., & Lin, D. N. C. 2004, ApJ, 616, 567
- (55)
- (56) Law, N. M., Hodgkin, S. T., & Mackay, C. D. 2006, MNRAS, 368, 1917
- (57)
- (58) Lin, D. 2001, ASP Conf. Ser. 245: Astrophysical Ages and Times Scales, 245, 90
- (59)
- (60) Lowrance, P. J., et al. 2005, AJ, 130, 1845
- (61)
- (62) Marcy, G. W., & Butler, R. P. 2000, PASP, 112, 137
- (63)
- (64) Mathieu, R. D., Stassun, K., Basri, G., Jensen, E. L. N., Johns-Krull, C. M., Valenti, J. A., & Hartmann, L. W. 1997, AJ, 113, 1841
- (65)
- (66) Mekkaden, M. V. 1998, A&A, 340, 135
- (67)
- (68) Metchev, S., 2005, PhD Thesis, California Institute of Technology
- (69)
- (70) Metchev, S. A., & Hillenbrand, L. A. 2004, ApJ, 617, 1330
- (71)
- (72) Neuhäuser, R., Guenther, E. W., Wuchterl, G., Mugrauer, M., Bedalov, A., & Hauschildt, P. H. 2005, A&A, 435, L13
- (73)
- (74) Pan, S., Shao, M., Kulkarni, S., 2004, Nature, 427, 326
- (75)
- (76) Preibisch, T., & Zinnecker, H. 1999, AJ, 117, 2381
- (77)
- (78) Pollack, J. B., Hubickyj, O., Bodenheimer, P., Lissauer, J. J., Podolak, M., & Greenzweig, Y. 1996, Icarus, 124, 62
- (79)
- (80) Schneider, J., 2007, http://exoplanet.eu/
- (81)
- (82) Schuessler, M., Caligari, P., Ferriz-Mas, A., Solanki, S. K., & Stix, M. 1996, A&A, 314, 503
- (83)
- (84) Song, I., Zuckerman, B., & Bessell, M. S. 2003, ApJ, 599, 342
- (85)
- (86) Sozzetti, A., Casertano, S., Brown, R. A., & Lattanzi, M. G. 2003, PASP, 115, 1072
- (87)
- (88) Stauffer, J. R., Schild, R., Barrado y Navascues, D., Backman, D. E., Angelova, A. M., Kirkpatrick, J. D., Hambly, N., & Vanzi, L. 1998, ApJ, 504, 805
- (89)
- (90) Steffen, A. T., et al. 2001, AJ, 122, 997
- (91)
- (92) Strassmeier, K. G., & Rice, J. B. 1998, A&A, 339, 497
- (93)
- (94) Unwin, S. C. 2005, Astrometry in the Age of the Next Generation of Large Telescopes, 338, 37
- (95)
- (96) White, R. J., & Ghez, A. M. 2001, ApJ, 556, 265
- (97)
- (98) Wuchterl, G., & Tscharnuter, W. M. 2003, A&A, 398, 1081
- (99)
| Object | Date | Method | Total Exp. | K Lim | K Lim | K Lim | Mass Lim | Band |
|---|---|---|---|---|---|---|---|---|
| Obs | (Sp or AO) | Int. Time [sec] | 005 | 01 | 05 | 005 [M☉] | ||
| TWA 23 | 2005 May 27 | Sp | 78.1 | 2.9 | 3.7 | 6.9 | 0.10 | K |
| TYC7660-0283 | 2005 May 27 | Sp | 78.1 | 3.9 | 4.1 | 6.5 | 0.08 | K |
| GM Tau | 1997 Oct 12 | Sp | 156.2 | 3.9 | 3.9 | 6.5 | 0.02 | K |
| Anon 1 | 2005 Dec 12 | AO | 120 | 3.8 | 4.4 | 6.2 | 0.06 | K |
| BP Tau | 2005 Dec 12 | AO | 120 | 5.5 | 4.3 | 6.2 | 0.03 | K |
| DG Tau | 2005 Dec 12 | AO | 120 | 5.8 | 3.5 | 5.9 | 0.02 | K |
| HD 283572 | 2005 Dec 12 | AO | 54.3 | 4.6 | 4.8 | 6.3 | 0.03 | K |
| IP Tau | 2005 Dec 12 | AO | 120 | 3.7 | 4.5 | 5.3 | 0.06 | K |
| IQ Tau | 2005 Dec 12 | AO | 120 | 5.0 | 4.7 | 5.9 | 0.03 | K |
| V1072 Tau | 2005 Dec 12 | AO | 120 | 5.1 | 5.5 | 6.5 | 0.03 | K |
| DN Tau | 2005 Dec 12 | AO | 120 | 4.7 | 5.1 | 6.2 | 0.03 | K |
| V830 Tau | 2005 Dec 12 | AO | 60 | 2.9 | 3.9 | 5.8 | 0.15 | K |
| DR Tau | 2005 Dec 12 | AO | 54.3 | 3.4 | 3.9 | 6.6 | 0.14 | K |
| HIP 113579 | 2005 Jul 16 | AO | 3.0 | 3.7 | 3.5 | 5.7 | 0.24 | L |
| HIP 113597 | 2005 Jul 16 | AO | 6.0 | 3.0 | 5.1 | 5.7 | 0.12 | L |
| HIP 114066 | 2005 Jul 16 | AO | 6.0 | 2.9 | 3.0 | 5.3 | 0.09 | L |
| HIP 115162 | 2005 Jul 16 | AO | 6.0 | 3.0 | 4.9 | 5.2 | 0.39 | L |
| Target | K mag | # ints | avg V2 | avg Sig | Calibrators |
|---|---|---|---|---|---|
| DN Tau | 8.0 | 1 | 1.02 | 0.09 | HD283444,HD283886 |
| V830 Taua | 8.4 | 1 | 0.85 | 0.10 | HD283668,HD282230,HD29334 |
| V830 Taub | 8.4 | 1 | 0.89 | 0.07 | HD283668,HD282230,HD29334 |
| V830 Tau | 8.4 | 1 | 1.08 | 0.13 | HD283444,HD283886 |
| V1171 Tau | 9.2 | 2 | 0.98 | 0.05 | HD24132,HD23289,HD284316 |
| V1072 Tau | 8.3 | 1 | 1.13 | 0.10 | HIP19757,HD285816 |
| V1075 Tau | 8.9 | 1 | 1.08 | 0.10 | HIP19757,HD285816 |
| HD 282973 | 8.6 | 2 | 0.97 | 0.06 | HD24132,HD23289,HD284316 |
| HD 282971 | 8.7 | 2 | 0.99 | 0.06 | HD24132,HD23289,HD284316 |
| HD 23584 | 8.3 | 2 | 0.98 | 0.06 | HD24132,HD23289,HD284316 |
| Name | Cluster | Distance | Spec | Age | Star Massa | Signal | T-Tauri | V | 2MASS Ks |
|---|---|---|---|---|---|---|---|---|---|
| [pc] | Type | [Myr] | [M☉] | [as] | Class | [mag] | [mag] | ||
| Low variability targets | |||||||||
| PreibZinn9964b | USco | 145 | M1 | 0.1 | 0.3 | 23.68 | … | 8.36 | |
| 51Eri | Beta Pic | 29.8 | F0V | 20 | 1.5 | 21.51 | … | 5.22 | 4.54 |
| PreibZinn9914 | USco | 145 | M0.5 | 0.5 | 0.3 | 19.50 | 9.09 | ||
| RECX10 | Eta Cha | 100 | K6 | 7 | 0.6 | 17.48 | WTT | 12.53 | 8.73 |
| PreibZinn9928 | USco | 145 | M0 | 1 | 0.4 | 15.79 | 8.80 | ||
| PreibZinn9913 | USco | 145 | M0 | 1.2 | 0.4 | 15.07 | … | 8.88 | |
| PreibZinn9919 | USco | 145 | K6 | 0.7 | 0.5 | 12.51 | … | 8.11 | |
| PreibZinn9974 | USco | 145 | K4 | 0.5 | 0.6 | 10.36 | … | 8.46 | |
| PreibZinn9936 | USco | 145 | K7 | 2.7 | 0.7 | 10.20 | 9.12 | ||
| PreibZinn9967 | USco | 145 | K5 | 1.1 | 0.7 | 10.05 | 8.56 | ||
| PreibZinn9969 | USco | 145 | K5 | 1.8 | 0.7 | 9.47 | … | 8.56 | |
| HII489 | Pleiades | 130 | F8 | 125 | … | 9.25 | … | 10.38 | 8.87 |
| HII1794 | Pleiades | 130 | F8 | 125 | … | 9.25 | … | 10.20 | 8.89 |
| HII2366 | Pleiades | 130 | G2 | 125 | … | 9.25 | … | 11.53 | 9.55 |
| TYC8283-2795-1 | Sco-Cen(UCL) | 130 | … | … | 9.25 | WTT | 10.79 | 8.98 | |
| PreibZinn9950 | USco | 145 | K5 | 2.5 | 0.8 | 8.84 | 8.90 | ||
| L1551-55 | Tau Aur | 140 | K7 | 2 | … | 8.59 | 13.22 | 9.31 | |
| PreibZinn9939 | USco | 145 | K4 | 2.2 | 0.8 | 8.29 | … | 8.73 | |
| HII1124 | Pleiades | 130 | K3V | 125 | 1.0 | 7.79 | … | 12.12 | 9.86 |
| PreibZinn9958 | USco | 145 | K2 | 1.2 | 0.9 | 7.62 | … | 8.43 | |
| HII1095 | Pleiades | 130 | K0V | 125 | 1.0 | 7.40 | … | 11.92 | 9.67 |
| HII1309 | Pleiades | 130 | F6V | 125 | 1.0 | 7.40 | … | 9.58 | 8.28 |
| HII1613 | Pleiades | 130 | F8V | 125 | 1.0 | 7.40 | … | 9.87 | 8.57 |
| HII1797 | Pleiades | 130 | F9V | 125 | 1.0 | 7.40 | … | 10.09 | 15.04 |
| HII1856 | Pleiades | 130 | F8V | 125 | 1.0 | 7.40 | … | 10.20 | 8.66 |
| TYC8654-1115-1 | Sco-Cen(LCC) | 130 | 24 | 1.0 | 7.40 | WTT | 10.21 | 8.13 | |
| TYC8295-1530-1 | Sco-Cen(UCL) | 130 | G5 | 21 | 1.0 | 7.40 | WTT | 10.98 | 8.90 |
| PreibZinn9945 | USco | 145 | K2 | 1.2 | 0.9 | 7.37 | … | 11.17 | 8.04 |
| HD141569 | none | 35 | B9.5e | 5 | 4.0 | 6.87 | … | 7.11 | 6.82 |
| TYC8667-283-1 | Sco-Cen(LCC) | 130 | G3/G5V | 23 | 1.1 | 6.72 | WTT | 9.31 | 7.62 |
| TYC7783-1908-1 | Sco-Cen(LCC) | 130 | G8IV: | 18 | 1.1 | 6.72 | WTT | 9.82 | 7.51 |
| TYC8258-1878-1 | Sco-Cen(LCC) | 130 | 15 | 1.1 | 6.72 | WTT | 10.62 | 8.27 | |
| TYC9244-814-1 | Sco-Cen(LCC) | 130 | G3/G5III | 22 | 1.1 | 6.72 | WTT | 10.21 | 8.40 |
| TYC8270-2015-1 | Sco-Cen(UCL) | 130 | 17 | 1.1 | 6.72 | WTT | 10.91 | 8.69 | |
| TYC7851-1-1 | Sco-Cen(UCL) | 130 | G9 | 17 | 1.1 | 6.72 | WTT | 10.63 | 8.36 |
| TYC7353-2640-1 | Sco-Cen(UCL) | 130 | 18 | 1.1 | 6.72 | WTT | 10.72 | 8.67 | |
| CHXR8 | Cham | 140 | G0 | 100 | 1.1 | 6.24 | WTT | 11.45 | 9.73 |
| HII430 | Pleiades | 130 | G8V | 125 | 1.2 | 6.16 | … | 11.40 | 9.47 |
| HII1032 | Pleiades | 130 | A2 | 125 | 1.2 | 6.16 | … | 11.10 | 9.16 |
| HII1136 | Pleiades | 130 | G7V | 125 | 1.2 | 6.16 | … | 12.02 | 12.14 |
| HII1275 | Pleiades | 130 | K0V | 125 | 1.2 | 6.16 | … | 11.47 | 9.53 |
| TYC8646-166-1 | Sco-Cen(LCC) | 130 | 11 | 1.2 | 6.16 | WTT | 10.50 | 8.18 | |
| TYC8636-2515-1 | Sco-Cen(LCC) | 130 | 11 | 1.2 | 6.16 | WTT | 10.58 | 8.12 | |
| TYC8633-508-1 | Sco-Cen(LCC) | 130 | K2IV:+ | 16 | 1.2 | 6.16 | WTT | 9.41 | 7.65 |
| TYC9245-617-1 | Sco-Cen(LCC) | 130 | 10 | 1.2 | 6.16 | WTT | 10.01 | 7.55 | |
| TYC8652-1791-1 | Sco-Cen(LCC) | 130 | F6/F7 | 16 | 1.2 | 6.16 | WTT | 10.35 | 8.48 |
| TYC8259-689-1 | Sco-Cen(LCC) | 130 | 14 | 1.2 | 6.16 | WTT | 10.48 | 8.10 | |
| TYC8248-539-1 | Sco-Cen(LCC) | 130 | G1/G2 | 26 | 1.2 | 6.16 | WTT | 10.10 | 8.54 |
| HD120411 | Sco-Cen(UCL) | 130 | G1V | 20 | 1.2 | 6.16 | WTT? | 9.79 | 8.16 |
| V1009Cen | Sco-Cen(UCL) | 130 | G8/K0V | 13 | 1.2 | 6.16 | WTT? | 10.18 | 7.95 |
| TYC7310-2431-1 | Sco-Cen(UCL) | 130 | G5 | 16 | 1.2 | 6.16 | WTT | 10.36 | 8.28 |
| TYC8297-1613-1 | Sco-Cen(UCL) | 130 | 17 | 1.2 | 6.16 | WTT | 10.22 | 8.51 | |
| TYC7822-158-1 | Sco-Cen(UCL) | 130 | K1 | 13 | 1.2 | 6.16 | WTT | 11.11 | 8.51 |
| TYC7848-1659-1 | Sco-Cen(UCL) | 130 | G5 | 15 | 1.2 | 6.16 | WTT | 10.36 | 8.21 |
| HD140421 | Sco-Cen(UCL) | 130 | G1V | 17 | 1.2 | 6.16 | WTT? | 9.46 | 7.87 |
| TYC8317-551-1 | Sco-Cen(UCL) | 130 | G0 | 13 | 1.2 | 6.16 | WTT | 10.29 | 8.27 |
| TYC7333-1260-1 | Sco-Cen(UCL) | 130 | G1/G2V | 18 | 1.2 | 6.16 | WTT | 9.58 | 8.07 |
| PreibZinn9922 | USco | 145 | G0 | 18 | 1.1 | 6.03 | 8.77 | ||
| TYC9231-1566-1 | Sco-Cen(LCC) | 130 | G3IV | 12 | 1.3 | 5.69 | WTT | 9.23 | 7.18 |
| TYC8263-2453-1 | Sco-Cen(UCL) | 130 | F8/G0V | 14 | 1.3 | 5.69 | WTT | 9.69 | 7.94 |
| TYC7813-224-1 | Sco-Cen(UCL) | 130 | 14 | 1.3 | 5.69 | WTT | 10.55 | 8.39 | |
| TYC8683-242-1 | Sco-Cen(UCL) | 130 | 8 | 1.3 | 5.69 | WTT | 10.80 | 8.30 | |
| TYC7828-2913-1 | Sco-Cen(UCL) | 130 | 5 | 1.3 | 5.69 | WTT | 11.02 | 8.29 | |
| TYC7310-503-1 | Sco-Cen(UCL) | 130 | K3 | 2 | 1.3 | 5.69 | WTT | 10.88 | 7.87 |
| TYC7845-1174-1 | Sco-Cen(UCL) | 130 | K1 | 3 | 1.3 | 5.69 | WTT | 10.61 | 7.93 |
| TYC7349-2191-1 | Sco-Cen(UCL) | 130 | 1 | 1.3 | 5.69 | WTT | 11.09 | 8.29 | |
| PreibZinn9975 | USco | 145 | G9 | 1 | 1.2 | 5.62 | … | 10.50 | 7.43 |
| HII1514 | Pleiades | 130 | G5V | 125 | 1.4 | 5.28 | … | 10.48 | 8.95 |
| HD140374 | Sco-Cen(UCL) | 130 | G8V | 8 | 1.4 | 5.28 | WTT? | 9.69 | 7.80 |
| CHXR6 | Cham | 140 | K2 | 1 | 1.3 | 5.28 | CTT | 11.22 | 7.31 |
| PreibZinn9979 | USco | 145 | G5 | 9 | 1.3 | 5.18 | … | 8.69 | |
| High variability targets | |||||||||
| PreibZinn9980 | USco | 145 | M1 | 0.3 | 0.3 | 22.87 | 7.91 | ||
| PreibZinn9940 | USco | 145 | M2 | 0.4 | 0.3 | 22.10 | 8.61 | ||
| PreibZinn9970 | USco | 145 | M1 | 0.5 | 0.3 | 20.72 | 8.82 | ||
| PreibZinn9955 | USco | 145 | 0.5 | 0.3 | 20.09 | 8.10 | |||
| PreibZinn9933 | USco | 145 | M1 | 0.8 | 0.4 | 18.95 | 8.84 |
| Name | Cluster | Distance | Spec | Age | Star Massa | Signal | T-Tauri | V | 2MASS Ks |
|---|---|---|---|---|---|---|---|---|---|
| [pc] | Type | [Myr] | [M☉] | [as] | Class | [mag] | [mag] | ||
| RECX4 | Eta Cha | 100 | K7 | 4 | 0.5 | 18.49 | WTT | 12.79 | 8.62 |
| PreibZinn9921 | USco | 145 | M1 | 0.8 | 0.4 | 18.42 | 8.63 | ||
| PreibZinn993 | USco | 145 | M1 | 1 | 0.4 | 17.45 | 9.08 | ||
| PreibZinn996 | USco | 145 | M0 | 1 | 0.4 | 15.42 | 8.98 | ||
| PreibZinn9963 | USco | 145 | M0 | 1.8 | 0.5 | 14.74 | 8.44 | ||
| DMTau | Tau Aur | 140 | K5V:e | 2 | 0.5 | 14.61 | CTT | 13.78 | 9.52 |
| PreibZinn9959 | USco | 145 | M0 | 2 | 0.5 | 14.11 | 8.91 | ||
| PreibZinn9962 | USco | 145 | M0 | 2 | 0.5 | 14.11 | 8.92 | ||
| CHXR29 | Cham | 140 | A0pshe | … | 0.5 | 13.74 | CTT | 8.44 | 5.94 |
| CHXR18N | Cham | 140 | K1 | … | 0.5 | 13.74 | WTT | 12.05 | 7.77 |
| CHXR68A | Cham | 140 | … | 0.5 | 13.74 | WTT | 13.37 | 8.87 | |
| TCha | Cham | 140 | F5 | … | 0.5 | 13.74 | CTT | 11.86 | 6.95 |
| PreibZinn9911 | USco | 145 | K7 | 0.8 | 0.5 | 13.26 | 8.37 | ||
| PreibZinn9916 | USco | 145 | M0 | 2.9 | 0.5 | 13.26 | 9.27 | ||
| DNTau | Tau Aur | 140 | K6V:e | 0.46 | 0.6 | 12.26 | CTT | 12.53 | 8.02 |
| IPTau | Tau Aur | 140 | M0:Ve | 2 | 0.6 | 11.84 | CTT | 13.04 | 8.35 |
| PreibZinn9926 | USco | 145 | K7 | 1.8 | 0.6 | 11.05 | 8.92 | ||
| DGTau | Tau Aur | 140 | GV:e | 2 | 0.7 | 10.57 | CTT | 6.99 | |
| PreibZinn9961 | USco | 145 | K5 | 1.8 | 0.7 | 9.47 | 8.62 | ||
| UYAur | Tau Aur | 140 | G5V:e | 2 | 0.7 | 9.28 | CTT | 12.40 | 7.24 |
| BPTau | Tau Aur | 140 | K5V:e | 0.6 | 0.8 | 9.16 | CTT | 11.96 | 7.74 |
| GKTau | Tau Aur | 140 | 2 | 0.8 | 9.16 | CTT | 12.50 | 7.47 | |
| AATau | Tau Aur | 140 | M0V:e | 2 | 0.8 | 9.04 | CTT | 12.82 | 8.05 |
| HQTau | Tau Aur | 140 | 0.691831 | 0.8 | 9.04 | CTT | 7.14 | ||
| IWTau | Tau Aur | 140 | K7V | 2 | 0.8 | 9.04 | WTT | 12.51 | 8.28 |
| DRTau | Tau Aur | 140 | K4V:e | 2 | 0.8 | 9.04 | CTT | 13.60 | 6.87 |
| V830Tau | Tau Aur | 140 | K7 | 2 | 0.8 | 8.92 | WTT | 12.21 | 8.42 |
| DLTau | Tau Aur | 140 | GV:e | 2 | 0.8 | 8.92 | CTT | 13.55 | 7.96 |
| L1551-51 | Tau Aur | 140 | K7 | 2 | … | 8.59 | 12.06 | 8.85 | |
| CITau | Tau Aur | 140 | GV:e | 2 | … | 8.59 | 12.99 | 7.79 | |
| V836Tau | Tau Aur | 140 | K7V | 2.1 | 0.8 | 8.59 | WTT | 13.13 | 8.60 |
| PreibZinn9918 | USco | 145 | K3 | 1 | 0.8 | 8.50 | 8.33 | ||
| PreibZinn9942 | USco | 145 | K5 | 2.9 | 0.8 | 8.50 | 8.37 | ||
| PreibZinn9984 | USco | 145 | K3 | 1 | 0.8 | 8.50 | 8.93 | ||
| TYC8648-446-1 | Sco-Cen(LCC) | 130 | 19 | 0.9 | 8.22 | WTT | 11.18 | 8.79 | |
| PreibZinn9968 | USco | 145 | K2 | 1 | 0.8 | 7.89 | 11.65 | 7.69 | |
| SR4/V2058Oph | Ophiuchus | 160 | K5e | 2 | … | 7.51 | 13.60 | 7.52 | |
| DoAr21Oph | Ophiuchus | 160 | B2V | 2 | … | 7.51 | 13.82 | 6.23 | |
| Haro1-16Oph | Ophiuchus | 160 | K3 | 2 | … | 7.51 | 12.59 | 7.61 | |
| V1121Oph | Ophiuchus | 160 | K5 | 2 | … | 7.51 | 11.25 | 6.96 | |
| V966Cen | Sco-Cen(LCC) | 130 | K1:V:+ | … | 1.0 | 7.40 | WTT? | 9.76 | 8.08 |
| TYC7319-749-1 | Sco-Cen(UCL) | 130 | K0 | 20 | 1.0 | 7.40 | WTT | 10.59 | 8.34 |
| GITau | Tau Aur | 140 | K5e | 2 | 0.9 | 7.39 | CTT | 13.50 | 7.89 |
| PreibZinn991 | USco | 145 | K3 | 3 | 0.9 | 7.37 | 9.43 | ||
| PreibZinn9937 | USco | 145 | K4 | 4 | 0.9 | 7.37 | 8.93 | ||
| PreibZinn9976 | USco | 145 | K1 | 1.2 | 1.0 | 6.98 | 8.49 | ||
| V1072Tau/TAP35 | Tau Aur | 140 | K1 | 2 | 1.0 | 6.87 | 10.30 | 8.30 | |
| TYC8640-2515-1 | Sco-Cen(LCC) | 130 | 20 | 1.1 | 6.72 | WTT | 10.77 | 8.73 | |
| TYC8242-1324-1 | Sco-Cen(LCC) | 130 | G0 | 16 | 1.1 | 6.72 | WTT | 10.38 | 8.14 |
| TYC8238-1462-1 | Sco-Cen(LCC) | 130 | K0 | 21 | 1.1 | 6.72 | WTT | 10.10 | 8.01 |
| TYC8655-149-1 | Sco-Cen(LCC) | 130 | 19 | 1.1 | 6.72 | WTT | 10.31 | 8.37 | |
| TYC8282-516-1 | Sco-Cen(UCL) | 130 | 19 | 1.1 | 6.72 | WTT | 10.68 | 8.54 | |
| TYC7833-2559-1 | Sco-Cen(UCL) | 130 | G6/G8III/IV | 21 | 1.1 | 6.72 | WTT | 10.61 | 8.45 |
| TYC8694-1685-1 | Sco-Cen(UCL) | 130 | 18 | 1.1 | 6.72 | WTT | 10.21 | 8.01 | |
| PreibZinn9944 | USco | 145 | K2 | 3.7 | 1.0 | 6.63 | 8.51 | ||
| PreibZinn9973 | USco | 145 | K0 | 0.8 | 1.0 | 6.57 | 11.00 | 7.49 | |
| PreibZinn9978 | USco | 145 | K0 | 0.3 | 1.0 | 6.50 | 10.80 | 7.46 | |
| PreibZinn9929 | USco | 145 | K3e | 3 | 1.1 | 6.32 | 13.40 | 8.52 | |
| PreibZinn9954 | USco | 145 | M3 | 3 | 1.1 | 6.32 | 8.86 | ||
| TYC9246…71-1 | Sco-Cen(LCC) | 130 | G | 7 | 1.2 | 6.16 | CTT | 10.54 | 7.29 |
| TYC9212-2011-1 | Sco-Cen(LCC) | 130 | 6 | 1.2 | 6.16 | WTT | 10.49 | 7.79 | |
| TYC8644-340-1 | Sco-Cen(LCC) | 130 | 13 | 1.2 | 6.16 | WTT | 10.29 | 7.97 | |
| TYC8645-1339-1 | Sco-Cen(LCC) | 130 | 5 | 1.2 | 6.16 | WTT | 10.82 | 7.73 | |
| TYC8249-52-1 | Sco-Cen(LCC) | 130 | K0/K1 | 13 | 1.2 | 6.16 | WTT | 10.48 | 8.13 |
| HD117524 | Sco-Cen(LCC) | 130 | G5/G6V | 15 | 1.2 | 6.16 | WTT? | 9.84 | 7.83 |
| TYC7796-1788-1 | Sco-Cen(UCL) | 130 | K5 | 13 | 1.2 | 6.16 | WTT | 10.17 | 7.88 |
| TYC7811-2909-1 | Sco-Cen(UCL) | 130 | 14 | 1.2 | 6.16 | WTT | 10.80 | 8.40 | |
| TYC8283-264-1 | Sco-Cen(UCL) | 130 | 18 | 1.2 | 6.16 | WTT | 10.09 | 7.90 | |
| TYC7824-1291-1 | Sco-Cen(UCL) | 130 | G8IV: | 15 | 1.2 | 6.16 | WTT | 9.80 | 7.81 |
| TYC8294-2230-1 | Sco-Cen(UCL) | 130 | G7 | 17 | 1.2 | 6.16 | WTT | 10.79 | 8.71 |
| TYC7852-51-1 | Sco-Cen(UCL) | 130 | F7V | 18 | 1.2 | 6.16 | WTT | 9.05 | 7.69 |
| PreibZinn9986 | USco | 145 | K0 | 1.8 | 1.1 | 6.14 | 7.76 | ||
| PreibZinn9983 | USco | 145 | K0 | 2 | 1.1 | 6.03 | 8.51 | ||
| PreibZinn9971 | USco | 145 | K1 | 2.5 | 1.1 | 5.92 | 11.65 | 8.09 | |
| TYC8982-3213-1 | Sco-Cen(LCC) | 130 | G1/G2V | 13 | 1.3 | 5.69 | WTT | 9.49 | 7.60 |
| HD105070 | Sco-Cen(LCC) | 130 | G1V | 13 | 1.3 | 5.69 | WTT? | 8.89 | 7.31 |
| TYC8234-2856-1 | Sco-Cen(LCC) | 130 | 9 | 1.3 | 5.69 | WTT | 10.59 | 8.16 | |
| TYC8633-28-1 | Sco-Cen(LCC) | 130 | G2 | 15 | 1.3 | 5.69 | WTT | 9.49 | 7.77 |
| HD108568 | Sco-Cen(LCC) | 130 | G1 | 14 | 1.3 | 5.69 | WTT? | 8.89 | 7.29 |
| HD113466 | Sco-Cen(LCC) | 130 | G5V: | 14 | 1.3 | 5.69 | WTT? | 9.18 | 7.36 |
| TYC7815-2029-1 | Sco-Cen(UCL) | 130 | K0/K1+ | 14 | 1.3 | 5.69 | WTT? | 9.46 | 7.88 |
| Name | Cluster | Distance | Spec | Age | Star Massa | Signal | T-Tauri | V | 2MASS Ks |
|---|---|---|---|---|---|---|---|---|---|
| [pc] | Type | [Myr] | [M☉] | [as] | Class | [mag] | [mag] | ||
| TYC7833-2037-1 | Sco-Cen(UCL) | 130 | K1 | 10 | 1.3 | 5.69 | WTT | 11.23 | 8.73 |
| TYC7840-1280-1 | Sco-Cen(UCL) | 130 | G9 | 9 | 1.3 | 5.69 | WTT | 10.57 | 8.29 |
| PreibZinn9949 | USco | 145 | G7 | 8.5 | 1.2 | 5.53 | 8.46 | ||
| LkCa19 | Tau Aur | 140 | K0V | 2 | 1.3 | 5.49 | WTT | 10.85 | 8.15 |
| PreibZinn9925 | USco | 145 | G9 | 4 | 1.2 | 5.44 | 10.99 | 8.44 | |
| TYC8644-802-1 | Sco-Cen(LCC) | 130 | 6 | 1.4 | 5.28 | WTT | 10.21 | 7.66 | |
| HD108611 | Sco-Cen(LCC) | 130 | G5V | 10 | 1.4 | 5.28 | WTT? | 9.04 | 7.12 |
| TYC7326…28-1 | Sco-Cen(UCL) | 130 | K1 | 7 | 1.4 | 5.28 | WTT | 10.54 | 8.12 |
| HD138995 | Sco-Cen(UCL) | 130 | G5V | 10 | 1.4 | 5.28 | WTT? | 9.39 | 7.52 |
| TYC7842-250-1 | Sco-Cen(UCL) | 130 | 8 | 1.4 | 5.28 | WTT | 10.90 | 8.69 | |
| TYC7333-719-1 | Sco-Cen(UCL) | 130 | G8 | 10 | 1.4 | 5.28 | WTT | 10.99 | 8.53 |
| TYC7853-227-1 | Sco-Cen(UCL) | 130 | 8 | 1.4 | 5.28 | WTT | 11.05 | 8.65 | |
| Yet to be measured targets | |||||||||
| GJ803 | Beta Pic | 9.9 | M1Ve | 20 | 0.4 | 242.81 | 8.81 | 4.53 | |
| HD155555C | Beta Pic | 31.4 | M4.5 | 20 | 0.2 | 153.11 | 12.71 | 7.63 | |
| HIP23309 | Beta Pic | 26.3 | K7V | 20 | 0.5 | 81.25 | 10.02 | 6.24 | |
| HIP3556 | Tuc | 45 | M1.5 | 20 | 0.3 | 71.23 | 11.91 | 7.62 | |
| GJ3305 | Beta Pic | 29.8 | M0.5 | 20 | 0.5 | 64.53 | 10.59 | 6.41 | |
| CD-64d1208 | Beta Pic | 29.2 | M0 | 20 | 0.6 | 54.88 | 9.54 | 6.10 | |
| GSC8056-0482 | Hor | 60 | M3Ve | 30 | 0.3 | 53.42 | 12.11 | 7.50 | |
| TWA8A | TW Hya | 60 | M2 | 10 | 0.3 | 53.42 | 7.43 | ||
| TWA10 | TW Hya | 60 | M2.5 | 10 | 0.3 | 53.42 | 8.19 | ||
| TWA11B | TW Hya | 60 | M2.5 | 10 | 0.3 | 53.42 | 13.30 | 5.77 | |
| HIP107345 | Tuc | 45 | M1 | 20 | 0.4 | 53.42 | 11.72 | 7.87 | |
| AOMen | Beta Pic | 38.5 | K3:V: | 20 | 0.6 | 41.63 | 9.95 | 6.81 | |
| TWA7 | TW Hya | 60 | M1 | 10 | 0.4 | 40.06 | 11.06 | 6.90 | |
| TWA13 | TW Hya | 60 | M1Ve | 10 | 0.4 | 40.06 | 11.50 | 7.49 | |
| HD35850 | Beta Pic | 26.8 | F7V | 20 | 1.0 | 35.88 | 6.30 | 4.93 | |
| HIP1993 | Tuc | 45 | K7V | 20 | 0.6 | 35.61 | 11.26 | 7.75 | |
| GSC8499-0304 | Hor | 60 | M0Ve | 30 | 0.5 | 32.05 | 12.09 | 8.72 | |
| TWA14 | TW Hya | 60 | M0 | 10 | 0.5 | 32.05 | 8.50 | ||
| TWA18 | TW Hya | 60 | M0.5 | 10 | 0.5 | 32.05 | 8.85 | ||
| HD3221 | Tuc | 45 | K5V | 20 | 0.8 | 26.71 | 9.56 | 6.53 | |
| GSC8497-0995 | Hor | 60 | K6Ve | 30 | 0.6 | 26.71 | 10.97 | 7.78 | |
| TWA6 | TW Hya | 60 | K7 | 10 | 0.6 | 26.71 | 12.00 | 8.04 | |
| TWA1 | TW Hya | 60 | K8Ve | 10 | 0.6 | 26.71 | 10.92 | 7.30 | |
| TWA19B | TW Hya | 60 | K7 | 10 | 0.6 | 26.71 | 8.28 | ||
| V343Nor | Beta Pic | 39.8 | K0V | 20 | 1.0 | 24.16 | 8.14 | 5.85 | |
| HD202746 | Tuc | 45 | K2Vp | 20 | 0.9 | 23.74 | 8.97 | 6.40 | |
| TWA4 | TW Hya | 60 | K5 | 10 | 0.7 | 22.89 | 8.89 | 5.59 | |
| TWA9A | TW Hya | 60 | K5 | 10 | 0.7 | 22.89 | 11.13 | 7.85 | |
| TWA17 | TW Hya | 60 | K5 | 10 | 0.7 | 22.89 | 9.01 | ||
| HD1466 | Tuc | 45 | F8/G0V | 20 | 1.0 | 21.37 | 7.46 | 6.15 | |
| HD186602 | Tuc | 45 | F7/F8V | 20 | 1.0 | 21.37 | 7.28 | 6.09 | |
| HD207575 | Tuc | 45 | F6V | 20 | 1.0 | 21.37 | 7.22 | 6.03 | |
| PPM366328 | Tuc | 45 | K0 | 20 | 1.0 | 21.37 | 9.67 | 7.61 | |
| GSC8047-0232 | Hor | 60 | K3V | 30 | 0.8 | 20.03 | 10.87 | 8.41 | |
| CD-53d386 | Hor | 60 | K3Ve | 30 | 0.8 | 20.03 | 11.02 | 8.59 | |
| GSC8862-0019 | Hor | 60 | K4Ve | 30 | 0.8 | 20.03 | 11.67 | 8.91 | |
| BetaPic | Beta Pic | 19.3 | A5V | 20 | 2.5 | 19.93 | 3.85 | 3.53 | |
| PZTel | Beta Pic | 49.7 | K0Vp | 20 | 1.0 | 19.35 | 8.43 | 6.37 | |
| HD208233 | Tuc | 45 | G8V | 20 | 1.2 | 17.81 | 8.90 | 6.75 | |
| CCPhe | Hor | 60 | K1V | 30 | 0.9 | 17.81 | 9.35 | 6.83 | |
| CD-65d149 | Hor | 60 | K2Ve | 30 | 0.9 | 17.81 | 10.19 | 8.01 | |
| HD172555 | Beta Pic | 29.2 | A5IV-V | 20 | 2.0 | 16.46 | 4.78 | 4.30 | |
| HD987 | Tuc | 45 | G6V | 20 | 1.3 | 16.44 | 8.76 | 6.96 | |
| HR9 | Beta Pic | 39.1 | F2IV | 20 | 1.5 | 16.39 | 6.19 | 5.24 | |
| CPD-64120 | Hor | 60 | K1Ve | 30 | 1.0 | 16.03 | 10.29 | 8.01 | |
| HD202917 | Tuc | 45 | G5V | 20 | 1.4 | 15.26 | 8.65 | 6.91 | |
| HD195627 | Tuc | 45 | F1III | 20 | 1.5 | 14.25 | 4.75 | 4.04 | |
| HD195961 | Tuc | 45 | Fm | 20 | 1.5 | 14.25 | 4.86 | 3.90 | |
| HD164249 | Beta Pic | 46.9 | F5V | 20 | 1.5 | 13.67 | 7.01 | 5.91 | |
| HD207129 | Tuc | 45 | G0V | 20 | 1.6 | 13.35 | 5.57 | 4.24 | |
| IQTau | Tau Aur | 140 | M2 | 2 | 0.5 | 13.21 | CTT | 14.50 | 7.78 |
| HD181327 | Beta Pic | 50.6 | F5/F6V | 20 | 1.5 | 12.67 | 7.04 | 5.91 | |
| HD178085 | Tuc | 45 | G0V | 20 | 1.7 | 12.57 | 8.31 | 6.88 | |
| RXJ012320.9-572853 | HOR | 60 | G6V | 30 | 1.3 | 12.33 | 8.53 | 6.85 | |
| DQTau | Tau Aur | 140 | M0V:e | 2 | 0.6 | 12.05 | CTT | 13.66 | 7.98 |
| RXJ020718.6-531155 | HOR | 60 | G5V | 30 | 1.4 | 11.45 | 8.64 | 6.89 | |
| TWA19A | TW Hya | 60 | G3/G5Vp | 10 | 1.4 | 11.45 | 9.07 | 7.51 | |
| RXJ020436.7-545320 | HOR | 60 | F2V | 30 | 1.5 | 10.68 | 6.45 | 5.45 | |
| HD200798 | Tuc | 45 | A5/A6IV/V | 20 | 2.0 | 10.68 | 6.69 | 6.07 | |
| GMTau | Tau Aur | 140 | M6.5 | 2 | … | 8.59 | 10.63 | ||
| I045251+3016 | Tau Aur | 140 | K5 | 2 | … | 8.59 | 11.60 | 8.13 | |
| Haro6-37 | Tau Aur | 140 | K6 | 2 | 0.8 | 8.48 | CTT | 13.42 | 7.31 |
| VXR03 | IC2391 | 155 | 53 | … | 7.75 | 10.95 | 14.86 | ||
| L36 | IC2391 | 155 | F6V | 53 | … | 7.75 | 9.83 | 8.63 | |
| VXR31 | IC2391 | 155 | 53 | … | 7.75 | 11.22 | 9.69 | ||
| H21 | IC2391 | 155 | 53 | … | 7.75 | 11.69 | 9.54 | ||
| SHJM3 | IC2391 | 155 | K3e | 53 | 0.8 | 7.75 | 12.63 | 9.69 | |
| L33 | IC2391 | 155 | F5V | 53 | … | 7.75 | 9.59 | 8.36 | |
| H35 | IC2391 | 155 | F9 | 53 | … | 7.75 | 10.34 | 8.99 | |
| CHXR3 | Cham | 140 | K3 | 0.5 | 0.9 | 7.63 | WTT | 12.26 | 7.36 |
| CHXR10 | Cham | 140 | M0 | 2 | 0.9 | 7.63 | CTT | 11.69 | 8.20 |
| Name | Cluster | Distance | Spec | Age | Star Massa | Signal | T-Tauri | V | 2MASS Ks |
|---|---|---|---|---|---|---|---|---|---|
| [pc] | Type | [Myr] | [M☉] | [as] | Class | [mag] | [mag] | ||
| ROX3/V2245Oph | Ophiuchus | 160 | M1 | 2 | … | 7.51 | 13.12 | 8.78 | |
| HR6070 | Beta Pic | 43 | A0V | 20 | 3.0 | 7.45 | 4.80 | 4.74 | |
| PreibZinn9985 | USco | 145 | K2 | 2 | 0.9 | 7.13 | 8.18 | ||
| HR136 | Tuc | 45 | A0V | 20 | 3.0 | 7.12 | 5.07 | 4.99 | |
| HR9062 | Tuc | 45 | A1V | 20 | 3.0 | 7.12 | 5.00 | 4.82 | |
| SHJM6 | IC2391 | 155 | K0 | 53 | 1.0 | 6.20 | 11.86 | 9.79 | |
| VXR62 | IC2391 | 155 | 53 | 1.0 | 6.20 | 11.73 | 15.03 | ||
| VXR67 | IC2391 | 155 | 53 | 1.0 | 6.20 | 11.71 | 13.61 | ||
| VXR16 | IC2391 | 155 | 53 | 1.1 | 5.64 | 11.84 | 14.58 | ||
| VXR72 | IC2391 | 155 | G9 | 53 | 1.1 | 5.64 | 11.46 | 9.59 | |
| HR126 | Tuc | 45 | B9V | 20 | 4.0 | 5.34 | 4.36 | 4.48 | |
| TWA11A | TW Hya | 60 | A0V | 10 | 3.0 | 5.34 | 5.78 | 5.77 |
| Target | Peak to Peak | Program | Target | Peak to Peak | Program | ||
|---|---|---|---|---|---|---|---|
| HII1215 | 0.024 | 0.009 | Maidanak | PreibZinn99 68 | 0.140 | 0.045 | SMARTS |
| 51 Eri | 0.019 | 0.010 | Maidanak | TYC7326-928-1 | 0.140 | 0.045 | SMARTS |
| GJ3305 | 0.020 | 0.010 | Maidanak | 5251+3060 | 0.150 | 0.045 | Maidanak |
| HII996 | 0.030 | 0.010 | Maidanak | TYC8238-1462-1 | 0.150 | 0.045 | SMARTS |
| HII489 | 0.029 | 0.012 | Maidanak | CHXR 65 | 0.170 | 0.045 | SMARTS |
| HII1309 | 0.037 | 0.013 | Maidanak | DM Tau | 0.136 | 0.046 | Maidanak |
| CHXR 11 | 0.040 | 0.013 | SMARTS | PreibZinn99 59 | 0.140 | 0.046 | SMARTS |
| HD141569 | 0.056 | 0.013 | Maidanak | TYC7319-749-1 | 0.180 | 0.046 | SMARTS |
| HII1207 | 0.034 | 0.014 | Maidanak | PreibZinn99 61 | 0.140 | 0.047 | SMARTS |
| HII1797 | 0.044 | 0.014 | Maidanak | PreibZinn99 1 | 0.140 | 0.047 | SMARTS |
| HII1856 | 0.051 | 0.014 | Maidanak | PreibZinn99 29 | 0.170 | 0.047 | SMARTS |
| HII1095 | 0.050 | 0.015 | Maidanak | PreibZinn99 37 | 0.140 | 0.048 | SMARTS |
| HII1613 | 0.054 | 0.015 | Maidanak | TYC8655-149-1 | 0.140 | 0.048 | SMARTS |
| HD140374 | 0.060 | 0.015 | SMARTS | TYC7853-227-1 | 0.140 | 0.048 | SMARTS |
| HII2366 | 0.041 | 0.016 | Maidanak | PreibZinn99 32 | 0.130 | 0.049 | SMARTS |
| PreibZinn99 69 | 0.050 | 0.016 | SMARTS | TYC8283-264-1 | 0.150 | 0.049 | SMARTS |
| HII1794 | 0.055 | 0.016 | Maidanak | HD149735 | 0.130 | 0.050 | SMARTS |
| TYC9244-814-1 | 0.050 | 0.017 | SMARTS | TYC7840-1280-1 | 0.170 | 0.051 | SMARTS |
| TYC8259-689-1 | 0.060 | 0.017 | SMARTS | TYC7842-250-1 | 0.130 | 0.052 | SMARTS |
| HII430 | 0.048 | 0.018 | Maidanak | TYC8644-340-1 | 0.130 | 0.052 | SMARTS |
| TYC8270-2015-1 | 0.050 | 0.018 | SMARTS | TYC8694-1685-1 | 0.150 | 0.052 | SMARTS |
| HII1275 | 0.056 | 0.018 | Maidanak | PreibZinn99 76 | 0.160 | 0.052 | SMARTS |
| TYC7871-1282-1 | 0.070 | 0.018 | SMARTS | TYC7833-2037-1 | 0.800 | 0.052 | SMARTS |
| HII1514 | 0.059 | 0.019 | Maidanak | TYC7852-51-1 | 0.140 | 0.053 | SMARTS |
| HD149551 | 0.060 | 0.019 | SMARTS | PreibZinn99 26 | 0.170 | 0.054 | SMARTS |
| PreibZinn99 74 | 0.060 | 0.019 | SMARTS | PreibZinn99 16 | 0.170 | 0.055 | SMARTS |
| TYC8646-166-1 | 0.070 | 0.019 | SMARTS | PreibZinn99 84 | 0.170 | 0.055 | SMARTS |
| PreibZinn9 10 | 0.070 | 0.019 | SMARTS | PreibZinn99 86 | 0.190 | 0.056 | SMARTS |
| TYC7848-1659-1 | 0.060 | 0.020 | SMARTS | TYC7824-1291-1 | 0.190 | 0.057 | SMARTS |
| CHXR 37 | 0.070 | 0.020 | SMARTS | PreibZinn99 23 | 0.150 | 0.058 | SMARTS |
| CHXR 8 | 0.070 | 0.020 | SMARTS | TYC8249-52-1 | 0.150 | 0.058 | SMARTS |
| PreibZinn99 19 | 0.070 | 0.021 | SMARTS | TYC8645-1339-1 | 0.170 | 0.058 | SMARTS |
| TYC7353-2640-1 | 0.080 | 0.021 | SMARTS | HD108611 | 0.180 | 0.058 | SMARTS |
| RECX5 | 0.090 | 0.021 | SMARTS | TYC7811-2909-1 | 0.150 | 0.062 | SMARTS |
| TYC9245-617-1 | 0.060 | 0.022 | SMARTS | TYC9212-2011-1 | 0.160 | 0.062 | SMARTS |
| PreibZinn99 75 | 0.070 | 0.022 | SMARTS | ROX3 | 0.180 | 0.062 | SMARTS |
| TYC7828-2913-1 | 0.070 | 0.022 | SMARTS | V1121 Oph | 0.270 | 0.063 | SMARTS |
| PreibZinn99 64 | 0.070 | 0.022 | SMARTS | TYC7815-2029-1 | 0.220 | 0.064 | SMARTS |
| TYC8633-508-1 | 0.080 | 0.022 | SMARTS | TYC7858-830-1 | 0.170 | 0.065 | SMARTS |
| TYC8636-2515-1 | 0.090 | 0.022 | SMARTS | PreibZinn99 6 | 0.190 | 0.065 | SMARTS |
| PreibZinn99 81 | 0.080 | 0.023 | SMARTS | PreibZinn99 63 | 0.200 | 0.066 | SMARTS |
| HII1032 | 0.068 | 0.024 | Maidanak | TAP35 | 0.308 | 0.066 | Maidanak |
| TYC7310-2431-1 | 0.080 | 0.024 | SMARTS | TYC7796-1788-1 | 0.170 | 0.067 | SMARTS |
| TYC8283-2795-1 | 0.080 | 0.024 | SMARTS | PreibZinn99 40 | 0.180 | 0.067 | SMARTS |
| TYC8667-283-1 | 0.090 | 0.024 | SMARTS | RECX4 | 0.200 | 0.067 | SMARTS |
| TYC7305-380-1 | 0.090 | 0.025 | SMARTS | PreibZinn99 77 | 0.160 | 0.068 | SMARTS |
| TYC7349-2191-1 | 0.090 | 0.025 | SMARTS | PreibZinn99 3 | 0.200 | 0.068 | SMARTS |
| TYC7310-503-1 | 0.080 | 0.026 | SMARTS | CHXR 18N | 0.210 | 0.068 | SMARTS |
| PreibZinn99 66 | 0.080 | 0.027 | SMARTS | SR4 | 0.200 | 0.069 | SMARTS |
| PreibZinn99 82 | 0.080 | 0.027 | SMARTS | TYC7333-719-1 | 0.240 | 0.069 | SMARTS |
| TYC8297-1613-1 | 0.100 | 0.027 | SMARTS | ROX43A | 0.180 | 0.072 | SMARTS |
| TYC9231-1566-1 | 0.100 | 0.027 | SMARTS | Haro6-37 | 0.230 | 0.075 | SMARTS |
| PreibZinn99 2 | 0.090 | 0.028 | SMARTS | CHXR 66 | 0.220 | 0.076 | SMARTS |
| TYC8258-1878-1 | 0.090 | 0.028 | SMARTS | PreibZinn99 18 | 0.240 | 0.077 | SMARTS |
| TYC8317-551-1 | 0.100 | 0.028 | SMARTS | PreibZinn99 55 | 0.230 | 0.078 | SMARTS |
| TYC8652-1791-1 | 0.100 | 0.029 | SMARTS | V830 Tau | 0.346 | 0.078 | Maidanak |
| TYC7845-1174-1 | 0.110 | 0.029 | SMARTS | PreibZinn99 70 | 0.230 | 0.079 | SMARTS |
| CHXR 40 | 0.100 | 0.030 | SMARTS | TYC8294-2230-1 | 0.230 | 0.079 | SMARTS |
| PreibZinn99 13 | 0.100 | 0.030 | SMARTS | L1551-51 | 0.258 | 0.079 | Maidanak |
| PreibZinn99 45 | 0.100 | 0.030 | SMARTS | V966 Cen | 0.130 | 0.080 | SMARTS |
| TYC7783-1908-1 | 0.110 | 0.030 | SMARTS | PreibZinn99 11 | 0.230 | 0.081 | SMARTS |
| PreibZinn99 17 | 0.110 | 0.030 | SMARTS | HD105070 | 0.230 | 0.083 | SMARTS |
| TYC8983-98-1 | 0.110 | 0.030 | SMARTS | CHXR 29 | 0.260 | 0.083 | SMARTS |
| PreibZinn99 58 | 0.090 | 0.031 | SMARTS | TYC7813-224-1 | 0.080 | 0.084 | SMARTS |
| TYC8295-1530-1 | 0.100 | 0.031 | SMARTS | TYC8982-3213-1 | 0.250 | 0.085 | SMARTS |
| TYC7822-158-1 | 0.110 | 0.031 | SMARTS | IWTau | 0.238 | 0.086 | Maidanak |
| TYC7333-1260-1 | 0.110 | 0.031 | SMARTS | V1056 Sco | 0.230 | 0.087 | SMARTS |
| V1009 Cen | 0.090 | 0.032 | SMARTS | TYC9246-971-1 | 0.240 | 0.088 | SMARTS |
| PreibZinn99 39 | 0.090 | 0.034 | SMARTS | PreibZinn99 25 | 0.250 | 0.088 | SMARTS |
| HD140421 | 0.110 | 0.034 | SMARTS | PreibZinn99 33 | 0.250 | 0.091 | SMARTS |
| TYC8263-2453-1 | 0.110 | 0.034 | SMARTS | PreibZinn99 54 | 0.240 | 0.092 | SMARTS |
| PreibZinn99 14 | 0.120 | 0.034 | SMARTS | PreibZinn99 49 | 0.210 | 0.093 | SMARTS |
| LkCa19 | 0.163 | 0.034 | Maidanak | TYC8242-1324-1 | 0.320 | 0.094 | SMARTS |
| TYC8654-1115-1 | 0.120 | 0.035 | SMARTS | PreibZinn99 80 | 0.260 | 0.097 | SMARTS |
| TYC8640-2515-1 | 0.130 | 0.035 | SMARTS | PreibZinn99 42 | 0.290 | 0.097 | SMARTS |
| PreibZinn99-79 | 0.100 | 0.036 | SMARTS | PreibZinn99 21 | 0.300 | 0.107 | SMARTS |
| TYC8683-242-1 | 0.110 | 0.036 | SMARTS | HQTau | 0.233 | 0.109 | Maidanak |
| PreibZinn99 28 | 0.110 | 0.037 | SMARTS | CI Tau | 0.298 | 0.114 | Maidanak |
| PreibZinn99 60 | 0.110 | 0.037 | SMARTS | IPTau | 0.362 | 0.125 | Maidanak |
| PreibZinn99 67 | 0.120 | 0.037 | SMARTS | PreibZinn99 15 | 0.430 | 0.126 | SMARTS |
| HII1124 | 0.100 | 0.038 | Maidanak | TYC7817-622-1 | 0.380 | 0.127 | SMARTS |
| Target | Peak to Peak | Program | Target | Peak to Peak | Program | ||
|---|---|---|---|---|---|---|---|
| PreibZinn99 27 | 0.140 | 0.038 | SMARTS | BP Tau | 0.457 | 0.129 | Maidanak |
| PreibZinn99 62 | 0.140 | 0.038 | SMARTS | UYAur | 0.350 | 0.130 | Maidanak |
| RECX6 | 0.150 | 0.038 | SMARTS | SR10 | 0.370 | 0.131 | SMARTS |
| DN Tau | 0.165 | 0.038 | Maidanak | DoAr 21 | 0.310 | 0.134 | SMARTS |
| PreibZinn99 36 | 0.110 | 0.039 | SMARTS | DG Tau | 0.606 | 0.138 | Maidanak |
| CHXR 6 | 0.120 | 0.039 | SMARTS | PreibZinn99 78 | 0.350 | 0.139 | SMARTS |
| HD120411 | 0.120 | 0.039 | SMARTS | V836 Tau | 0.417 | 0.142 | Maidanak |
| RECX10 | 0.120 | 0.039 | SMARTS | HD113466 | 0.390 | 0.149 | SMARTS |
| TYC8248-539-1 | 0.120 | 0.039 | SMARTS | GK Tau | 0.692 | 0.183 | Maidanak |
| PreibZinn9 22 | 0.110 | 0.040 | SMARTS | PreibZinn99 73 | 0.550 | 0.188 | SMARTS |
| TYC8319-1687-1 | 0.120 | 0.040 | SMARTS | DL Tau | 0.723 | 0.212 | Maidanak |
| PreibZinn99 71 | 0.140 | 0.040 | SMARTS | DH Tau | 0.537 | 0.214 | Maidanak |
| HD138995 | 0.150 | 0.040 | SMARTS | GI Tau | 0.597 | 0.216 | Maidanak |
| L1551-55 | 0.126 | 0.041 | Maidanak | TYC8633-28-1 | 0.180 | 0.226 | SMARTS |
| TYC7833-2559-1 | 0.140 | 0.041 | SMARTS | HD108568 | 0.550 | 0.233 | SMARTS |
| PreibZinn99 83 | 0.130 | 0.042 | SMARTS | PreibZinn99 44 | 0.670 | 0.262 | SMARTS |
| TWA19 | 0.140 | 0.042 | SMARTS | DR Tau | 1.092 | 0.296 | Maidanak |
| HD117524 | 0.140 | 0.043 | SMARTS | AA Tau | 1.499 | 0.454 | Maidanak |
| TYC8644-802-1 | 0.140 | 0.043 | SMARTS | TYC8234-2856-1 | 0.170 | 0.495 | SMARTS |
| CHXR 68A | 0.150 | 0.043 | SMARTS | TYC8282-516-1 | 0.130 | 0.689 | SMARTS |
| TYC7851-1-1 | 0.120 | 0.044 | SMARTS | RECX2 | 2.150 | 0.808 | SMARTS |
| TYC8648-446-1 | 0.150 | 0.044 | SMARTS | TCha | 2.430 | 0.850 | SMARTS |
| PreibZinn99 50 | 0.120 | 0.045 | SMARTS | HII1136 | 1.841 | 1.127 | Maidanak |