Discovery of Two Spectroscopically Peculiar,
Low-Luminosity
Quasars at 11affiliation: The data presented herein were obtained at the W.M. Keck
Observatory, which is operated as a scientific partnership among the
California Institute of Technology, the University of California and the
National Aeronautics and Space Administration. The Observatory was made
possible by the generous financial support of the W.M. Keck Foundation.
Abstract
We report the discovery of two low-luminosity quasars at , both of which show prominent N IV] 1486Å emission. This line is extremely rare in quasar spectra at any redshift; detecting it in two out of a sample of 23 objects (i.e., of the sample) is intriguing and is likely due to the low-luminosity, high-redshift quasar sample we are studying. This is still a poorly explored regime, where contributions from associated, early starbursts may be significant. One interpretation of this line posits photoionization by very massive young stars. Seeing N IV] 1486Å emission in a high-redshift quasar may thus be understood in the context of co-formation and early co-evolution of galaxies and their supermassive black holes. Alternatively, we may be seeing a phenomenon related to the early evolution of quasar broad emission line regions. The non-detection (and possibly even broad absorption) of N V 1240Å line in the spectrum of one of these quasars may support that interpretation. These two objects may signal a new faint quasar population or an early AGN evolutionary stage at high redshifts.
1 Introduction
A growing body of theoretical models backed by emerging observational evidence paints a picture of joint formation and evolution of galaxies and quasars; for reviews see, e.g., the proceedings edited by Ho (2004), Djorgovski (2005), and references therein. In this picture, merger-driven build-up of massive halos trigger both vigorous star formation and fuel the central black hole igniting a quasar (Kauffmann & Haehnelt 2000; Hopkins et al. 2006). AGN feedback is now believed to be an essential factor in the formation and evolution of galaxies. Understanding the AGN-starburst connection is especially interesting at high redshifts, as we probe the epoch of the initial assembly of massive galaxies. Observationally, this is challenging in the case of host galaxies of luminous Type I quasars, as the AGN activity far outshines any star formation related processes. However, by observing lower luminosity Type I quasars or Type II (e.g., obscured) quasars, the blinding intensity of the central engine is reduced, allowing properties of the host galaxy to be studied.
In this Letter, we report the discovery of two low-luminosity Type I quasars where we may be seeing evidence for a simultaneous starburst with a top-heavy IMF, and AGN activity. Both quasars show a prominent, moderately-broad N IV] Å emission line, which is rarely seen in quasar spectra at any redshift.
2 Observations
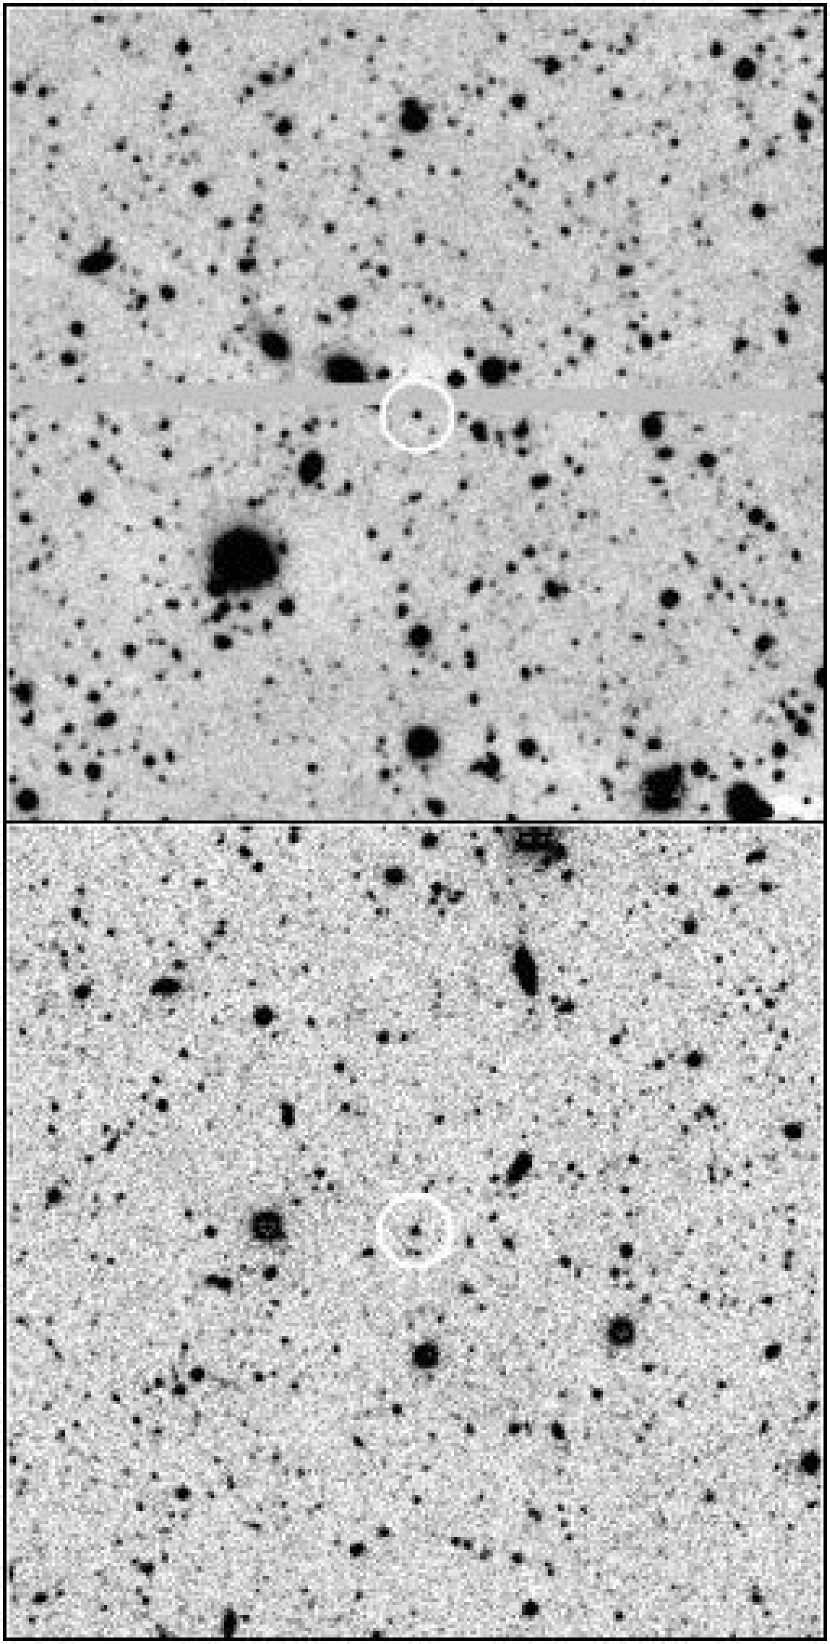
The two objects are low-luminosity quasars at , found in a sample of 23 objects used to measure the low-luminosity end of the quasar luminosity function (QLF) at (Bogosavljević et al. 2007). The parent sample ranges in redshift from to . The candidates for this sample were selected from the NOAO Deep Wide Field Survey (NDWFS) Boötes field (Jannuzi & Dey 1999) and the Deep Lens Survey (DLS; Wittman et al. 2002). Quasar candidates were selected based on the colors of simulated quasars in the redshift range, incorporating a range of spectral slopes, Ly equivalent widths, and intervening neutral hydrogen absorbers, down to the limiting magnitude of . Finding charts for the two N IV] quasars are presented in Figure 1. Details of the survey and candidate selection will be presented by Bogosavljević et al. (2007).
We obtained spectroscopic followup for our candidates on UT 2006 May 20 through 22 with the Low-Resolution Imaging Spectrometer (LRIS; Oke et al. 1995) on the Keck I telescope. Only the red camera was used, with the 400 lines mm-1 grating blazed at 8500Å. The spectra were reduced using BOGUS, an IRAF package developed by Stern, Bunker, & Stanford111https://zwolfkinder.jpl.nasa.gov/$∼$stern/homepage/bogus.html for reducing slitmask data, modified slightly for our single-slit data. DLS10530528 was discovered in a 1800 second exposure of a candidate in the DLS F4 field and NDWFS14333408 was identified from a 900 second exposure of a candidate in the Boötes field. The final spectra are presented in Figure 2 and the source parameters are listed in Table 1.
Several things are worth noting. First is the detection of the N IV] Å emission lines, which is particularly strong in DLS10530528 (e.g., in comparison with the C IV Å line). At the same time, the commonly observed N V Å emission line is entirely absent, and may even be seen in absorption in DLS10530528 (see Figure 3). This latter observation is somewhat unusual since the C IV Å line in this source does not show broad absorption. While broad absorption lines are seen in approximately 10% of quasars, such quasars will show broad absorption in all permitted species.
The permitted emission lines for the two N IV] quasars are narrow compared with typical quasar line-widths. A single component Voigt fit to Ly measures a full-width at half-maximum (FWHM) of km s-1. Since the blue side of the Ly profile is absorbed, we forced symmetry in the line by mirroring the red side of the line profile over the peak wavelength. To search for a broad-line component we fit a two-component Gaussian to the Ly profile. For DLS10530528, we measure a narrow-line FWHM of 434 km s-1 and a broad-line FWHM of 1727 km s-1. In NDWFS14333408 we measure a narrow-line FWHM of 713 km s-1 and a broad-line FWHM of 3015 km s-1. Therefore, while these objects have significant contribution from their narrow-line components ( of the line flux in DLS10530528 and in NDWFS14333408), their broad-line velocities of km s-1 place them in the quasar regime. Using the velocity widths from the broad-line component of Ly as a proxy for C IV or H, and the black hole mass estimators from Dietrich & Hamann (2004) and Vestergaard & Peterson (2006), we obtain for DLS10530528 and for NDWFS14333408. Consistent with the somewhat narrow line widths (for a broad-lined quasar) and the low-luminosity, these inferred black hole masses are much lower than the masses inferred for luminous quasars.
On UT 2007 January 23 we imaged DLS10530528 with the Slit-viewing Camera (SCAM) of the NIRSPEC instrument on Keck-II. We used the -band filter and imaged the source with a 9-point dither pattern of 120 second exposures, for a total of 1080 seconds at the position of the quasar. The seeing was 07. The data were reduced using the XDIMSUM package in IRAF. We calibrate our image to the 2MASS -band using a 15.26 magnitude point source that is detected in the field. The quasar is not detected, with a 3 magnitude threshold of 24.9 (Vega) magnitudes.
NDWFS14333408 was observed as part of FLAMEX, a near-infrared survey overlapping 4.1 deg2 of the Boötes area (Elston et al. 2006). The quasar is detected at in both the and images. In addition, this quasar was observed in the IRAC Shallow Survey, an 8.5 deg2 Spitzer imaging survey of the Boötes field (Eisenhardt et al. 2004). The source is faintly () detected at 3.6µm and 4.5µm at 19.0 and 19.1 (Vega) magnitudes, respectively. We list the 4″ aperture magnitude from the FLAMEX catalog as well as the IRAC detections in Table 1. The quasar is not detected in the 5.8µm or 8.0µm images, whose detection thresholds are and (Vega; 3″ aperture) magnitudes, respectively. Note that the [3.6][4.5] colors for this object are quite blue compared to typical mid-infrared colors of AGN (e.g., Stern et al. 2005). The result is not unexpected: at , H emission is shifted into the shortest wavelength IRAC band, causing AGN at this redshift to have blue [3.6][4.5] colors.
Figure 4 plots the spectral energy distributions (SEDs) of both objects, using all available photometry. We compare this SED with the SDSS composite spectrum (Vanden Berk et al. 2001) as well as the starburst template from Kinney et al. (1996) with , both shifted to . Significant deviations are seen, especially at long wavelengths where both objects appear much bluer than the average quasar and starbusrt spectra. The SED of NDWFS14333408 seems more consistent with the starburst spectrum, at least in the rest-frame ultraviolet, but DLS10530528 deviates strongly from both.
3 Discussion
The most striking feature in the spectra of these two faint quasars is the presence of the extremely unusual N IV] Å emission line. The quasar population generally shows remarkable spectroscopic similarity out to the highest observed redshifts, with no obvious signs of evolution (e.g., Fan 2006). None of the published average quasar spectral templates show any trace of the N IV] Å line (Figure 5). The top spectrum (solid line) is the SDSS quasar composite from Vanden Berk et al. (2001). The quasars that contribute to this part of the spectrum are at redshifts comparable to the quasars in our sample, but they sample the bright end of the quasar luminosity function. The bottom spectrum (dotted line) is the HST UV composite spectrum from Telfer et al. (2002). The objects contributing to this part of the spectrum are low-redshift quasars ().
The only strong detection of this line in a quasar that we are aware of is in the nitrogen quasar Q0353383 (Osmer & Smith 1980). This object has been analyzed by Baldwin et al. (2003) who derive an overabundance of nitrogen by a factor as high as times solar in this object. A sample of apparently nitrogen-rich quasars was compiled by Bentz et al. (2004) from the 6650 quasars in the SDSS DR1 database with (allowing for the detection of N IV] Å and N III] Å). Bentz et al. (2004) estimate that “nitrogen-enriched” quasars make up at most of quasars. Their sample has luminosities in the range to . We found two such objects in a sample of 23 quasars () that are concentrated at and are 0.7 magnitudes deeper than the SDSS sample. They found 20 quasars with equivalent widths 2.0Å in both nitrogen lines and 33 quasars with EWs 2.0Å in only one of the nitrogen lines. In these quasars the N IV] Å line is accompanied by similarly strong N V Å and N III] Å, the latter of which is outside our wavelengths range. We fit Voigt profiles to the nitrogen lines in our spectra (as well as to Ly and C IV Å) to determine line fluxes, equivalent widths and dispersion velocities (Table 2, Figure 3). The mean N IV] Å equivalent widths for the Bentz et al. (2004) sample is 3.7Å ( 1.5Å), while the equivalent widths of N IV] Å for our quasars are 280.2Å for the DLS source and Å for the Boötes source. This, combined with the non-detection (and possible absorption) of N V Å in the DLS source suggests that these quasars may be of a different ilk than the “nitrogen-enriched” population.
In galaxies with no AGN signature, we are aware of only two other instances of this line being seen in the high-redshift Universe. One especially telling detection is in the spectrum of the Lynx arc, a gravitationally lensed HII galaxy at z=3.357 (Fosbury et al. 2003). The line intensities in this object’s spectrum, strong N IV] Å, O III] Å, and C III] Å, as well as the absence of N V , favor a hot (80,000 K) blackbody over an AGN as the ionizing source. The Fosbury et al. (2003) modeling of the spectrum suggests a top heavy IMF, which is especially interesting since such an IMF is now believed to be characteristic of early, metal poor star formation, e.g. Population III stars. Alternatively, Binette et al. (2003) suggest an obscured AGN as the photoionizing source of the Lynx arc. Their model invokes dense absorbing gas near a central AGN that filters the powerlaw and mimicks the hot blackbody suggested by Fosbury et al. (2003) This model does require at least a weak N V Å line detection.
The second known N IV] Å emitter is a galaxy in the GOODS survey (Vanzella et al. 2006; Fontanot et al. 2007). Similar to the Lynx arc, this object shows an extremely strong Ly line as well as N IV] Å, while N V Å is absent. No detailed analysis has been published on this source as yet.
An alternative possibility is that we are witnessing an evolutionary effect in the quasar broad-emission-line region. This is suggested by the traditional broad-line shape of N IV Å in DLS10530528 as well the peculiar absence (or even absorption) of N V Å in its spectrum. Detailed modeling of such effects is beyond the scope of this paper.
The detection of such a rare emission line in two out of 23
quasars in our sample (i.e., % of the sample) suggests that
it occurs more commonly in low luminosity quasars at high redshifts,
a regime which we are now exploring systematically for the first time.
At these luminosities we are probing deep into the QLF where the effects
of a luminous starbursts can be detected more easily; if there is an
evolutionary trend, such phenomena may be present at high redshifts,
and not in the better studied quasar samples at . As the
sample sizes of comparably faint AGN at these redshifts increase, we will
be able to determine whether this is indeed a systematic evolutionary
effect related to the early stages of co-formation and co-evolution of
galaxies and AGN.
We thank the referee for helpful feedback. We are grateful to the staff of W. M. Keck observatory for their assistance during our observing runs. This work was supported in part by the NSF grant AST-0407448, and by the Ajax foundation. The work of DS was carried out at Jet Propulsion Laboratory, California Institute of Technology, under a contract with NASA.
References
- Baldwin et al. (2003) Baldwin, J. A., Hamann, F., Korista, K. T., Ferland, G. J., Dietrich, M., & Warner, C. 2003, ApJ, 583, 649
- Bentz et al. (2004) Bentz, M. C., Hall, P. B., & Osmer, P. S. 2004, AJ, 128, 561
- Binette et al. (2003) Binette, L., Groves, B., Villar-Martín, M., Fosbury, R. A. E., & Axon, D. J. 2003, A&A, 405, 975
- Bogosavljević et al. (2007) Bogosavljević, M., Glikman, E., Djorgovski, S. G., Mahabal, A., Stern, D., Jannuzi, B. T. & Dey, A., 2007, in preparation
- Dietrich & Hamann (2004) Dietrich, M., & Hamann, F. 2004, ApJ, 611, 761
- Djorgovski (2005) Djorgovski, S. G. 2005, in The Tenth Marcel Grossmann Meeting., ed. M. Novello, S. Perez Bergliaffa, & R. Ruffini, Singapore: World Scientific Publishing, 422
- Eisenhardt et al. (2004) Eisenhardt, P. R. et al. 2004, ApJS, 154, 48
- Elston et al. (2006) Elston, R. J. et al. 2006, ApJ, 639, 816
- Fan (2006) Fan, X. 2006, New Astronomy Review, 50, 665
- Fontanot et al. (2007) Fontanot, F., Cristiani, S., Monaco, P., Nonino, M., Vanzella, E., Brandt, W. N., Grazian, A., & Mao, J. 2007, A&A, 461, 39
- Fosbury et al. (2003) Fosbury, R. A. E. et al. 2003, ApJ, 596, 797
- Ho (2004) Ho, L. C., ed. 2004, in Coevolution of Black Holes and Galaxies, Cambridge, UK: Cambridge University Press, 496
- Hopkins et al. (2006) Hopkins, P. F., Hernquist, L., Cox, T. J., Di Matteo, T., Robertson, B., & Springel, V. 2006, ApJS, 163, 1
- Jannuzi & Dey (1999) Jannuzi, B. T., & Dey, A. 1999, in ASP Conf. Ser. 191, Photometric Redshifts and the Detection of High Redshift Galaxies, ed. R. Weymann et al., 111
- Kauffmann & Haehnelt (2000) Kauffmann, G., & Haehnelt, M. 2000, MNRAS, 311, 576
- Kinney et al. (1996) Kinney, A. L., Calzetti, D., Bohlin, R. C., McQuade, K., Storchi-Bergmann, T., & Schmitt, H. R. 1996, ApJ, 467, 38
- Oke et al. (1995) Oke, J. B., et al. 1995, PASP, 107, 375
- Osmer & Smith (1980) Osmer, P. S., & Smith, M. G. 1980, ApJS, 42, 333
- Stern et al. (2005) Stern, D. et al. 2005, ApJ, 631, 163
- Telfer et al. (2002) Telfer, R. C., Zheng, W., Kriss, G. A., & Davidsen, A. F. 2002, ApJ, 565, 773
- Vanden Berk et al. (2001) Vanden Berk, D. E. et al. 2001, AJ, 122, 549
- Vanzella et al. (2006) Vanzella, E. et al. 2006, A&A, 454, 423
- Vestergaard & Peterson (2006) Vestergaard, M., & Peterson, B. M. 2006, ApJ, 641, 689
- Wittman et al. (2002) Wittman, D. E., Margoniner, V., Tyson, J. A., Cohen, J. G., Becker, A., & Dell’Antonio, I. P. 2002, in Proc. SPIE, 4836, Survey and Other Telescope Technologies and Discoveries., ed. J. A. Tyson & P. S. . Wolff, S., 21
| R.A. | Dec. | [3.6] | [4.5] | |||||
|---|---|---|---|---|---|---|---|---|
| Name | (J2000) | (J2000) | (mag)aaAB magnitudes. All other magnitudes are Vega-based magnitudes. | (mag) | (mag) | (mag) | (mag) | |
| DLS10530528 | 10 53 46.1 | 05 28 59 | 4.02 | 23.83 | 26.4 | |||
| NDWFS14333408 | 14 33 24.5 | 34 08 41 | 3.88 | 22.62 | 21.49 | 19.94 | 19.0 | 19.1 |
| Line Flux | rest-frame EW | FWHM | |
|---|---|---|---|
| Line | (10-16 erg cm-2 s-1) | (Å) | (km s-1) |
| DLS10530528: | |||
| Ly | 762.1 | 1726.8aaThese line widths are from the broad component of a two-component Gaussian fit to the Ly line. See §2 for details on the fitting procedure. | |
| N V | |||
| N IV] | 280.2 | 807.5 | |
| C IV | 91.1 | 1101.5 | |
| NDWFS14333408: | |||
| Ly | 244.6 | 3015.6aaThese line widths are from the broad component of a two-component Gaussian fit to the Ly line. See §2 for details on the fitting procedure. | |
| N V | 11.6 | 1086.9 | |
| N IV] | 24.5 | 524.9 | |
| C IV | 91.1 | 1334.0 | |