Evidence for a jet contribution to the optical/infrared light of neutron star X-ray binaries
Abstract
Optical/near-infrared (optical/NIR; OIR) light from low-mass neutron star X-ray binaries (NSXBs) in outburst is traditionally thought to be thermal emission from the accretion disc. Here we present a comprehensive collection of quasi-simultaneous OIR and X-ray data from 19 low-magnetic field NSXBs, including new observations of three sources: 4U 0614+09, LMC X–2 and GX 349+2. The average radio–OIR spectrum for NSXBs is (where ) at least at high luminosities when the radio jet is detected. This is comparable to, but slightly more inverted than the found for black hole X-ray binaries. The OIR spectra and relations between OIR and X-ray fluxes are compared to those expected if the OIR emission is dominated by thermal emission from an X-ray or viscously heated disc, or synchrotron emission from the inner regions of the jets. We find that thermal emission due to X-ray reprocessing can explain all the data except at high luminosities for some NSXBs, namely the atolls and millisecond X-ray pulsars (MSXPs). Optically thin synchrotron emission from the jets (with an observed OIR spectral index of ) dominate the NIR light above erg s-1 and the optical above erg s-1 in these systems. For NSXB Z-sources, the OIR observations can be explained by X-ray reprocessing alone, although synchrotron emission may make a low level contribution to the NIR, and could dominate the OIR in one or two cases.
keywords:
accretion, accretion discs – ISM: jets and outflows – stars: neutron – X-rays: binaries1 Introduction
In low-mass neutron star X-ray binary (NSXB) systems, matter is accreted onto a neutron star from a companion via a disc which radiates in the optical, ultraviolet and X-ray regimes. Some of the accreting matter and energy in X-ray binaries (XBs) can be released from the system through collimated outflows (jets). Evidence for jets associated with NSXBs date back more than a decade (Stewart et al., 1993; Bradshaw, Fomalont & Geldzahler, 1999; Fomalont, Geldzahler & Bradshaw, 2001) but not until recently has the evidence emerged from any waveband other than the radio. Callanan et al. (2002) found that infrared -band flaring in the ‘Z-source’ NSXB GX 17+2 could not be explained by an X-ray driven wind or reprocessed X-rays, but shared many properties with the radio (i.e. jet) variability previously seen in the same source. It is worth noting that the near-infrared (NIR) counterpart of GX 13+1 is also largely variable (Charles & Naylor, 1992). Recently, Migliari et al. (2006) for the first time spectrally detected optically thin synchrotron emission from the jets of an ‘atoll’ NSXB 4U 0614+09 in the mid-infrared.
In the optical regime, many spectral and timing studies of NSXBs have established the presence of an accretion disc reprocessing X-ray photons to optical wavelengths (e.g. McClintock et al., 1979; Lawrence et al., 1983; Kong et al., 2000; McGowan et al., 2003; Hynes et al., 2006). In quiescence, the companion star can come to dominate the optical/NIR (OIR) emission (e.g. Thorstensen, Charles & Bowyer, 1978; Chevalier et al., 1989; Shahbaz, Naylor & Charles, 1993), as is the case in high-mass X-ray binaries (e.g. van den Heuvel & Heise, 1972) and low-mass X-ray binaries that accrete from a giant star. X-ray reprocessing is generally thought to dominate the OIR emission of non-quiescent NSXBs (see van Paradijs & McClintock 1995 for a review; see also Chen, Shrader & Livio 1997; Charles & Coe 2006). In low-mass black hole candidate X-ray binaries (BHXBs), additional OIR emission mechanisms have been observed, in particular from the viscously heated disc (e.g. Kuulkers, 1998; Brocksopp et al., 2001; Homan et al., 2005) and from compact jets (e.g. Han & Hjellming 1992; Fender 2001; Corbel & Fender 2002; Hynes et al. 2003; Brocksopp, Bandyopadhyay & Fender 2004; Buxton & Bailyn 2004; Russell et al. 2006).
Recently, an anomalous transient NIR excess has been observed in a number of millisecond X-ray pulsar (MSXP) NSXBs at high luminosities, which is equivocal in nature. The source most studied is SAX J1808.4–3658, for which Wang et al. (2001) found a NIR flux almost one order of magnitude too bright to originate from X-ray heating. The NIR flux density was comparable to a radio detection of 0.8 mJy (with a flat 2.5–8.6 GHz spectrum) seen one week after the NIR excess. Greenhill, Giles & Coutures (2006) also reported an -band excess in a different outburst of the same source, which they attributed to synchrotron emission. In addition, a variable - and -band excess in XTE J0929–314 seen on the same day as a radio detection (Giles et al., 2005), and a transient NIR excess in XTE J1814–338 (Krauss et al., 2005) and IGR J00291+5934 (Torres et al., 2007) were all interpreted as synchrotron emission from the jets in the systems. The NIR excess appears to be ubiquitously absent at lower luminosities.
Steady, partially self-absorbed jets probably exist in low-magnetic field ( G) NSXBs in hard X-ray states (Migliari & Fender, 2006; Massi, 2006). These include ‘atoll-type’ sources in the ‘island’ state, ‘Z-type’ sources in the ‘horizontal branch’ and possibly the ‘normal branch’111These states correspond to the position of the source in the X-ray colour–colour diagram; see Hasinger & van der Klis 1989. and transients at low accretion rates () such as MSXPs. Massi (2006) shows on theoretical grounds that the existence of jets in NSXBs depends on the magnetic field and mass accretion rate, and the conditions required for jet ejection are probably fulfilled for most of the NSXBs (Z-sources, atolls and MSXPs) with known magnetic field strengths. In Russell et al. (2006; hereafter Paper I), we predicted that emission from the jets could contribute or even dominate the OIR light of NSXBs at high X-ray luminosities, for sources in a hard X-ray state. This is expected if (a theoretical relation supported by radio–X-ray observations; Migliari & Fender, 2006) and (where XR is X-ray reprocessing in the disc), as is predicted and observed (van Paradijs & McClintock 1994; Paper I). In the sample of Paper I there were too little data at high X-ray luminosities to test this prediction for NSXBs.
In this paper we analyse quasi-simultaneous OIR and X-ray data and OIR spectra of a large, comprehensive sample of NSXBs in order to constrain the -dependent dominating OIR emission processes and to test the above prediction. Data are collected from transient NSXBs: atolls, MSXPs and Z-sources. We use the technique (Paper, I) of comparing the relations between the quasi-simultaneous OIR and X-ray fluxes with the relations predicted from models of three OIR emission processes: a viscously heated disc, an X-ray reprocessing disc and synchrotron-emitting jets. We also inspect the spectral index of the OIR continuum, which differs largely between emission from the disc and from the jets. If the radio/OIR jet behaviour is ubiquitous in NSXBs, its properties will constrain many parameters in these systems, in particular the power of the jets (if the jet radiative efficiency can be constrained) and the wavelength-dependent jet contribution at a given X-ray luminosity.
2 methodology & results
A wealth of OIR and X-ray data from atolls, Z-sources and MSXPs were collected from the literature and converted to intrinsic luminosities (or monochromatic luminosities) in the same manner as described in Section 2 of Paper I. Much of the data we use here were obtained for Paper I, however we have sought additional quasi-simultaneous OIR and X-ray data (and OIR spectral energy distributions; SEDs, which were not collected for Paper, I) for the purposes of obtaining a comprehensive sample for this work (see Tables 1 and 2 for the references of the new data).
Estimates of the distance to each source, the optical extinction and the HI absorption column used here are listed in Table 2 of Paper I and Table 1 of this paper. No data were included for which the OIR contribution of the companion star could be significant (i.e. quiescence for most sources) unless this contribution is known. For these data we subtracted the star light contribution. For the Z-sources, OIR data were only included when the OIR fluxes were significantly higher than the lowest measured for each source in each waveband, to ensure minimal contamination from the companion. When two or more OIR wavebands were quasi-simultaneous, OIR SEDs were produced in order to spectrally constrain the origin of the OIR emission. In addition to the data collected from the literature, we obtained OIR photometry of three NSXBs using two telescopes; the observations and data reduction are discussed in the following subsections.
While quasi-simultaneity was achieved in most cases with use of the RXTE ASM X-ray daily monitoring, this is not possible for some historical OIR observations. In these cases we include the data only in the OIR SEDs. Similarly, for some sources OIR–X-ray quasi-simultaneity was achieved, but there was only one OIR waveband available so OIR colours and SEDs were not obtained (e.g. GX 17+2). Quasi-simultaneous OIR–X-ray data were available for five sources (LMC X–2, Cyg X–2, Cen X–4, 4U 0614+09 and Aql X–1) before the advent of the RXTE (Kaluzienski, Holt & Swank, 1980; Canizares, McClintock & Grindlay, 1980; Charles et al., 1980; Bonnet-Bidaud et al., 1989; Hasinger et al., 1990; van Paradijs et al., 1990; Machin et al., 1990).
| Source | Type | Distance | Period | / | / | Fluxes - | ||||
|---|---|---|---|---|---|---|---|---|---|---|
| = alternative | / kpc | / hours | / | / | 10 | (band, | days | data | ||
| name | (ref) | (ref) | (ref) | (ref) | (ref) | (ref) | ref) | refs | ||
| (I) | (II) | (III) | (IV) | (V) | (VI) | (VII) | (VIII) | (IX) | (X) | (XI) |
| IGR | MSXP | 2.81.0 | 2.457 | 1.4 | 0.039– | 2.50.3 | 4.640.58 | - | 1.0 | 1, 36 |
| J00291+5934 | (1) | (13) | (16) | 0.160 (16) | (1) | (1) | ||||
| LMC X–2 | Z-source | 5010 | 8.16 | 0.15 | 0.910.07 | - | 0.5 | 20, 37, | ||
| = 4U 0520–72 | (2, 3) | (14) | (17) | (17) | (20) | (29) | 38 | |||
| XTE J0929–314 | MSXP | (4) | 0.726 | - | 0.420.10 | 0.760.24 | - | 1.0 | 21, 37 | |
| = INTREF 390 | () | (14) | (4) | (21) | (30) | |||||
| Cir X–1 | Z-source | 9.21.4 | 398 | - | 41 | 10.51.5 | 193 | - | 0.2 | 37, 39, |
| = BR Cir | (5) | (5) | (18) | (22) | (22) | 40, 41 | ||||
| XTE J1701–462 | Z-source | 8.58.0 | - | - | - | 94 | 95 | - | 0.5 | 37, 42 |
| (6) | (23)∗ | (6) | ||||||||
| GX 349+2 | Z-source | 9.250.75 | - | - | - | 51 | 7.71.0 | - | 1.0 | 7, 37, |
| = Sco X–2 | (7) | (7) | (31) | 38 | ||||||
| XTE J1814–338 | MSXP | 8.01.6 | 4.27 | - | 0.710.10 | 1.630.21 | - | 1.0 | 19, 37 | |
| (8) | (5) | (19) | (19) | (19) | ||||||
| GX 13+1 | Z-source | 71 | - | - | - | 15.32.3 | - | - | 1.0 | 24 |
| = 4U 1811–17 | (9) | (24) | ||||||||
| GX 17+2 | Z-source | 8.02.4 | - | - | - | 12.51.5 | 152 | - | 1.0 | 37, 43 |
| = 4U 1813–14 | (10) | (25) | (32) | |||||||
| HETE | MSXP | 51 | 1.39 | - | 0.016–0.07 | 0.890.22 | 1.60.4 | - | 2.0 | 26, 37, |
| J1900.1–2455 | (11, 12) | (15) | (15) | (26)∗ | (26) | 44, 45 | ||||
| XTE J2123–058 | Atoll | 18.42.7 | 5.96 | 1.3 | 0.60 | 0.370.15 | 0.660.27 | 0.77 (R, | - | 35, 46 |
| = LZ Aqr | (5) | (5) | (14) | (14) | (27) | (27)† | 34, 35) | |||
| Cyg X–2 | Z-source | 13.42.0 | 236.2 | 1.78 | 0.60 | 1.240.22 | 1.90.5 | - | 1.0 | 47, 48 |
| = V1341 Cyg | (5) | (5) | (14) | (14) | (28) | (33) |
Columns give: (I) source names; (II) X-ray classification; (III) distance estimate; (IV) orbital period of the system; (V) mass of the neutron star in solar units (assumed to be if unconstrained); (VI) mass of the companion star in solar units; (VII) and (VIII) interstellar reddening in -band, and interstellar HI absorption column ( and are estimated here from the relation ; Predehl & Schmitt 1995); (IX) the companion star OIR luminosity contribution in quiescence; (X) The maximum time separation, , between the OIR and X-ray observations defined as quasi-simultaneous; (XI) References for the quasi-simultaneous OIR and X-ray fluxes collected. References: (1) Torres et al. (2007); (2) Boyd et al. (2000); (3) Kovács (2000); (4) Galloway et al. (2002); (5) Jonker & Nelemans (2004); (6) Kennea et al. (2006); (7) Wachter & Margon (1996); (8) Strohmayer et al. (2003); (9) Bandyopadhyay et al. (1999); (10) Kuulkers et al. (2002); (11) Kawai & Suzuki (2005); (12) Galloway et al. (2005b); (13) Shaw et al. (2005); (14) Ritter & Kolb (2003); (15) Kaaret et al. (2006); (16) Galloway et al. (2005a); (17) Crampton et al. (1990); (18) Johnston, Fender & Wu (1999); (19) Krauss et al. (2005); (20) Bonnet-Bidaud et al. (1989); (21) Giles et al. (2005); (22) Jonker, Nelemans & Bassa (2007); (23) Produit et al. (2006); (24) Charles & Naylor (1992); (25) Deutsch et al. (1999); (26) Steeghs et al. (2005b); (27) Hynes et al. (2001); (28) McClintock et al. (1984); (29) Schulz (1999); (30) Juett, Galloway & Chakrabarty (2003); (31) Iaria et al. (2004); (32) Vrtilek et al. (1991); (33) Costantini, Freyberg & Predehl (2005); (34) Casares et al. (2002); (35) Shahbaz et al. (2003); (36) Steeghs et al. (2004); (37) RXTE ASM; (38) this paper; (39) Shirey (1998); (40) Glass (1978); (41) Moneti (1992); (42) Maitra & Bailyn (2006); (43) Callanan et al. (2002); (44) Fox (2005); (45) Steeghs et al. (2005a); (46) Tomsick et al. (2004); (47) Hasinger et al. (1990); (48) van Paradijs et al. (1990); (49) van Paradijs et al. (1980); (50) Corbel et al. (1998); (51) Wachter (1997); (52) Gilfanov et al. (1998); (53) Campana et al. (2004); (54) Greenhill et al. (2006); (55) Bailyn, Neil & Maitra (2006)
2.1 Observations with the Danish 1.54-m Telescope
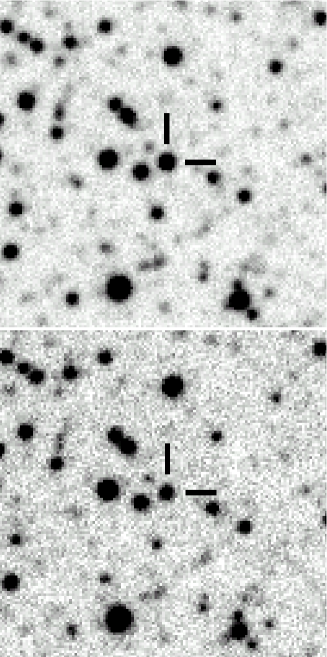
-band imaging of two Z-sources, GX 349+2 and LMC X–2, were taken in July 2001 using the camera on the Danish Faint Object Spectrograph and Camera (DFOSC). Table 3 lists the observations used in this work. De-biasing and flat fielding was performed with IRAF and aperture photometry of the targets and the standard star LTT 7987 ( = 12.23 mag; = 12.29; = 12.37; = 12.50; Hamuy et al. 1992; 1994) was achieved using PHOTOM. GX 349+2 was detected with a significance of in all exposures (most were detections). For LMC X–2 we aligned and combined the six exposures in each filter on MJD 52115 to achieve a higher signal-to-noise ratio (S/N). No combined images were created from the observations of this source on MJD 52117 as the S/N was sufficiently high for photometry. LMC X–2 was detected at a significance level of in the -band images and in all other images used in this work. In Fig. 1 we present the finder charts for LMC X–2.
The measured fluxes were accounted for airmass-dependent atmospheric extinction according to Burki et al. (1995). We flux-calibrated the data using LTT 7987. For GX 349+2 we measured the flux of three stars in the field of view with known and -band magnitudes (stars 2, 5 and 7 listed in Wachter & Margon, 1996) and found their magnitudes to differ from those previously reported by mag. The resulting fluxes obtained for GX 349+2 and LMC X–2 were de-reddened to account for interstellar extinction using the values of listed in Table 1 (, and were calculated according to the recipe in Paper I).
2.2 UKIRT Observations of 4U 0614+09
NIR imaging of 4U 0614+09 was obtained with the 3.8 m United Kingdom Infrared Telescope (UKIRT) on 2002 February 14 (MJD 52319.3), using UFTI, the UKIRT Fast Track Imager (Roche et al., 2003). Jittered observations of 4U 0614+09 were made in the , and filters, with 930 s exposures in both and , and 960 s exposures in . The infrared standard star FS 120 ( = 11.335 mag; = 10.852; = 10.612) was also observed for a total of 50 s, 25 s and 25 s in , and , respectively. The airmass of the standard and 4U 0614+09 were very similar: 1.004–1.036. The ‘JITTER-SELF-FLAT’ data reduction recipe was used, which created a flat field from the sequence of 9 jittered object frames and a dark frame. After dark subtraction and flat fielding, a mosaic was generated from the 9 object frames.
Photometry was carried out using IRAF. 4U 0614+09 was detected with a significance of 7.1 in , 15.3 in and 11.5 in . Flux calibration was achieved using FS 120, yielding the following de-reddened () flux densities for 4U 0614+09: mJy; mJy; mJy (the apparent reddened magnitudes are ; ; ).
| Source | Classifi- | / | Fluxes - new |
| cation | days | data references | |
| IGR J00291+5934 | MSXP | 1.0 | 1 |
| 4U 0614+09 | Atoll | 0.5 | 38 |
| CXOU 132619.7– | unknown | - | - |
| 472910.8 | |||
| Cen X–4 | Atoll | 0.5 | 49 |
| 4U 1608–52 | Atoll | 1.0 | 50, 51 |
| Sco X–1 | Z-source | 1.0 | - |
| SAX J1808.4–3658 | MSXP | 1.0 | 37, 52, 53, 54 |
| Aql X–1 | Atoll | 0.5 | 37, 55 |
References: see caption of Table 1.
2.3 Results
In the upper panels of Figs. 2 and 3 we plot the quasi-simultaneous OIR and X-ray data. The OIR monochromatic luminosity, is plotted against (where is the orbital separation) in Fig. 2 in order to test the X-ray reprocessing model. In Fig. 3, is plotted against : the plot necessary to test the models of jet and viscous disc OIR emission (Paper, I). These plots are the same as the left and right panels of Fig. 5 in Paper I, with the new NSXB data added and the data from BHXBs removed.
The orbital separations, as with Paper I, are inferred from the best known estimates of the orbital period and masses of the neutron star and companion (listed in Table 1, and Table 2 of Paper I). For systems with observationally unconstrained neutron star masses, we assume . We do not include data in Fig. 2 from systems in which the orbital period or the companion mass is unconstrained. We note that data from Cir X–1 in Fig. 2 (open circles in the top right corner of the figure) may not be representative because its orbit is eccentric and so the orbital separation cannot be accurately inferred using this method.
| MJD | Target | Exposures | Integration time / exp. | Apparent magnitudes (not de-reddened) | ||||||
|---|---|---|---|---|---|---|---|---|---|---|
| /filter | V | R | I | Z | V | R | I | Z | ||
| 52114.07–.25 | GX 349+2 | 9 | 300 | 200 | 120 | 120 | 18.46–18.62 | 17.44–17.62 | 16.54–16.65 | 16.04–16.24 |
| 52114.99–5.07 | GX 349+2 | 4 | 300 | 200 | 120 | 120 | 18.32–18.57 | 17.35–17.53 | 16.47–16.58 | 16.07–16.17 |
| 52115.30–.31 | LTT 7987 | 1 | 2 | 2 | 4 | 6 | ||||
| 52115.35–.43 | LMC X–2 | 6 | 120 | 120 | 180 | 240 | 19.190.07 | 19.010.07 | 18.910.07 | 19.120.14 |
| 52117.37–.44 | LMC X–2 | 2 | 120 | 120 | 180 | 300 | 18.470.07 | 18.430.07 | 18.450.08 | 18.570.26 |
MJD 52114.0 corresponds to 2001-07-24.0 UT. The filters used were Bessel , Bessel , Gunn and Gunn . LTT 7987 is the standard star used for flux calibration. For GX 349+2 the range of magnitudes measured are tabulated, whereas for LMC X–2 we tabulate the magnitudes from the combined images.
The power law lines in Figs. 2 and 3 represent the expected correlations for X-ray reprocessing (van Paradijs & McClintock, 1994) and jet emission (solid line; Migliari & Fender, 2006; Paper, I), respectively. The jet model is normalised to the observed radio–X-ray data (Migliari & Fender, 2006) assuming a flat (optically thick) radio–OIR jet spectrum and the X-ray reprocessing model is normalised to the the optical () NSXB data of Paper I. The dotted power laws in Fig. 2 represent the expected relation for NIR data dominated by X-ray reprocessing assuming an OIR spectral index of and (where ). Although the different orbital inclinations between these sources could change the X-ray and OIR luminosities observed and hence these X-ray–OIR relations, we showed in Paper I that inclination doesn’t appear to play a significant role.


The lower panels of Figs. 2 and 3 describe the dependence of the shape of the OIR spectrum with and , respectively. The spectral index is calculated for all OIR data where two or more optical or NIR data points are quasi-simultaneous. The spectral index of the optical (using data in the , or -bands) and NIR (, , , or -bands) data are shown separately. We define the -band as the break between optical and NIR here because it is often the colours that indicate the NIR excess (and for many of these observations data were not obtained). For consistency (and to separate the two wavebands used to calculate ) we use the two lowest frequency NIR bandpasses in each OIR SED to calculate and the two highest frequency optical bands to calculate . Data from the Z-sources are shown as different symbols to the atolls/MSXPs because the spectral index of the former group appears to behave differently to that of the latter (see Section 3.2).
We have also compiled luminosity-calibrated OIR SEDs of 17 NSXBs (Fig. 4). The references for the data are listed in Tables 1 and 2, and Table 2 of Paper I. In Section 3 we attempt to interpret the OIR–X-ray plots and OIR SEDs in terms of the dominating optical and NIR emission processes.
3 Interpretation & Discussion
3.1 OIR – X-ray Relations
In the upper panels of Figs. 2 and 3 we improve on Fig. 5 of Paper I with a larger sample of NSXB data. Focusing on the upper panel of Fig. 3, we see that the global relation for NSXBs (Paper, I) does not hold at high X-ray luminosity ( erg s-1); the OIR is more luminous than expected from this relation. This is inconsistent with the model for emission from a viscously heated disc (Paper, I), which requires a relation for optical data and for NIR (Fig. 3). We can therefore rule out a viscous disc origin to the OIR emission, at least at erg s-1.
The upper panel in Fig. 3 shows that the jet model lies close to the data at high , suggesting the OIR enhancement at these luminosities may be caused by the domination of the jet. The jet model cannot describe the data at low ( erg s-1). However, the upper panel of Fig. 2 indicates that all the optical data also lie close to the expected relation for X-ray reprocessing in the disc. Hence, only the data above erg s-1 could arise due to the presence of a jet.
The Z-sources, which tend to have much longer orbital periods (and hence larger orbital separations) than atolls and MSXPs, dominate the highest X-ray luminosities. These sources spend most of their time in a soft X-ray state and in fact have radio luminosities lower than predicted by the NSXB hard state radio–X-ray relation if the radio emission originates in the jet (Migliari & Fender, 2006). We would therefore expect the OIR emission from the jets in Z-sources to also be lower than the model in Fig. 3 unless the radio–OIR jet spectrum is inverted (positive). In fact from Fig. 3 of Migliari & Fender (2006) we see that at erg s-1, erg s-1 and so from Fig. 3 here, the radio–OIR spectral index for Z-sources222At erg s-1 we can calculate the spectral index between radio and OIR for Z-sources since we know the radio and OIR luminosities. is . With this information alone, the jets can only dominate the OIR of Z-sources if the radio–OIR spectrum is inverted.
3.2 OIR Spectral Index – X-ray Relations
Since the dominating OIR emission processes in NSXBs are unclear (at least at high ) from the OIR–X-ray relations, we now turn to the OIR spectra. We see from the lower panel of Fig. 3 that there is a relation between and for MSXPs and atolls: the NIR spectrum becomes redder at higher luminosities. Quantitatively, becomes negative when erg s-1 and is positive for all data below erg s-1. This is opposite to the behaviour of BHXBs, where there is evidence in some systems for the OIR spectrum in the hard state to become redder at low luminosities (Paper, I). If the origin of the emission is the disc blackbody, we would expect a bluer (hotter) spectrum at higher luminosities.
The only process expected to produce an OIR spectrum of index at high luminosities in these systems is optically thin synchrotron. It is therefore intriguing that for atolls and MSXPs when ergs-1 s-1; the X-ray luminosity range in which the jet could play a role (Fig. 3, upper panel). Since there are just five NIR data points in the lower panel of Fig. 3 below erg s-1, we perform a Kolmogorov-Smirnov (K-S) test to quantify the significance of the apparent – relation for the atolls/MSXPs. We use the ‘Numerical recipes in FORTRAN’ (Press et al., 1992) routine ‘kstwo’ which is the K-S test for two data sets, to determine if the values of differ significantly below and above erg s-1. The maximum difference between the cumulative distributions is with a corresponding probability of ; i.e. the probability that the NIR spectral index of the data below erg s-1 belongs to the same population as the data above erg s-1 is 0.05 percent.
In addition, we have carried out a Spearman’s Rank correlation test on the – and – data of atolls/MSXPs (Table 4). We find an anti-correlation between and at the 3.8 confidence level, supporting the above K-S test results. We do not find a significant relation between and except when we impose a somewhat arbitrary X-ray luminosity cut: for data above erg s-1 there is an anti-correlation at the 3.5 confidence level. This again could be due to the jet contribution dominating at these highest luminosities. The confidence of this result should be taken with caution as it could be dominated by the group of data with the highest values which happen to lie just above the erg s-1 cut.
| OIR data | Range in | Correlation | Significance |
|---|---|---|---|
| used | (erg s-1) | coefficient | |
| all | 3.8 | ||
| all | 0.8 | ||
| 3.5 |
The optical spectral index is generally positive for atolls and MSXPs (Fig. 3 lower panel), but decreases at erg s-1. We would expect to become negative at a higher X-ray luminosity than if the origin of the redder emission component is the jets. As the X-ray luminosity is increased, the optically thin synchrotron jet component will dominate over X-ray reprocessing in the NIR bands before the optical as the jet component has a negative spectral index. At erg s-1, is negative in 63 percent of the optical data of atolls/MSXPs. Below erg s-1 this is 7 percent. These few data in the latter group with are at low ( erg s-1) and may be due to cooler accretion discs (possibly like the BHXBs; Paper, I). However, the mean uncertainty in the values of are fairly large, so we can only make conclusions from general trends and not individual data points.

Almost all of the spectra of the Z-sources are blue (; Fig. 3 lower panel). This supports the suggestion in Section 3.1 that X-ray reprocessing dominates the OIR of the Z-sources due to their larger accretion discs and lower radio jet luminosities (at a given ). The Z-sources cannot be dominated by optically thin synchrotron emission as this requires . Since the radio–OIR spectrum of Z-sources is (Section 3.1), the optically thick part of the jet spectrum could dominate the OIR if also (although this requires the optically thick/thin break to be in the optical regime or bluer). is observed for most of the data from the Z-sources (Fig. 3 lower panel), which implies this is not the case, however we cannot rule out an optically thick jet origin to a few of the OIR Z-source data (those with lower spectral index).
The lower panel of Fig. 2 shows how the optical and NIR spectral index changes with . The Z-source data in this panel have the largest values of . The expected level of OIR emission from reprocessing in the disc in these systems is larger than that of the atolls/MSXPs due to their larger accretion discs and higher X-ray luminosities, further supporting the X-ray reprocessing scenario.
3.3 The OIR SEDs
The SEDs of individual sources in Fig. 4 allow us to see how the luminosity-dependent optical and NIR spectral indices differ between sources. We group the panels in Fig. 4 into the different types of NSXB: MSXPs in the upper panels, then atolls, then Z-sources in the lower panels.
One can visually see a NIR excess () joining a blue () optical spectrum in the SEDs of four of the five MSXPs (the ‘V’-shape). This is indicative of two separate spectral components and is observed in at least three hard state BHXBs (Corbel & Fender, 2002; Homan et al., 2005; Paper, I), where it is interpreted as the optically thin jet spectrum meeting the thermal spectrum of the accretion disc. The NIR excess disappears at low luminosities in a total of four outbursts of three MSXPs; no NIR excess is seen below erg s-1 Hz-1 in any MSXP or in fact any NSXB.
Of the five atolls in Fig. 4, one (Aql X–1; the atoll with the most data and highest luminosity) has a negative spectral index; more-so at high luminosity. There is little NIR coverage of atolls in the literature (at least at high luminosities) and from the data we have, the OIR SEDs are positive in all sources except Aql X–1, consistent with the disc dominating the OIR. The optical spectral index for Aql X–1 is very negative at the highest luminosities, suggesting all of the OIR was dominated by the jets during the peak of the bright 1978 outburst of this source. The SED of 4U 0614+09 flattens (becomes redder) in the NIR; this is known to be where the disc spectrum meets that of the jet (Migliari et al., 2006).
There is no evidence for a jet () component contributing to the OIR spectra of any of the seven Z-sources in Fig. 4. As was shown above, the jets should be OIR-bright in Z-sources but because of their larger discs, X-ray reprocessing dominates. For the new transient Z-source XTE J1701–462 (Homan et al., 2007), the optical extinction is not well constrained and we show three SEDs in Fig. 4 of the same data, using different values of to illustrate the possible range in spectral indices (we have not included any data from XTE J1701–462 in the lower panels of Figs. 2 or 3 because of these uncertainties in ).
3.4 The Full Picture
From the information gathered in Sections 3.1–3.3, the picture is now emerging of the dominating OIR emission processes for the different types of NSXB at different luminosities. For NSXBs at low luminosities ( erg s-1), the correlations and spectra are consistent with X-ray reprocessing dominating the OIR. The data are inconsistent with emission from the jets at these luminosities.
We can rule out a viscously heated disc origin to the NIR data of all NSXBs since that requires which is not observed (Fig. 3). Similarly the viscous disc cannot dominate the optical light of NSXBs at erg s-1 but could below this luminosity as is required and observed. The jets dominate the NIR and optical light of atolls/MSXPs above and erg s-1 respectively, as the spectral indices of the continuum cannot be explained by thermal emission. The SEDs of the transient NSXBs with the best sampling show the physical disappearance at low luminosity of a NIR excess which is present at high luminosity. These observations are also consistent with the jet OIR–X-ray model.
For Z-sources, the OIR–X-ray relations and OIR spectra are consistent with emission from X-ray reprocessing. The jets and viscously heated disc can be ruled out in most Z-sources, however the optical and NIR spectral indices in a few observations are also consistent with an optically thick jet which extends from the (measured) radio flux.
We can make a direct measurement of the jet radio–NIR spectral index for the atolls/MSXPs, using the NIR data which are dominated by the jets. In the luminosity range erg s-1, the NIR data with a negative spectral index is on average 0.70 dex more luminous than expected from the jet model (which assumes a flat radio–NIR spectrum; we know the radio luminosity at this from Migliari & Fender, 2006). Some low level contribution from the disc could only partly explain this excess. The corresponding radio–NIR spectral index in that range of is (0.70 dex in luminosity divided by 4.5 dex in frequency between radio and NIR). The optically thick to optically thin break frequency in NSXBs is thought to be in the mid-IR (Migliari et al., 2006), making the optically thick radio–mid-IR jet spectrum more inverted; . The spectral evidence for the existence of synchrotron-emitting jets in NSXBs presented in this paper (and showed for the first time by Migliari et al., 2006), along with radio detections which are sometimes resolved (see Fomalont et al., 2001; Migliari & Fender, 2006), have direct implications for the local conditions and accretion processes in NSXBs. For example, according to Massi (2006), a jet can only occur if the magnetic field intensity and mass accretion rate are constrained thus:
From Table 1 of Massi (2006), MSXPs only satisfy this condition if we adopt the largest mass accretion rates and smallest magnetic field strengths measured. Empirically we do see the jet only at high luminosities and hence high mass accretion rates. The atolls and Z-sources more easily satisfy the condition for jet production, except for the highest magnetic field strengths measured in Z-sources. Since we know jets exist in all three flavours of NSXB at least at high luminosities, perhaps the measured mass accretion rates and magnetic field strengths are under- and over-estimated respectively, in some cases.
4 Conclusions
We have shown that the dominating OIR emission processes in NSXBs vary with X-ray luminosity and between source types (atolls/MSXPs and Z-sources). However, a clearer picture seems to emerge than the dominating emission processes of BHXBs (Paper, I). Models predict that X-ray reprocessing in the accretion disc should dominate the OIR at low luminosities and the jets, if present, should dominate at high luminosities for NSXBs with relatively small accretion discs.
From the observed spectral index of the OIR continuum and from OIR–X-ray relations we show that this is the case in atolls and MSXPs: the jets dominate the NIR and optical emission above erg s-1 and erg s-1, respectively. Below these luminosities X-ray reprocessing dominates, although we cannot rule out a viscously heated disc origin to the optical emission. We have shown that the radio–NIR spectral index of the jets in the atolls/MSXPs is slightly inverted: , at least at high X-ray luminosities (– erg s-1). In the Z-sources, which have larger discs, we find that X-ray reprocessing is responsible for all OIR emission, and the radio–OIR jet spectrum has to be (otherwise the jet spectrum would dominate over the disc). However, the optically thick part of the jet spectrum could dominate in a few cases.
Evidence for the existence of NSXB jets is mounting both from radio detections (which are sometimes resolved; see e.g. Fomalont et al., 2001) and spectrally from higher frequency observations (Migliari et al. 2006; this paper). The power carried in NSXB jets is sensitive to the position of the break between optically thick and thin emission in its spectrum, and is currently a topic of debate. This is constrained in 4U 0614+09 (Migliari et al., 2006), where it is likely to lie in the mid-infrared. Mid-infrared and NIR photometry and polarimetry could shed light on this; optically thin synchrotron emission is expected to be highly polarised if the magnetic field is ordered.
Acknowledgements. Based on observations made with the Danish 1.54-m Telescope at the La Silla Observatory and the United Kingdom Infrared Telescope, which is operated by the Joint Astronomy Centre on behalf of the UK Particle Physics and Astronomy Research Council. We thank the anonymous referee for thorough comments on the manuscript.
References
- Bailyn et al. (2006) Bailyn C., Neil E., Maitra D., 2006, ATel, 869
- Bandyopadhyay et al. (1999) Bandyopadhyay R. M., Shahbaz T., Charles P. A., Naylor T., 1999, MNRAS, 306, 417
- Bonnet-Bidaud et al. (1989) Bonnet-Bidaud J. M., Motch C., Beuermann K., Pakull M., Parmar A. N., van der Klis M., 1989, A&A, 213, 97
- Boyd et al. (2000) Boyd, P. T., Smale, A. P., Homan, J., Jonker, P. G., van der Klis, M., Kuulkers, E. 2000, ApJ, 542, L127
- Bradshaw et al. (1999) Bradshaw C. F., Fomalont E. B., Geldzahler B. J., 1999, ApJ, 512, L121
- Brocksopp et al. (2001) Brocksopp C., Jonker P. G., Fender R. P., Groot P. J., van der Klis M., Tingay S. J., 2001, MNRAS, 323, 517
- Brocksopp et al. (2004) Brocksopp C., Bandyopadhyay R. M., Fender R. P. 2004, NewA, 9, 249
- Burki et al. (1995) Burki G., Rufener F., Burnet M., Richard C., Blecha A., Bratschi P., 1995, A&AS, 112, 383
- Buxton & Bailyn (2004) Buxton, M. M., Bailyn, C. D. 2004, ApJ, 615, 880
- Callanan et al. (2002) Callanan P. J., et al., 2002, ApJ, 574, L143
- Campana et al. (2004) Campana S., et al., 2004, ApJ, 614, L49
- Canizares et al. (1980) Canizares C. R., McClintock J. E., Grindlay J. E., 1980, ApJ, 236, L55
- Casares et al. (2002) Casares J., Dubus G., Shahbaz T., Zurita C., Charles P. A., 2002, MNRAS, 329, 29
- Charles et al. (1980) Charles P. A., et al., 1980, ApJ, 237, 154
- Charles & Naylor (1992) Charles P. A., Naylor T., 1992, MNRAS, 255, P6
- Charles & Coe (2006) Charles P. A., Coe M. J., 2006, in Compact Stellar X-Ray Sources, eds. Lewin W. H. G., van der Klis M., Cambridge University Press, p. 215
- Chen et al. (1997) Chen W., Shrader C. R., Livio M., 1997, ApJ, 491, 312
- Chevalier et al. (1989) Chevalier C., Ilovaisky S. A., van Paradijs J., Pedersen H., van der Klis M., 1989, A&A, 210, 114
- Corbel et al. (1998) Corbel S., Hannikainen D., Gonzalez J. F., Hainaut O. R., 1998, IAUC, 6824
- Corbel & Fender (2002) Corbel S., Fender R. P., 2002, ApJ, 573, L35
- Costantini et al. (2005) Costantini E., Freyberg M. J., Predehl P., 2005, A&A, 444, 187
- Crampton et al. (1990) Crampton D., Hutchings J. B., Cowley A. P. Schmidtke P. C., Thompson I. B., 1990, ApJ, 355, 496
- Deutsch et al. (1999) Deutsch E. W., Margon B. A., Scott F., Wachter S., Goss W. M., 1999, ApJ, 524, 406
- Fender (2001) Fender R. P., 2001, MNRAS, 322, 31
- Fomalont et al. (2001) Fomalont E. B., Geldzahler B. J., Bradshaw C. F., 2001, ApJ, 558, 283
- Fox (2005) Fox D. B., 2005, ATel, 526
- Galloway et al. (2002) Galloway D. K., Chakrabarty D., Morgan, E. H., Remillard R. A., 2002, ApJ, 576, L137
- Galloway et al. (2005a) Galloway, D. K., Markwardt, C. B., Morgan, E. H., Chakrabarty, D., Strohmayer, T., E. 2005a, ApJ, 622, L45
- Galloway et al. (2005b) Galloway D., Morgan E., Kaaret P., Chakrabarty D., Butler N., Suzuki M., 2005b, ATel, 657
- Giles et al. (2005) Giles A. B., Greenhill J. G., Hill K. M., Sanders E., 2005, MNRAS, 361, 1180
- Gilfanov et al. (1998) Gilfanov M., Revnivtsev M., Sunyaev R., Churazov E., 1998, A&A, 338, L83
- Glass (1978) Glass I. S., 1978, MNRAS, 183, 335
- Greenhill et al. (2006) Greenhill J. G., Giles A. B., Coutures C., 2006, MNRAS, in press
- Hamuy et al. (1992) Hamuy M., Walker A. R., Suntzeff N. B., Gigoux P., Heathcote S. R., Phillips M. M., 1992, PASP, 104, 533
- Hamuy et al. (1994) Hamuy M., Suntzeff N. B., Heathcote S. R., Walker A. R., Gigoux P., Phillips M. M., 1994, PASP, 106, 566
- Han & Hjellming (1992) Han X., Hjellming R. M., 1992, ApJ, 400, 304
- Hasinger & van der Klis (1989) Hasinger G., van der Klis M., 1989, A&A, 225, 79
- Hasinger et al. (1990) Hasinger G., van der Klis M., Ebisawa K., Dotani T., Mitsuda K., 1990, A&A, 235, 131
- Homan et al. (2005) Homan J., Buxton M., Markoff S., Bailyn C. D., Nespoli E., Belloni T., 2005, ApJ, 624, 295
- Homan et al. (2007) Homan J., et al., 2007, ApJ, 656, 420
- Hynes et al. (2001) Hynes R. I., Charles P. A., Haswell C. A., Casares J., Zurita C., Serra-Ricart M., 2001, MNRAS, 324, 180
- Hynes et al. (2003) Hynes R. I., et al., 2003, MNRAS, 345, 292
- Hynes et al. (2006) Hynes R. I., Horne K., O’Brien K., Haswell C. A., Robinson E. L., King A. R., Charles P. A., Pearson K. J., 2006, ApJ, 648, 1156
- Iaria et al. (2004) Iaria R., Di Salvo T., Robba N. R., Burderi L., Stella L., Frontera F., van der Klis M., 2004, ApJ, 600, 358
- Johnston et al. (1979) Johnston M. D., Bradt H. V., Doxsey R. E., 1979, ApJ, 233, 514
- Johnston et al. (1999) Johnston H. M., Fender R., Wu K., 1999, MNRAS, 308, 415
- Jonker & Nelemans (2004) Jonker, P. G., Nelemans, G. 2004, MNRAS, 354, 355
- Jonker et al. (2007) Jonker P. G., Nelemans G., Bassa C. G., 2007, MNRAS, 374, 999
- Juett et al. (2003) Juett A. M., Galloway D. K., Chakrabarty D., 2003, ApJ, 587, 754
- Kaaret et al. (2006) Kaaret P., Morgan E. H., Vanderspek R., Tomsick J. A., 2006, ApJ, 638, 963
- Kaluzienski et al. (1980) Kaluzienski L. J., Holt S. S., Swank J. H., 1980, ApJ, 241, 779
- Kawai & Suzuki (2005) Kawai N., Suzuki M., 2005, ATel, 534
- Kennea et al. (2006) Kennea J. A., et al., 2006, ATel, 704
- Kong et al. (2000) Kong A. K. H., Homer L., Kuulkers E., Charles P. A., Smale A. P., 2000, MNRAS, 311, 405
- Kovács (2000) Kovács, G. 2000, A&A, 363, L1
- Krauss et al. (2005) Krauss M. I., et al., 2005, ApJ, 627, 910
- Kuulkers (1998) Kuulkers E., 1998, NewAR, 42, 1
- Kuulkers et al. (2002) Kuulkers E., Homan J., van der Klis M., Lewin W. H. G., Méndez M., 2002, A&A, 382, 947
- Lawrence et al. (1983) Lawrence A., et al., 1983, ApJ, 271, 793
- Machin et al. (1990) Machin, G., et al. 1990, MNRAS, 247, 205
- Maitra & Bailyn (2006) Maitra D., Bailyn C., 2006, ATel, 712
- Massi (2006) Massi M., 2006, Proceedings of the 363 WE-Heraeus Seminar on: Neutron Stars and Pulsars, Physikzentrum Bad Honnef, Germany, May 14-19 2006, eds. Becker W., Huang H. H., MPE Report 291, 185 (astro-ph/0612780)
- McClintock et al. (1979) McClintock J. E., Canizares C. R., Cominsky L., Li F. K., Lewin W. H. G., van Paradijs J., Grindlay J. E., 1979, Nature, 279, 47
- McClintock et al. (1984) McClintock J. E., Remillard R. A., Petro L. D., Hammerschlag-Hensberge G., Proffitt C. R., 1984, ApJ, 283, 794
- McGowan et al. (2003) McGowan K. E., Charles P. A., O’Donoghue D., Smale A. P., 2003, MNRAS, 345, 1039
- Migliari & Fender (2006) Migliari, S., Fender, R. P. 2006, MNRAS, 366, 79
- Migliari et al. (2006) Migliari S., Tomsick J. A., Maccarone T. J., Gallo E., Fender R. P., Nelemans G., Russell, D. M., 2006, ApJ, 643, L41
- Moneti (1992) Moneti A., 1992, A&A, 260, L7
- Predehl & Schmitt (1995) Predehl P., Schmitt J. H. M. M., 1995, A&A, 293, 889
- Press et al. (1992) Press W. H., Teukolsky S. A., Vetterling W. T., Flannery B. P., 1992, Numerical Recipes, 2nd edn. Cambridge Univ. Press, Cambridge
- Produit et al. (2006) Produit N., et al., 2006, ATel, 708
- Ritter & Kolb (2003) Ritter, H., Kolb, U. 2003, A&A, 404, 301
- Roche et al. (2003) Roche P. F., et al., 2003, in Iye M., Moorwood A. F., eds, Proc. SPIE Vol. 4841, Instrument Design and Performance for Optical/Infrared Ground-based Telescopes. SPIE, Bellingham WA, p. 901
- Paper (I) Russell D. M., Fender R. P., Hynes R. I., Brocksopp C., Homan J., Jonker P. G., Buxton M. M., 2006, MNRAS, 371, 1334
- Schulz (1999) Schulz, N. S. 1999, ApJ, 511, 304
- Shahbaz et al. (1993) Shahbaz T., Naylor T., Charles P. A., 1993, MNRAS, 265, 655
- Shahbaz et al. (2003) Shahbaz T., Zurita C., Casares J., Dubus G., Charles P. A., Wagner R. M., Ryan E., 2003, ApJ, 585, 443
- Shaw et al. (2005) Shaw S. E., et al., 2005, A&A, 432, L13
- Shirey (1998) Shirey R. E., 1998, PhD Thesis, MIT
- Steeghs et al. (2004) Steeghs D., Blake C., Bloom J. S., Torres M. A. P., Jonker P. G., Starr D., 2004, ATel, 363
- Steeghs et al. (2005a) Steeghs D., Torres M. A. P., Blake C., Bloom J. S., 2005a, ATel, 533
- Steeghs et al. (2005b) Steeghs D., et al., 2005b, ATel, 543
- Stewart et al. (1993) Stewart R. T., Caswell J. L., Haynes R. F., Nelson G. J., 1993, MNRAS, 261, 593
- Strohmayer et al. (2003) Strohmayer T. E., Markwardt C. B., Swank J. H., in’t Zand J., 2003, ApJ, 596, L67
- Tomsick et al. (2004) Tomsick J. A., Gelino D. M., Halpern J. P., Kaaret P., 2004, ApJ, 610, 933
- Thorstensen et al. (1978) Thorstensen J., Charles P., Bowyer S., 1978, ApJ, 220, L131
- Torres et al. (2007) Torres M. A. P., et al., 2007, ApJ, submitted (astro-ph/0701095)
- van den Heuvel & Heise (1972) van den Heuvel E. P. J., Heise J., 1972, Nature, 239, 67
- van Paradijs et al. (1980) van Paradijs J., Verbunt F., van der Linden T., Pedersen H., Wamsteker W., 1980, ApJ, 241, L161
- van Paradijs et al. (1990) van Paradijs J., et al., 1990, A&A, 235, 156
- van Paradijs & McClintock (1994) van Paradijs J., McClintock J. E., 1994, A&A, 290, 133
- van Paradijs & McClintock (1995) van Paradijs J., McClintock J. E., 1995, in Optical and Ultraviolet Observations of X-ray Binaries, eds, Lewin W. H. G., van Paradijs J., van den Heuvel E. P. J., Cambridge Univ. Press, Cambridge, p. 58
- Vrtilek et al. (1991) Vrtilek S. D., McClintock J. E., Seward F. D., Kahn S. M., Wargelin B. J., 1991, ApJS, 76, 1127
- Wachter (1997) Wachter S., 1997, ApJ, 485, 839
- Wachter & Margon (1996) Wachter S, Margon, B., 1996, AJ, 112, 2684
- Wang et al. (2001) Wang Z., et al., 2001, ApJ, 563, L61