X-ray Evolution of SN 1987A
Abstract
The X-ray observations of SN 1987A over the previous 20 years have seen the emergence of soft X-rays from the interaction of the explosion shock wave with the ambient medium. This shock wave is now interacting strongly with the inner ring and might have passed already the highest density regions. The emission can be described by thermal models with temperatures of 0.28 keV and 2.8 keV, with perhaps some but little change over time. High resolution spectroscopy reveals a large variety of shock velocities ranging from a few hundred to many thousand km s-1. Relative to the elemental abundances prevailing in the LMC the inner ring shows an overabundance of Si and S compared to the lighter elements and Fe, which suggests that the ring consists of highly processed matter dredged up in a binary merger event well before the explosion. The X-ray lightcurves between 0.5–2 keV and 3–10 keV differ significantly in slope, with the latter being much flatter but very similar to the radio light curve.
Keywords:
supernova remnants; supernovae; SN 1987A; X-rays:
98.38.Mz1 Introduction
When the star Sanduleak -69o202 exploded on February 23, 1987, in the Large Magellanic Cloud at a distance of just 50 kpc the whole astronomical community went into some sort of highly excited state. This supernova SN 1987A was considered to be the once-in-a-lifetime event, and for the first time the full arsenal of modern days observational tools could be used to unravel the secrets of a star’s death (section 2), and the detailed, spatially and temporarily, interaction of shock waves with the ambient circumstellar matter (section 3).
2 Hard X-rays
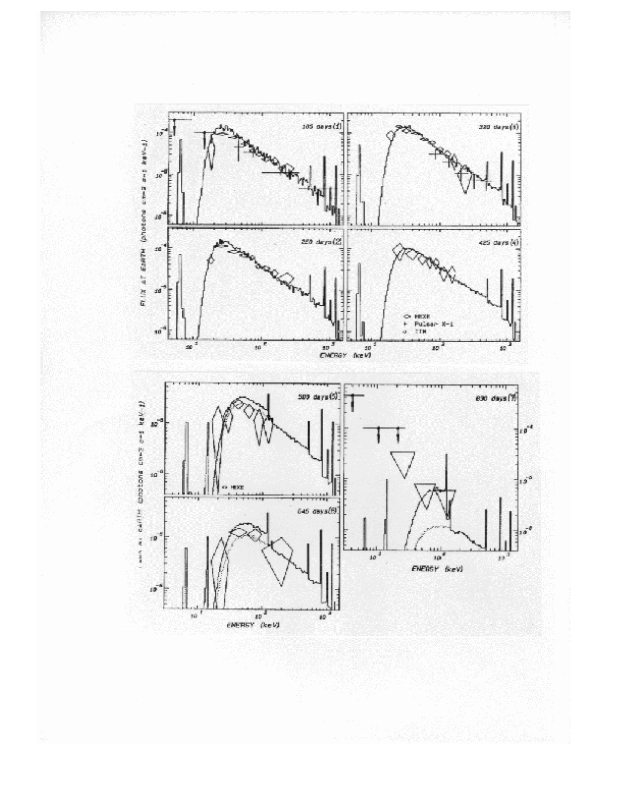
From an X-ray astronomer’s point of view the supernova can tell us about the explosive creation of matter, in particular radioactive material, and its velocity distribution by the appearance of hard X-rays. They appear because the -rays from radioactive decay (56Ni, 57Ni, 56Co, 57Co, 44Ti, 22Na) loose some energy by Compton scattering to become hard X-rays. This goes along with heating the expanding stellar envelope. The optical depth was sufficiently low for the first X-rays to escape from the debris after about half a year. Both the Ginga satellite Dotani87 and the Roentgen-Observatory of the Kvant-Module aboard the Mir-Station Sunyaev87 ; Sunyaev90 measured the emission, which could be followed up to day 835 after the explosion when it began to fade below the sensitivity limit of the instruments (c.f. Fig. 1). The first sighting of the hard X-rays occurred probably on day 143 Englhauser96 . The direct measurement of the 847 keV and 1238 keV -ray lines of 56Co and the temporal evolution was successfully performed with the spectrometer on board of the Solar Maximum Mission Matz88 . In summary, the theoretical concepts were shown to be all right, and the measurements actually put numbers on the amount of radioactive mass. Some puzzles still remain, out of which the mixing of radioactive cobalt through the supernova’s shell with velocities of up to 3000 km s-1 might be mentioned.
3 Soft X-rays
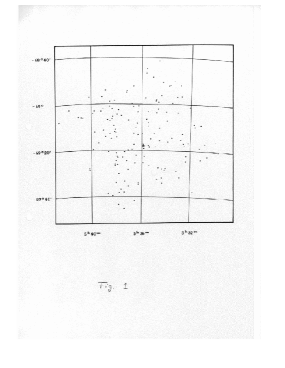
Soft X-rays with a thermal spectrum were expected to be created by the explosion blastwave and the interaction with the ambient medium and eventually by the reverse shock with the expanding stellar debris. The first search for such emission between 0.5 - 2 keV was carried out on August 24, 1987 with a sounding rocket experiment from Australia using an imaging Wolter telescope and the prototype of the ROSAT PSPC detector. As Fig. 2 shows, the result was fairly disappointing but the upper limit of 1.6 1036 erg s-1 excluded the presence of any dense material around the progenitor star including a typical wind of a red supergiant Aschenbach87 . The result was just compatible with parameters typical for a blue supergiant wind. Unfortunate to the experimenters was the slightly earlier discovery on archival optical plates of the supernova progenitor as blue supergiant.
It took about another 4.5 years until a faint soft X-ray signal from SN 1987A was detected with ROSAT Beuermann94 ; Gorenstein94 . The continuous monitoring with ROSAT revealed a slow but steady increase in flux over the first few years Hasinger96 until the end of mission of ROSAT. Measurements were taken up again after the launch of Chandra and later with XMM-Newton in 1999 and 2000, respectively. The monitoring continued until today with fairly regular observations by Chandra Burrows00 ; Park02 ; Park04 ; Park05 ; Park06 and occasionally with XMM-Newton Haberl06 . A time sequence of the beautiful Chandra images can be found in these proceedings, see for instance Park07 .
The analysis of the spectra taken with ROSAT, Chandra, XMM-Newton and most recently with Suzaku demonstrate that the spectrum is thermal over the entire energy range, although the 3–10 keV section of the January 2000 XMM-Newton spectrum is also consistent with a power-law. The thermal character of the spectra shows that the emission is from plasma heated to X-ray temperatures by shock waves. The flux as well as the evolution of the lightcurves depend on the spatial pre-shock matter density distribution. An excellent starting point are the images taken with HST and Chandra as well as earlier optical observations from the ground. SN 1987A is probably embedded in a close to spherical bubble of gas, which might be the relic from the winds of the blue and/or red supergiant phase. Furthermore, there is the triple ring system with the inner equatorial ring. This ring has pre-shock electron densities exceeding a few times 104 cm-3 Lundqvist96 , which promised to provide a spectacular brightening in soft X-xays when the blast wave would hit the ring. Meanwhile optical and X-ray, as well as radio images of this ring are available and the ring is actually partially resolved also around its circumference, showing numerous bright but unresolved spots in the optical but with less bright regions in between Lawrence00 , which makes it appear as some sort of leaky structure to the blastwave. A detailed picture of the environment and the various interactions can be found in Michael et al. Michael03 .
3.1 Lightcurves
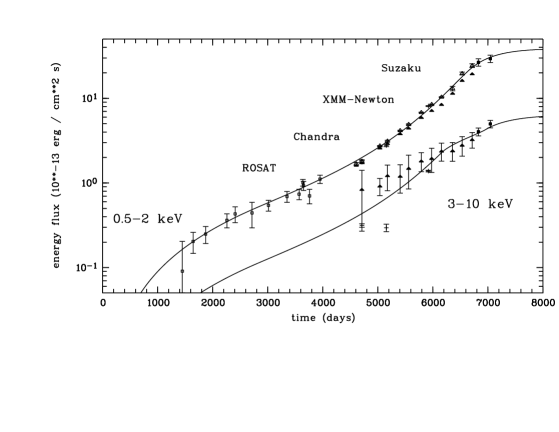
Fig. 3 shows a compilation of all flux data available up to the time of this conference for the energy bands of 0.5–2 keV and 3–10 keV, respectively. The 0.5–2 keV lightcurve with the exception of the two recent Suzaku data points has been taken from Haberl et al. Haberl06 . For Chandra Haberl et al. show the original data published by Park et al. Park02 ; Park04 ; Park05 ; Park06 and a set of slightly corrected data in order to achieve a better agreement between Chandra and XMM-Newton in the soft band, which I included in Fig. 3. A discussion about the appropriateness of this procedure can be found in these proceedings Park07 . I might mention that at this point in time there are still uncertainties regarding the intercalibration of the instruments including the Suzaku data, which are under way to be resolved by the calibration working groups. Independent of this slight controversy Fig. 3 shows that the shape of the 0.5–2 keV lightcurve differs significantly from that of the 3–10 keV lightcurve which is less steep.
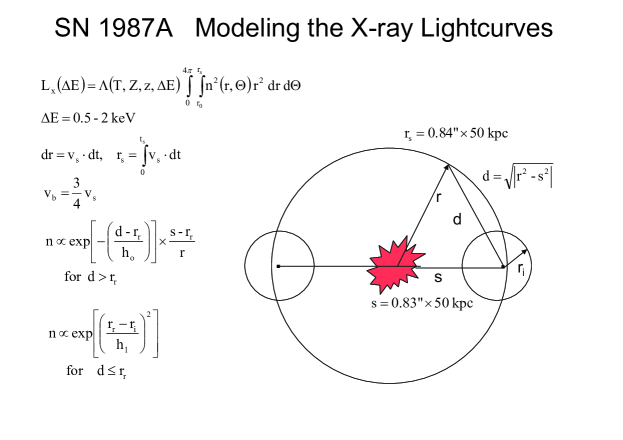
The solid lines are the result of a model, which is outlined in Fig. 4. The model assumes that the iso-density contours of the ambient medium form a circular torus around the explosion site with a circular cross section. The density distribution is independent of the azimuth, and perpendicular to the iso-density contours it falls off as a Gaussian with increasing distance from the torus core. Beyond some distance the Gaussian turns into an exponential. The fit to the lightcurve data provides a maximum pre-shock density of 1.2104 cm-3 for the innermost core of the ring, which agrees quite nicely with the ring electron density of ne = (2–4)104 cm-3 derived from the early optical/UV measurements Lundqvist96 . For the central 0.1 arcsec diameter ring region the model suggests a mass of 0.065 solar masses. However, the total mass overrun by the shock wave to date amounts to 0.45 solar masses, apparently much more than earlier assumed. The model constrains the current position of the shock wave, which has passed the core of the ring on day 6900 and is from then on already running in a lower density regime. This leads to a flattening of the lightcurve from day 6600 onwards. From now on the soft X-ray lightcurve is going to climb only very moderately reaching a maximum around the year 2010 with an increase in flux of less than 50. A prediction beyond that date is difficult to make but a re-brightening may happen when the blast wave is going to strike the base of the red supergiant wind, if it is not located too far upstream. Another brightening may happen when the stellar ejecta are heated by reverse and/or reflected shocks.
For the construction of the 3–10 keV lightcurve the same model has been used but those regions with densities greater than 500 cm-3 have been excluded from the emission, because the shock velocity is likely to be too low to produce the required high temperatures.
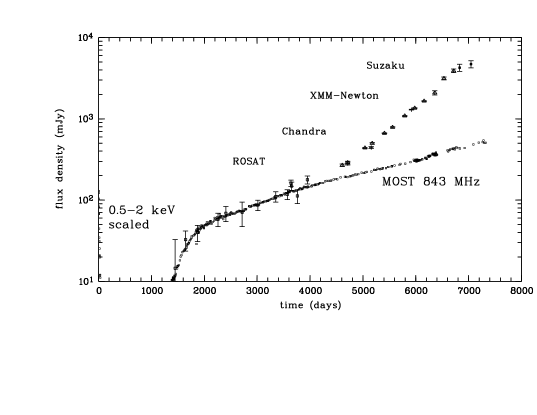
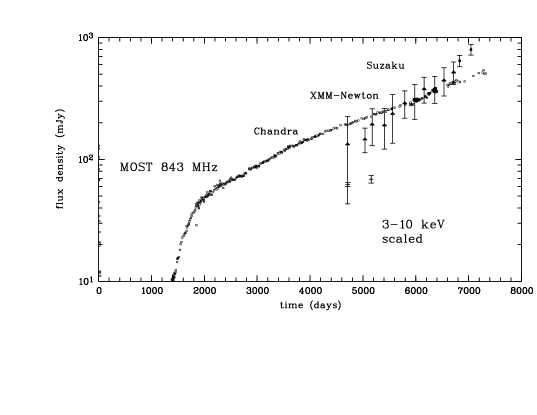
Fig. 5 and Fig. 6 repeat the X-ray lightcurves for the 0.5–2 keV and 3–10 keV bands, respectively, and each of which is compared with the most recent MOST radio lightcurve at 843 MHz (see http://www.physics.usyd.edu.au/ioa/Main/SN1987A) Ball01 . Up to day 4000 the radio data agree with the soft X-ray lightcurve surprisingly well, but they don’t follow the rapid increase of the X-rays later on; instead the radio data continue to rise but at a much slower but almost constant rate (Fig. 5). The agreement with the hard X-ray lightcurve (Fig. 6) is much better, although the Chandra data supplemented by the more recent Suzaku data indicate a faster, although constant rise as well. But, as said before, we need to look into the X-ray calibration issues. Nevertheless, it seems unavoidable to conclude that both hard X-rays as well as 843 MHz emission are lacking in the highest density regions of the ring. For the X-rays it means that the shock velocity is too low and for the radio emission it means that the acceleration of electrons to GeV energies and/or the compression of magnetic fields is less efficient or even suppressed. Images with significantly improved angular resolution, which resolve the optical bright (hot) spots would be useful to follow this issue.
3.2 Spectra
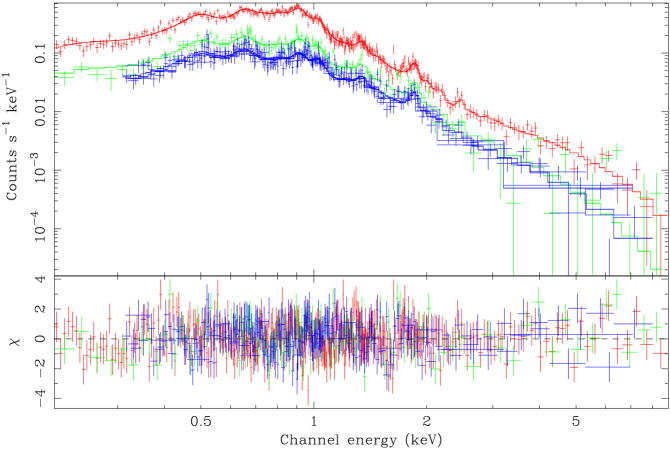
X-ray spectra have been recorded since 1999 by Chandra and XMM-Newton both at medium spectral resolution with the X-ray CCD-detectors Burrows00 ; Park02 ; Park04 ; Park05 ; Park06 ; Haberl06 and high resolution with the transmission grating LETG on Chandra Zhekov05 ; Zhekov06 and the reflection grating spectrometers RGS1 & RGS2 on XMM-Newton Haberl06 . Recently, the CCD-detectors aboard of Suzaku contributed further spectra. For a view of the Chandra spectra I refer to the paper of Park et al. Park07 in these proceedings. Fig. 7 shows the XMM-Newton EPIC-pn spectra taken in January 2000, April 2001 and May 2003. The RGS1 & RGS2 grating spectra of the May 2003 observation are shown in Fig. 8.
For the analysis of the spectra different models for the purely thermal emission have been used. The Chandra data have been compared with predictions of a two-component plane shock model whereas XMM-Newton and Suzaku data were subjected to an analysis with a two-temperature model with collisional ionization equilibrium and non-ionization equilibrium components. Despite the different approaches the results are pretty close to each other as far as the low temperature of 0.28 keV on average is concerned. In contrast differences in the value of the high temperature are fairly large when comparing Chandra, XMM-Newton and Suzaku. One may quote a temperature of 2.8 keV; a clear temporal trend is not apparent, although some excursions down and up again after day 6000 may not be excluded. The low temperature started off at 0.23 keV in 1999 and has now reached at value of 0.33 keV, which would correspond to an increase of 100 eV (7 years)-1. This increase may indicate that the heating of the electrons had become more efficient when the shock wave has entered the high density regions of the ring.
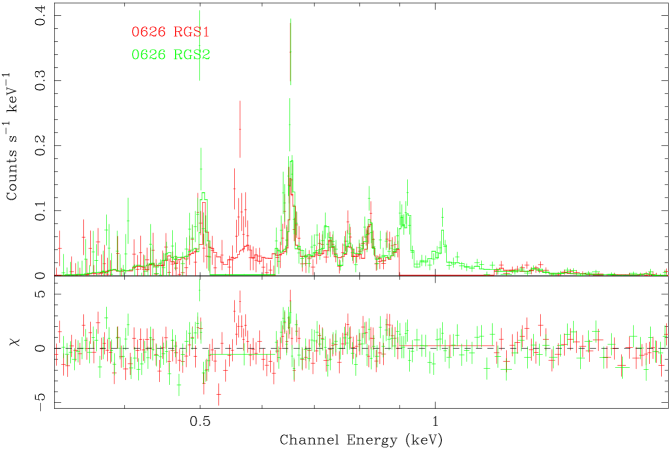
The high resolution data of the gratings could be used to assess the presence of numerous high ionization emission lines between 0.5–2 keV, such as N VII, O VII, O VIII, Fe XVII, Ne IX, Ne X, Mg XI, Mg XII, Si XIV, XV, XVI (Fig. 8). Their shapes and shifts have revealed a substantial range of shock velocities running from a few hundred to many thousand km s-1, which basically reflects the complex density structure of the ambient matter. I note that the blastwave speed averaged over the past 20 years is 10500 km s-1, though.
3.3 Elemental abundances
Both the medium resolution and the high resolution data have been used to compile elemental abundances, the distribution of which is shown in Fig. 9. The abundance of each element covered by the data and measured relative to the corresponding solar values have been computed by averaging the corresponding data from each contributing instrument in an unweighted way. Then, this averaged abundance has been normalized for each element to a so-called typical abundance of the LMC given by Hughes et al. Hughes98 . These have been derived from ASCA observations of middle-aged supernova remnants in the LMC. Fig. 9 shows that the elements of N, O, Ne, Mg and Fe in the inner ring and in the region enclosed currently by the blastwave have about the same abundance as are present in the LMC. But Si, S and possibly Ni (uncertain, because this is a Suzaku measurement not yet confirmed) turn out to be much higher in abundance. There appears to be an enrichment of these elements in the inner ring by about a factor of three.
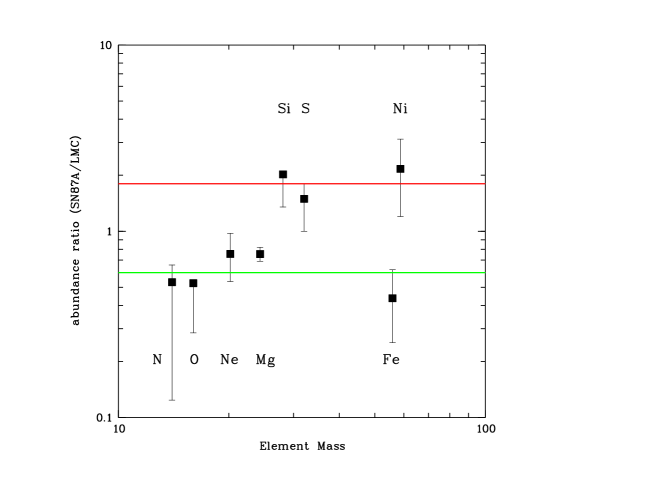
In terms of absolute abundances the numbers have to be taken with some care because they depend on how much hydrogen is involved in either the inner ring or the LMC in general, but the ratio of the average of the two groups remains to be the same. It looks as if the inner ring contains preferentially highly processed material. It is unlikely that this has been expelled from the outermost layers of the progenitor star or that the ring formed from interaction of winds. In contrast, it seems to favour a binary merger as the event which created the inner ring or even the entire ring system as suggested earlier by Morris & Podsiadlowski Morris06 ; Morris07 .
References
- (1) T. Dotani, K. Hayashida, H. Inoue, et al., Nature 330, 230–231 (1987).
- (2) R. Sunyaev, A. Kaniovsky, V. Efremov, et al., Nature 330, 227–229 (1987).
- (3) R. A. Sunyaev, A. Kaniovsky, V. Efremov, et al., Sov. Astron. Lett. 16(3), 171–176 (1990).
- (4) J. Englhauser, PhD Thesis, Technische Universität München (1996).
- (5) S. M. Matz, G. H. Share, M. D. Leising, et al., Nature 331, 416–418 (1988).
- (6) B. Aschenbach, U. G. Briel, E. Pfeffermann, et al., Nature 330, 232–233 (1987).
- (7) K. Beuermann, S. Brandt & W. Pietsch, Astronomy & Astrophysics 281, L45–L48 (1994).
- (8) P. Gorenstein, J. P.Hughes & W. H. Tucker, The Astrophysical Journal 420, L25–L28 (1994).
- (9) G. Hasinger, B. Aschenbach & J. Trümper, Astronomy & Astrophysics 312, L9–L12 (1996).
- (10) D. N. Burrows, E. Michael, U. Hwang, et al., The Astrophysical Journal 543, L149–L152 (2000).
- (11) S. Park, D. N. Burrows, G. P. Garmire, et al., The Astrophysical Journal 567, 314–322 (2002).
- (12) S. Park, S. Zhekov, D. N. Burrows, et al., The Astrophysical Journal 610, 275–284 (2004).
- (13) S. Park, S. Zhekov, D. N. Burrows, et al., The Astrophysical Journal 634, L73–L76 (2005).
- (14) S. Park, S. Zhekov, D. N. Burrows, et al., The Astrophysical Journal 646, 1001–1008 (2006).
- (15) F. Haberl, U. Geppert, B. Aschenbach, G. Hasinger, Astronomy & Astrophysics 460, 811–819 (2007).
- (16) S. Park, These Proceedings (2007).
- (17) P. Lundqvist & C. Fransson, The Astrophysical Journal 464, 924–942 (1996).
- (18) S. S. Lawrence, B. E. Sugerman, et al., The Astrophysical Journal 537, L123–L126 (2000).
- (19) E. Michael, R. McCray, R. Chevalier, et al., The Astrophysical Journal 593, 809–830 (2003).
- (20) L. Ball, D. F. Crawford, R. W. Hunstead, I. Klamer, V. J. McIntyre, The Astrophysical Journal 549, 599–607 (2001).
- (21) S. A. Zhekov, R. McCray, K. J. Borkowski, et al., The Astrophysical Journal 628, L127–L130 (2005).
- (22) S. A. Zhekov, R. McCray, K. J. Borkowski, et al., The Astrophysical Journal 645, 293–302 (2006).
- (23) J. P. Hughes, I. Hayashi, K. Koyama, The Astrophysical Journal 505, 732–748 (1998).
- (24) T. Morris & Ph. Podsiadlowski, Month. Notices Roy. Astron. Soc. 365, 2–10 (2006).
- (25) T. Morris & P. Podsiadlowski, Science 315, 1103–1106 (2007).