Present address: ] Department of Physics, Kyoto University, Kyoto 606-8502, Japan. Present address: ] VAST Scientific, Cambridge, MA 02139, USA Present address: ] Los Alamos National Laboratory, Los Alamos, NM 87544, USA Present address: ] Louisiana Tech University, Ruston, LA 71272, USA Present address: ] Quartek Corporation, Greensboro, NC 27410, USA Present address: ] Los Alamos National Laboratory, Los Alamos, NM 87544, USA Present address: ] Bluegrass Community and Technical College, Lexington, KY 40506, USA
Revised ]September 13, 2007
Weak decays of
Abstract
We measured the lifetime and the mesonic and nonmesonic decay rates of the hypernucleus. The hypernuclei were created using a 750 MeV/c momentum beam on a liquid 4He target by the reaction . The lifetime was directly measured using protons from nonmesonic decay (also referred to as proton-stimulated decay) and was found to have a value of ps. The mesonic decay rates were determined from the observed numbers of ’s and ’s as and , respectively, and the values of the proton- and neutron-stimulated decay rates were extracted as and (95% CL), respectively. The effects of final-state interactions and possible three-body decay contributions were studied in the context of a simple model of nucleon-stimulated decay. Nucleon-nucleon coincidence events were observed and were used in the determination of the nonmesonic branching fractions. The implications of the results of this analysis were considered for the empirical rule and the decay rates of the hypernucleus.
pacs:
21.80.+a,13.75.EvI INTRODUCTION
Studies of the hyperon-nucleon interaction investigate weak processes that are not well understood in multiple baryon systems. In particular, the study of nonmesonic decays of light hypernuclei is the only tractable method of investigating the weak baryon-baryon interaction. By comprehensive measurements in s-shell hypernuclei, various initial states can be investigated. Few-body nuclear structure calculations can then relate the decay rates to the underlying weak interactions. These studies are complementary to investigations of the parity-violating contributions to the nucleon-nucleon interaction. However, the system can be prepared in a particle-stable state so that only weak processes contribute to the decay rate.
A particularly interesting aspect of transitions is the empirical rule. We note that if strong interactions are neglected, the non-leptonic decays of hyperon systems would be expected to be dominated by a weak quark-level Hamiltonian based on one W-exchange of the form:
| (1) |
The isospin character of this fundamental Hamiltonian does not favor weak transitions over the ones. However, it has long been recognized that the transitions dominate all observed non-leptonic decays of strange hadrons. Although it is generally believed that the presence of the strong interaction accounts for this empirical selection rule, the various explanations for the dominance of the amplitudes Okun82 ; Isgur90 have indicated that the mechanism may be specific to the given system and not a universal feature of the weak Hamiltonian. It remains an open question whether all non-leptonic decays obey the rule or it is specific to the pionic decay channels (the only tested class of non-leptonic decays). The study of hypernuclear decays provides an opportunity to answer this question by providing the only experimentally accessible non-pionic test of the rule.
The total decay width of a hypernucleus includes contributions from mesonic and nonmesonic decay modes. The mesonic decay modes, defined experimentally by the observation of the appropriate pion in the final state, are dominated by single-body processes analogous to the decay of the free , and , along with additional multi-body contributions such as . The nonmesonic modes are expected to be dominated by the proton-stimulated reaction and neutron-stimulated reaction with rates and , respectively. Other multi-body interactions such as may also contribute with rate . Determination of the nucleon-stimulated decay rates is more complicated than the mesonic case and is ultimately model dependent. The total decay width can be written in terms of the widths of these mesonic and nonmesonic decay modes as:
| (2) |
where contributions from semileptonic and weak radiative decays have been neglected as they contribute only about 0.3% to the total free decay width PDG06 .
The two-body nonmesonic decay modes, , are readily distinguishable from the mesonic decay modes, , because of the large energy () available for the final-state nucleons. These modes are sensitive to weak interaction couplings (such as or ) not available to the free hyperon decays. Also, it has been suggested that several of the weak amplitudes are dominated by direct-quark processes Maltman94 ; Inoue98 ; Sasaki05 in which no intermediate meson is present in the interaction. Such direct processes may not adhere to the rule.
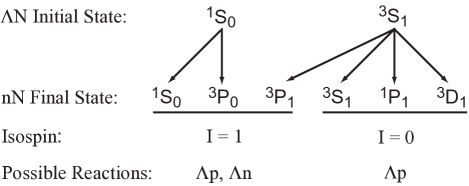
In nuclei the -particle is not Pauli blocked, thus hypernuclei generally decay with the -particle initially in the lowest -state. In order to determine properties of the underlying interaction, it is convenient to consider systems that confine the nucleons to the lowest orbitals. Figure 1 shows the spin-isospin character of the initial () and final () states for -shell hypernuclei in a single-particle shell model picture. The I=1 final states are accessible to both proton- and neutron-stimulated decays, while the I=0 final states are available only for proton-stimulated decay. Further complications arise as one increases because the high probability of final-state interactions dilutes the correlation between nucleons observed and nucleons responsible for the decay. Table 1 shows that a complete set of measurements of the nonmesonic decay widths for the s-shell hypernuclei allows one to isolate specific initial states. Thus, one can determine the spin-isospin structure of the fundamental weak interaction by combining measurements of these few-body hypernuclei with detailed finite nucleus calculations that take into account the differences in the initial and final state phase-space. However, at this time the experimental data are incomplete and often have large estimated errors.
| Species | ||
|---|---|---|
A phenomenological model first put forth by Block and Dalitz Block63 ; Reinhard92 can be used to relate the nonmesonic decay rates of the -shell hypernuclei listed in Table 1. Specifically, the current experimental results for (this work) and (Outa et al Outa05 ) can be extended to the hypernucleus, for which measurements are currently scarce. The model employs the mean nucleon density, , at the location of the and makes several assumptions concerning the interaction: (1) the nucleon-stimulated decay is treated as incoherent, (2) final-state interactions are not included, and (3) three-body nucleon-stimulated decays are neglected. These assumptions are seen to be adequate at the present level of accuracy of the experimental quantities. Defining the quantity as the rate for an -stimulated decay originating from relative spin state , the nonmesonic decay rates for the -shell hypernuclei H, He, and He are derived as:
| (3) | |||||
| (4) | |||||
| (5) |
where the mean nucleon density, , is defined as:
| (6) |
for the nucleon density, , and the wave function, . Also, it has been assumed that the mean nucleon density, , has the same value for both and .
Taking the ratio of the rates of neutron-stimulated decay to proton-stimulated decay yields:
| (7) |
where the value of 2 is the rule prediction for this ratio. Similarly, an expression for the neutron-stimulated rate can be found by considering the ratio of neutron-stimulated decay to proton-stimulated decay:
| (8) |
independent of any assumptions about the rule.
In this article, we present the results of BNL experiment E788, which measured the lifetime and partial widths of the hypernucleus. Section II presents the experimental apparatus used for these measurements, and a discussion of the out-of-beam tracking and particle identification algorithm is given in Section III. The excitation energy spectra for the production reaction are discussed in Section IV. The extraction of the lifetime of and particle-emission spectra are presented in Sections V and VI, respectively. The determination of the mesonic and nonmesonic partial decay rates is discussed in Section VII. In the case of the nonmesonic proton- and neutron-stimulated decays, the rates are found from both the single-particle kinetic energy spectra of Section VI as well as from observed multiple-nucleon coincidence events, giving two essentially independent determinations. A comparison with the results of other experiments and theoretical calculations and the extension of these results to the hypernucleus is presented in Section VIII.
II EXPERIMENTAL SETUP
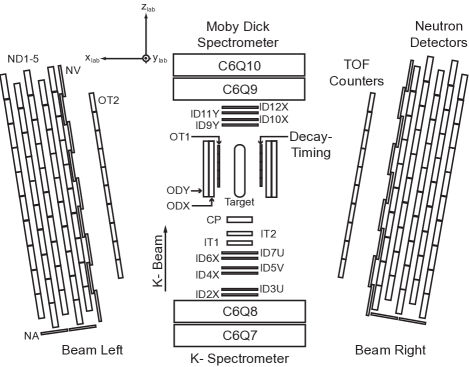
The partial decay rates and lifetime of were measured using the LESB-II kaon beamline of the AGS at Brookhaven National Laboratory. The beamline parameters are given in Table 2. The experimental layout is shown in Fig. 2. A beam of 750 MeV/c kaons incident on a liquid helium target produced through the reaction, and pions from the production reaction were detected near in the Moby Dick spectrometer. Detector packages located on each side of the target area were used to detect and identify pions, protons, neutrons, and ’s from the hypernuclear decays.
| Item | Description |
|---|---|
| LESB-II Separated Beamline/Spectrometer | |
| Momentum | 750 MeV/c |
| Momentum acceptance | 5% FWHM |
| ratio at target | |
| flux | |
| Momentum measurement | Drift chambers ID1X – ID7U |
| and hodoscope MH | |
| Particle ID | IS1 – IT1,2 TOF scintillators |
| and CP erenkov -veto | |
| Moby Dick Spectrometer | |
| Momentum | 680 MeV/c |
| Momentum acceptance | 5% FWHM |
| Momentum measurement | Drift chambers ID9Y – ID15Y |
| particle ID | IT1,2 – IS2,3 TOF scintillators |
The incident kaon trajectories were determined with drift chambers located just upstream of the target (ID2X through ID7U). This information was combined with data from the drift chamber ID1X, located upstream of the spectrometer, to determine the incident kaon momentum. Although the kaon-to-pion ratio at the target was only 1:13, the kaons were cleanly separated using a combination of the time-of-flight between scintillator IS1 (not shown) located upstream of the spectrometer and scintillators IT1 and IT2 and a critical angle erenkov detector (CP). The outgoing pion momentum was measured with the Moby Dick spectrometer located at zero degrees downstream of the target, and the outgoing particle identification was accomplished with time-of-flight measurements.
The 30.5 cm long liquid helium target vessel consisted of a 6.35 cm diameter Dacron cylinder with a wall thickness of 0.020 cm. To minimize material between the decay vertex and the out-of-beam decay particle detectors, the vacuum vessel containing the Dacron shell was constructed from a PVC foam cylinder of density 0.053 gm/cm3 with inner and outer radii of 7.6 cm and 11.43 cm, respectively.
The separation of the decay protons and pions was accomplished by combining the crude range information from all out-of-beam detectors with the measured rate of energy loss (), total energy loss, and the measured time-of-flight (TOF) between the Decay-Timing and TOF scintillator layers (also referred to in this paper as OT1 and OT2, respectively). The precision timing scintillators of the Decay-Timing layer also played an important part in the determination of the lifetime of the hypernucleus. With no magnetic field in the region of the out-of-beam detectors, the detector system of E788 was unable to distinguish a from a , making it possible to measure only the sum of the two widths and . However, the width has been seen to be small compared to the decay width ( Keyes76 ) and was ignored in this analysis. Large volume () neutron detector arrays were placed near the target to directly measure the decay neutrons and were used to determine the neutron energies by time-of-flight. The neutron detector arrays were also used to detect the ’s from the decay of ’s originating from decay. Thus, this experiment directly measured , , , , and , along with the kinetic energy spectra for the decay ’s, protons, and neutrons. Details of the detector dimensions are given in Table 3.
| Name | Function | Dimensions (cm3) |
| Drift Chambers | ||
| ID | trajectories | |
| OD | y and z track positions (1 pair each side) | |
| Scintillation Counters | ||
| IT1, IT2 | TOF and formation time | |
| CP | critical angle pion erenkov counter | |
| OT1 | decay time and (5 each side) | |
| OT2 | TOF, , and range (10 each side) | |
| NV | range and charged particle veto (9 each side) | |
| NA | charged particle veto (2 each side) | |
| ND | range and neutral particle detection (50 each side) | |
III Out-of-Beam Track Reconstruction and Identification
The task of the out-of-beam tracking was to sort through the scintillator hits recorded in the out-of-beam detector arrays and determine the trajectories of the charged and neutral particles that created them. A hit in the out-of-beam detector array was defined as a coincidence of signals in the photomultiplier tubes at each end of a scintillator element, requiring ADC and TDC information for both of the PMTs. Each hit was characterized by a hit time, energy deposition, and hit position. For a hit to be considered for tracking, the recorded time (measured relative to the event start-time as set by the mean time of in-beam scintillators IT1 and IT2) and measured energy deposition must have been greater than zero.
As a preliminary step, neutron detector hits that satisfied the rudimentary conditions described above were examined, and correlated hits were grouped into clusters based on relative hit times and positions (i.e., groups of hits that were sufficiently close in time and space were considered to have arisen from a single particle). The hit clusters were classified as charged if the group included any hits in the OT2 or NV layers, otherwise the cluster was considered to have originated from a neutral particle.
Charged tracks were indicated by a coincidence of hits in the OT1 and OT2 layers. The charged tracking began with a search for hits in the OT1 layer, and for each OT1 hit found, a search was made for corresponding hits in OT2. If the hit pairs were properly time ordered (i.e., the OT1 hit preceded the OT2 hit), they were considered to be part of a charged track and were then subjected to a more detailed tracking procedure. The final track was found from a linear least squares fit to the OT1 and OT2 hits, the reaction vertex, out-of-beam drift chamber hits, and any hits in the neutron veto layer or neutron detector array that belonged to the same cluster as the OT2 hit. Interesting quantities such as the particle’s velocity between the OT1 and OT2 layers and the particle’s range and total energy loss in the out-of-beam detector system were then determined.
The tracking information found above was used to distinguish protons from pions, a task that was complicated by the absence of a momentum-analyzing magnetic field. To determine the identity of the charged particles, the measured velocity, range, and energy loss of a charged track were compared with the expected behavior of the hypernuclear decay products via the quantity:
| (9) |
where is the measured energy deposition in the OT2 scintillator layer, is the velocity fraction as measured in the time-of-flight region of the out-of-beam detector array, and and are the resolutions for the measured quantities. To find the quantity (and thus, the theoretical energy deposition ), the above expression for was minimized by varying the value of within limits determined by the measured range of the particle. The PID (particle identification) for a given track was then determined by testing the values of (calculated assuming the track was created by a pion) and (calculated assuming the track was created by a proton) against predetermined limits. The particle was then classified as either a proton, a pion, or an unknown (neither nor was within the appropriate limits). The unknown particles consisted mostly of electrons and were well separated from the pions and protons.
A neutral particle appeared as a single hit or small cluster of hits in the out-of-beam detector arrays, providing little information for tracking. A neutral track was taken as a straight line connecting the reaction vertex with the out-of-beam neutral cluster, where the time and position of the reaction vertex were known from the in-beam tracking. For each of the neutral clusters found in the preliminary grouping, a cluster hit time, position, and energy were calculated. The hit time and position were determined by the member hit that was closest to the target, and the energy was taken as the sum of the energy deposition for all member hits. Additionally, each cluster was characterized by a cluster size defined simply as the total number of member hits. Once the neutral track was determined by the production vertex and cluster hit position, the velocity fraction of the neutral particle could be calculated.
The next task was to separate neutrons from ’s and attempt to suppress the large accidental neutral background. To reduce accidentals, an energy deposition threshold of MeVee (MeV electron equivalent) was applied to the neutral clusters, and clusters with corresponding hits in the auxiliary veto counters NA were discarded. Good neutron candidate events were then selected by requiring the neutral cluster to have fewer than 3 member hits and a value for the neutron kinetic energy (as derived from the measured time-of-flight) from 50 to 200 MeV. The lower bound at 50 MeV avoids the energy region where accidentals dominate, and the upper bound at 200 MeV, which is well above the maximum expected kinetic energy for neutrons from hypernuclear decay (170 MeV), removes ’s from consideration. Good events were selected by requiring the measured of the candidate track to be in the range , where the lower bound at 0.666 is well above the highest expected for neutrons from hypernuclear decay. Even with the cuts described above, a sizeable background still remained in the neutron and samples. The subtraction of this background will be discussed in subsequent sections. A cancellation effect inherent in the subtraction of the background reduces the sensitivity of the final results to the selection of the cut parameters given above.
IV EXCITATION SPECTRA
Reconstruction of the and trajectories through their respective spectrometers allowed the calculation of the invariant mass of the unobserved strange system. Unlike p-shell hypernuclei, the ground state is also a substitutional state and thus the reaction near zero degrees is ideal for creating . The main source of background for the production reaction was in-flight kaon-decays. Those decays that may satisfy the trigger condition include (i) , (ii) , and (iii) . For kaons that decayed within the area of the target, the two-body decays were easily removed using the decay kinematics, while the three-body decays had to be modeled with a Monte Carlo simulation and fit to the data. Some kaons decayed within the beamline chambers or Moby Dick spectrometer or traversed the experimental area completely. These events were characterized by a small apparent scattering angle and were removed by requiring an angle greater than 25 mrad. Events with production vertices outside the target region or poor beam track reconstruction were also rejected.
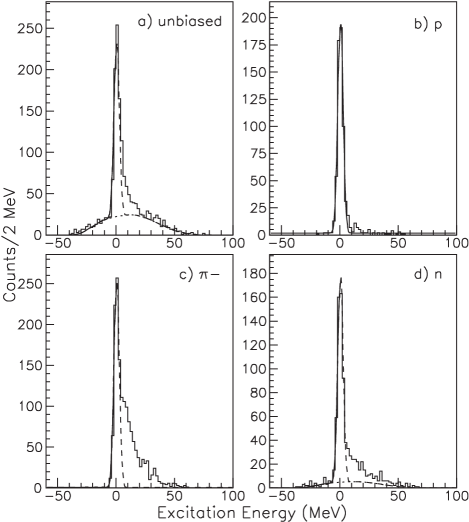
The resulting excitation energy spectrum for unbiased events is shown in Fig. 3(a), where unbiased refers to the trigger condition in which only an incoming and outgoing were required (i.e., no information from the out-of-beam detectors was considered). Also shown are the excitation energy spectra for events with a coincident proton, pion, or neutron [Figs. 3(b), (c), and (d), respectively] where the coincident decay particles were identified as described in the previous section. (Note that the low number of counts in the unbiased spectrum as compared to the coincident spectra is a result of a hardware prescale in the unbiased trigger.) Since the coincident protons were required to have kinetic energies greater than 35 MeV, only events in which the was bound to a nucleus and decayed through a nonmesonic channel contribute to the proton-tagged spectrum of Fig. 3(b). A fit of a Gaussian shape to this peak determined an experimental resolution of MeV RMS and defined the zero of excitation energy. The unbiased spectrum, Fig. 3(a), was then determined to consist of three parts: (i) a broad background from contamination whose shape was determined by Monte Carlo simulation and whose magnitude was found from a fit to the lower part of the spectrum, (ii) events corresponding to the production of the bound ground state with mean and width determined from Fig. 3(b) and amplitude determined by a fit to the left half of the peak, and (iii) additional structure above zero excitation energy that we associate with the production of unbound hyperons.
The excitation energy spectrum for coincident decay pions of Fig. 3(c) is shown with a two parameter fit to the left half of the ground-state peak. The fit determines the amplitude of the ground-state peak and includes a flat background term. The requirement of a decay-pion tag virtually eliminates the residual contamination but retains events from both bound and unbound production as would be expected. For the neutron-tagged excitation energy spectrum of Fig. 3(d), the coincident neutrons consist of a mixture of neutrons from nonmesonic decay, accidental neutrons, and neutrons created when ’s from decay or quasifree decay were absorbed in the material around the target area.
V Lifetime of
The lifetime of a hypernucleus was defined event-by-event as the time between the formation of the hypernucleus and its subsequent decay as determined from the velocity and trajectory of the incident kaon and the energy and trajectory of the charged hypernuclear decay product. The hypernucleus was assumed to be created at rest, and the position of the reaction vertex (and decay point) was inferred from the in-beam and out-of-beam tracks using a distance of closest approach (DCA) algorithm. The velocity of the incoming was derived from its momentum as measured by the upstream spectrometer, and its trajectory was determined by the six drift chambers located just upstream of the 4He target. A time measurement was also made for the beam kaon as it passed the in-beam scintillators IT1 and IT2. This measurement set the start time for the event and was taken as the average of the two counters (producing a combined resolution of ps). The time of hypernuclear formation was then simply found from the velocity of the and its path length from the point midway between the IT1 and IT2 timing counters to the reaction point. (The velocity of the beam kaon was assumed to have remained constant as it traversed the experimental area.) For the out-of-beam charged track, the energy was determined from the time-of-flight as measured between the Decay-Timing (OT1) and TOF (OT2) scintillator layers. The decay time at the vertex position was determined after making corrections for the unmeasured energy losses in the target region.
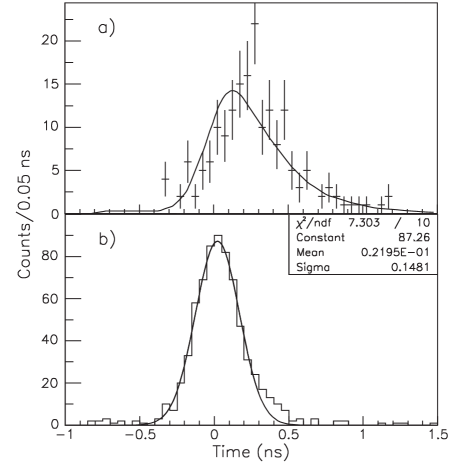
The events used in the mean lifetime determination were subject to the in-beam tracking cuts described in Sec. IV for the hypernuclear excitation energy spectra. Protons were chosen in the out-of-beam to avoid the contamination of quasifree decay events present in the -tagged sample. Also, protons with kinetic energy below 70 MeV were not considered for the lifetime measurement since the uncertainty in the energy loss correction increases at lower energies. To ensure that the kaon and proton tracks were correlated with a hypernuclear formation event: (i) the excitation energy was required to be within of the mean, (ii) the and proton tracks must have had a DCA of less than 2 cm, and (iii) the reaction vertex must have been within the liquid 4He containment vessel. The resulting lifetime distribution for these proton-tagged events can be seen in Fig. 4(a).
The mean lifetime of was determined by a fit to the distribution of Fig. 4(a). The actual time distribution expected for this measurement has the form:
| (10) |
where is the decay probability distribution:
| (11) |
and is the resolution function as determined from the time distribution of prompt protons originating from the reaction [shown in Fig. 4(b)] and is the usual theta function. The measured distribution of Fig. 4(b) gives a resolution of ps. The fit to the hypernuclear lifetime distribution of Fig. 4(a) was performed using a likelihood function derived assuming Poisson statistics from the function:
| (12) |
which includes two background terms in addition to the expected lifetime distribution of Eq. 10. By maximizing the likelihood function on the four parameter space (, , , ), the value for the mean lifetime of was found to be ps. [The values for the background terms and were found to be negligible compared to .]
VI Particle Emission Spectra
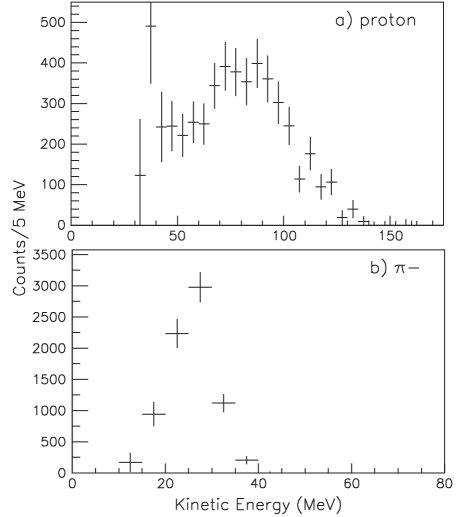
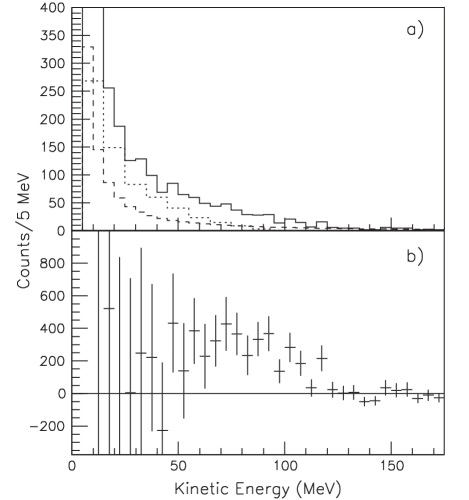
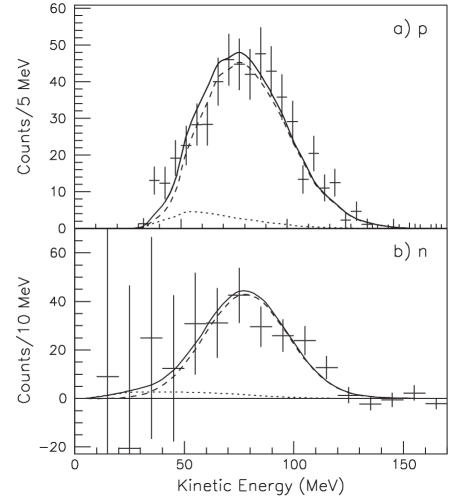
The kinetic energy spectra for the decay protons, pions, and neutrons are shown in Figures 5(a), 5(b), and 6(b), respectively. These events were subject to the cuts described in Sec. IV for the excitation energy spectra. To reduce contamination from out-of-beam particles not originating from a hypernuclear ground-state event, a cut was also placed on the value of the excitation energy. In the case of proton- and neutron-tagged events, the excitation energy, , was required to be within of the mean of the ground-state peak, while in the case of pion-tagged events, a tighter cut of (referred to here as the “ cut”) was employed to reduce contamination from quasifree decay events. (The quantities and are the previously determined mean and width of the ground-state peak.) For the proton and pion spectra, corrections for the unmeasured energy losses in the target region have been included.
In order to obtain the neutron kinetic energy spectrum of Fig. 6(b), a considerable background consisting of accidental neutrons and neutrons from interactions had to be subtracted from the raw neutron kinetic energy spectrum shown in Fig. 6(a). The expected shape of the accidental neutron spectrum was generated assuming a flat distribution in (i.e., a flat time distribution). The distribution for neutrons from absorption was then extracted from the data by considering neutron-tagged events with excitation energy in the range MeV. The neutrons from these events consist of a mixture of accidental neutrons and neutrons from absorption only. The normalizations for the background shapes were found via a detailed comparison of the unbiased and neutron-tagged excitation spectra of Figures 3(a) and 3(d). The background contributions thus determined are overlaid on the plot of Fig. 6(a).
The kinetic energy spectra of Figures 5(a), 5(b), and 6(b) also include corrections for small PID inefficiencies and detector acceptance which were derived with the aid of a Monte Carlo simulation of the E788 out-of-beam detector system. Protons, neutrons, and ’s with realistic initial energy distributions were propagated through the target area and out-of-beam detector system. The response of the scintillator counters was modeled using an approximate form of the Bethe-Bloch equation of energy loss in the case of charged particles and the DEMONS software package Byrd92 for neutron interactions. Unmeasured energy losses in the target materials and detector wrappings, pion decays and interactions, and corrections for the non-linear response of the scintillator material at large energy deposition were also included. The tracking and particle identification was performed with the same code as used for the real data, and the results were used to derive the necessary corrections.
VII Extraction of Partial Rates
The decay modes considered in this analysis were the , , proton-stimulated, neutron-stimulated, and three-body nucleon-stimulated modes with branching fractions defined as:
| (13) |
where , and ; is the total number of hypernuclear events decaying to mode ; and is the total number of hypernuclear events found from the fit to the ground-state peak of the unbiased excitation spectrum of Fig. 3(a). This total also includes corrections for a hardware prescale in the unbiased trigger. The branching fraction was extracted by considering -tagged hypernuclear formation events, while the branching fraction was determined from the observed kinetic energy distribution. The nonmesonic decay branching fractions were extracted by two essentially independent methods utilizing (i) the single-particle kinetic energy spectra with final-state interactions and three-body decay contributions considered within a simple model, and (ii) multiple nucleon coincidence events. The final values for the branching fractions were then determined by a minimization that considers the mesonic and nonmesonic rates simultaneously.
VII.1 The Decay Mode
The decay rate was found by considering events for which one or more ’s were detected in coincidence with hypernuclear formation. The ’s were identified as described in Sec. III, and the candidate events were subject to the same cuts as the excitation spectra of Sec. IV. Three possible sources of -rays were considered for the rate extraction: decay, interactions, and accidental hits. Thus, the possible backgrounds include -tagged events arising from accidentals, ’s and ’s from quasifree decay, ’s from decay, and ’s from the decay background. To find the branching fraction, these background events were subtracted as described below.
In order to determine the quantitative contributions of each type of background, the various sources of ’s were isolated by considering -tagged events with particular excitation energies. First, events with excitation energy below MeV, which consist almost exclusively of accidental ’s and ’s from the decay background, were used to estimate the detection efficiencies for accidentals and ’s from decay. Next, the ’s from interactions were studied using events with excitation energy in the range MeV. These events consist of accidental ’s and ’s from the decay background (as in the previous case) with additional background events originating from quasifree decay. Using the accidental and decay detection probabilities determined above, the contribution from quasifree decay could be extracted, allowing the determination of the detection probability for ’s from interactions. Finally, the decay events were selected by requiring the excitation energy to be within of the ground-state peak and subtracting the background contributions found above.
After properly accounting for the backgrounds and detection efficiency, the branching fraction was found to be . So, for a embedded within the He hypernucleus, the decay rate:
| (14) |
expressed here in units of the total decay rate of the free , is enhanced by a factor of about 1.6 as compared to the free decay partial width of PDG06 . (The quantity was derived from the hypernuclear lifetime found in Sec. V).
VII.2 The Decay Mode
The decay rate was determined by a fit to the observed kinetic energy spectrum using a theoretical distribution provided by the model calculation of Kumagai-Fuse, et al. Izumi96 Their predicted spectrum [shown in Fig. 7(a)] was derived using the resonating group method and includes final-state interactions and pion distortion effects. The effects of detector acceptance and resolution unique to E788 were applied to the model by using the spectrum of Fig. 7(a) as input to the Monte Carlo simulation described in Sec. VI and reconstructing the initial kinetic energy distribution with the analysis code.
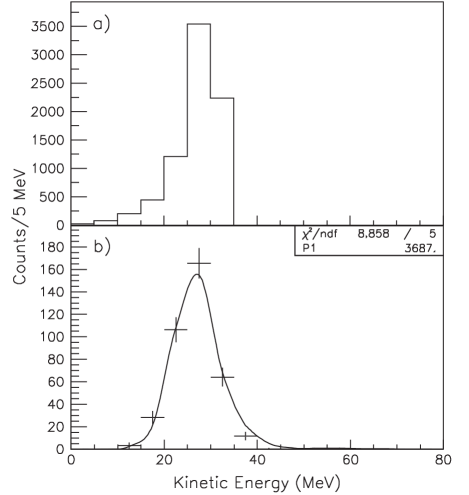
A fit of the model prediction to the PID-corrected spectrum of Fig. 7(b) was then performed using the fit function:
| (15) |
where is a parameterization of the expected kinetic energy distribution as reconstructed by the analysis code (normalized to the detector acceptance and in units of counts/bin per event) and is the fit parameter representing the acceptance-corrected number of pions within the excitation energy cut. The result of the fit is shown in Fig. 7(b) where the value of was found to be . Correcting for the excitation energy cut yields a value for the total number of ’s:
| (16) |
where is the ratio of the number of counts in the ground-state peak of the -tagged excitation spectrum of Fig. 3(c) to the number of events within the cut.
The -decay branching fraction for the He hypernucleus was then found by Eq. 13 as . In the present case of He decay, the observed decay rate:
| (17) |
in units of the free decay, is seen to be suppressed by a factor of about 2.2 as compared to the free decay value of PDG06 . This suppression is mainly due to the Pauli blocking of the final-state proton.
VII.3 Nonmesonic rates from single-particle KE spectra
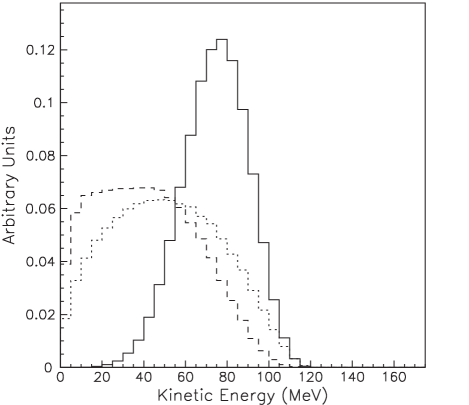
The rates for proton- and neutron-stimulated decay were extracted simultaneously from the observed proton and neutron kinetic energy spectra using a simple model that included the effects of final-state interactions (FSI). In the model, two types of decay events were considered: decay with no FSI (referred to here as no-scatter) and decay events where one of the decay nucleons scatters from one of the spectator nucleons (rescatter). The expected no-scatter and rescatter nucleon kinetic energy distributions (shown in Fig. 8) were derived from a Monte Carlo simulation of the interaction. (Also shown is the distribution for nucleons from decay, which will be discussed later in this section.) For the Monte Carlo events, the momenta of the four initial-state baryons were generated from a Gaussian distribution with an RMS width of 125 MeV/c for the nucleons and 50 MeV/c for the . The distributions were correlated such that the sum of the four momenta added to zero, and the energy of each spectator nucleon was determined by setting its mass to be on-shell. For no-scatter events, the energy distribution for the primary decay nucleons was determined by choosing a direction for the participating nucleon isotropically in the -nucleon center-of-mass frame and boosting to the laboratory system. The re-scatter events were simulated by choosing a direction for one of the nucleons isotropically in the decay-spectator nucleon system (s-wave) and boosting to the laboratory frame.
As in the case above, the expected kinetic energy distributions were fit to the observed spectra, and the results were combined with the model to extract the nucleon-stimulated decay rates. To include the effects of the resolution and acceptance of the detector system, the expected no-scatter and rescatter distributions of Fig. 8 were used as input to the Monte Carlo simulation discussed in Sec. VI and then reconstructed using the analysis code. The resulting spectra were designated for the nucleons that did not undergo FSI and for the rescattered nucleons. (These distributions differ for protons and neutrons due to differing energy resolutions and detection acceptance.) The distributions are in units of counts/bin per event and are normalized to the detector acceptance. The fits were then performed using functions of the form:
| (18) |
where and the fit parameters and represent the acceptance-corrected numbers of no-scatter and rescatter nucleons, respectively. The fit parameters and were related via our model as described below.
The effects of final-state interactions were incorporated by defining a rescatter probability, , as the probability for one of the primary-decay nucleons from decay to scatter off of one of the spectator nucleons. The value of was determined from the data as described below. The scattering processes were assumed to occur with equal probability (i.e., has the same value for all proton-neutron rescatter combinations). Since the effects of the FSI correction were seen to be small, this assumption was considered adequate. Assigning a probability to each possible final state in terms of the rescatter probability per spectator nucleon, , and the nucleon-stimulated branching fractions, and , then summing over no-scatter and rescatter nucleons yields:
| (19) | |||||
| (20) | |||||
| (21) | |||||
| (22) |
Using these expressions, the parameters and were eliminated from the fit functions:
| (23) | |||||
| (24) |
The three parameters , , and were then determined by a fit to the data (shown in Fig. 9). Since the fit shapes and include the effects of the detector efficiency and resolution, the observed nucleon kinetic energy spectra used for the fits were not efficiency corrected. The fits were carried out simultaneously by varying the quantity to obtain a minimum combined . Using the fit values, the nucleon-stimulated branching fractions were then calculated using Eqs. 19 and 20, and the results are listed in Table 4. The upper limits for the neutron-stimulated branching fraction and the ratio were determined by the prescription of Feldman and Cousins Feldman98 , which defines the confidence levels in a consistent way while imposing the physical boundary at zero. The upper limits are given at the 95% CL. Also listed are the results for the case of no FSI found by fixing the rescatter probability to zero.
| No FSI or | FSI | FSI + | Systematic Error | ||
|---|---|---|---|---|---|
| /d.o.f. | 0.78 | 0.72 | 0.69 | 0.71 | |
The model was also extended to include possible contributions from three-body decays. The expected kinetic energy distribution for these nucleons was generated using the same Monte Carlo code as for the interaction described above, and the resulting distribution is shown in Fig. 8. In this case, the momentum of the single on-shell spectator was initially selected, fixing the momentum and energy of the participating system. Final-state momenta for these three baryons were then selected in the system’s center-of-mass frame according to a phase-space distribution generated by the CERNLIB GENBOD code. The nucleon momenta were then boosted to the laboratory frame.
As in the case of FSI above, the contribution of decay, , was determined by a fit to the observed kinetic energy spectra of Fig. 9. Because the decay nucleons and rescattered nucleons are indistinguishable at the level of statistics of the current measurement, the fits were performed with an that consisted of a linear combination of the and rescatter distributions. The results for the nucleon-stimulated branching fractions are shown in Table 4 for the cases of (i) decay with no FSI for the decays (i.e., ) and (ii) a mixture of decay and FSI with equal strengths (i.e., the quantity consisted of a 50/50 mixture of decay events and rescattered decay events). From the case of FSI, the upper limit for the contribution of final-state interactions to the total decay rate was found as (95% CL). Also, the multibaryon decay branching fraction found for the case of decay with no FSI gives an upper limit of (95% CL) for the contribution of the decay process.
VII.4 Nonmesonic rates from multiple nucleon coincidence data
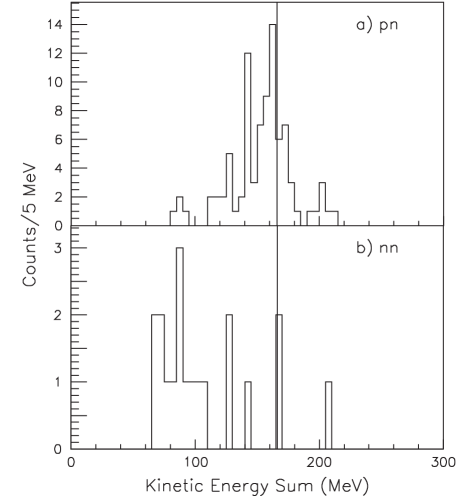
The interaction produces two energetic nucleons that may be detected in the out-of-beam detector arrays resulting in both proton–neutron () and neutron–neutron () coincidence events. The observation of such events gives another window onto the nucleon-stimulated decay process. In the present experiment, a total of 87 coincidence events and 19 coincidence events were observed. These events were subject to the same in-beam tracking cuts as the excitation spectra of Sec. IV along with a excitation energy cut. The protons and neutrons were identified in the out-of-beam detector arrays as described in Sec. III.
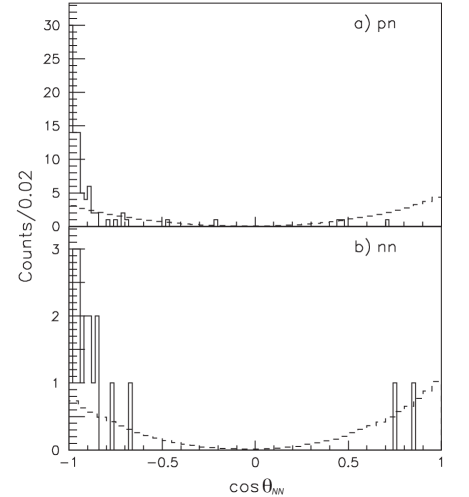
The cosine of the separation angle for the two final-state nucleons, , is shown in Figures 10(a) and 10(b) for and coincidence events, respectively. If the spectator nucleons are ignored, the two nucleons resulting from the interaction would be expected to emerge roughly back-to-back with a separation angle near 180∘ (from simple momentum conservation). The observed distribution for events is strongly peaked near the value of 180∘ with only about 10% of the events having a separation angle less than 140∘. The latter events may be indicative of FSI or decay contributions. The number of counts is low in the spectrum, but the back-to-back peak does not seem to be as pronounced for these events. The distributions for the sum of the kinetic energies of the coincident nucleons are shown in Fig. 11. For the interaction, the total energy available to the two decay nucleons is 166 MeV (i.e., the difference in the and masses less the binding energy of the hypernucleus). The kinetic energy distribution of Fig. 11(a) peaks near 166 MeV as expected. The observed spread is largely consistent with a spread due to the Fermi momentum of the baryons within the nucleus coupled with detector resolution, and the apparent tail out to lower energies may be the result of FSI or decays. (The observed spectrum is in qualitative agreement with the results of a Monte Carlo simulation which includes such effects.) The kinetic energy distribution of Fig. 11(b), on the other hand, does not behave as expected and may be indicative of coincidence events originating from sources other than decays (i.e., some mixture of background neutrons and neutrons from or decays).
The nucleon-stimulated branching fractions were extracted from the observed and coincidence events by relating the number of each type of coincidence event to the branching fractions as:
| (25) | |||||
| (26) |
where is the fraction of a Gaussian distribution contained within of the mean, is the probability of detecting exactly one accidental neutron per event, is the probability of detecting one proton from decay, is the probability of detecting one proton and one neutron from decay, and and are the probabilities of detecting one and two neutrons from decay, respectively. With the exception of , which was extracted from the data, the above detection probabilities had to be estimated using the Monte Carlo simulation described in the previous section. Final-state interactions were included in the Monte Carlo at the level determined for the case of FSI only.
The term appearing in Eq. 26 is the expected number of background events due to accidental neutrons, neutrons from absorption, and neutrons from proton-stimulated decays. As with the accidental detection probability above, the detection probabilities for neutrons from interactions were determined from the data with no presumptions about the extent of FSI or decays, while the detection probabilities for neutrons from decay were again estimated using the Monte Carlo with FSI included. The number of expected background coincidence events was found to be with the largest contribution arising from neutrons from absorption (13 events). Such a large background is consistent with the observed energy-sum spectrum of Fig. 11(b).
The resulting values for the branching fractions are listed in Table 5 along with the results from the analysis of the single-particle spectra of the previous section for the case of FSI only. Also shown is the weighted average of the two determinations.
| Single-Particle | Multiple Coincidence | Average | |
|---|---|---|---|
In addition to the and events, a handful of coincidence events were also observed and were used to set an upper limit on the branching fraction. After the in-beam tracking cuts and excitation energy cut, a total of 8 coincidence events remained. Although these events may be indicative of a three-body decay mode, they could also be decay events for which the spectator proton has been detected. As in the and cases, the number of events of each type may be expressed in terms of the branching fractions as:
| (27) | |||||
| (28) |
where is the measured efficiency of the charged trigger, and are the probabilities of detecting two protons from and decay, respectively, and is the branching fraction. The probability of detecting two protons from decay is negligibly small when interactions with the spectator nucleons are ignored, but when FSI is included at the level determined in Sec. VII.3, it becomes significant. The probabilities and were estimated using the Monte Carlo simulation discussed in Sec. VII.3, including FSI for the case. The expected number of background events, , was then calculated from Eq. 27 as . Assuming Poisson statistics and using the prescription of Feldman and Cousins Feldman98 , the upper limit for the number of observed events originating from decay was found as (95% CL for a total number of 8 observed counts and an expected background of 6 counts). Using Eq. 28, the upper limit for the branching fraction was then found as .
As mentioned above, the contribution from decay events becomes negligible when final-state interactions are ignored. In this case, all 8 observed events are considered to have originated from decay, and the branching fraction is found to lie in the range at the 95% CL.
VII.5 Combined decay rates
The final values for the branching fractions were determined by considering a set of parameters (, , , , ) representing the , , proton- and neutron-stimulated branching fractions along with the total number of hypernuclei. The optimal values for this set of parameters were found by minimizing a function of the form:
| (29) |
where the values are the acceptance-corrected numbers of event type with associated error . Additionally, the parameters representing the branching fractions were subject to the constraint:
| (30) |
and any possible contributions from three-body decay, which were previously seen to be small, were neglected. The minimization was carried out using the ROOT MINUIT minimization routine, and the results are listed in Table 6 (in units of ).
| Mesonic rates | Nonmesonic rates | ||
|---|---|---|---|
VIII Discussion
The decay rates determined in the present work are listed in Table 7 (in units of ). Also listed are the results of another measurement of decay performed by Outa et al Outa98 along with the results of some earlier bubble chamber experiments Reinhard92 ; Block64 ; Fetkovich72 . The values taken from reference Reinhard92 are the result of a reanalysis of various older results performed by Schumacher. The decay rates found in this work are seen to be in good agreement with past measurements.
The results reported for the experiment of Outa et al were published in 1998, some 8 years after the running of our experiment. Their experiment created by the reaction and detected the , , and protons from the subsequent weak decay. Unlike our experiment, their apparatus was not able to detect neutrons, requiring them to determine the neutron-stimulated rate by subtraction. Our results for the neutron-stimulated rate and neutron to proton ratio, and , provide stricter upper limits as compared to and for Outa et al (all at the 95% CL). The upper limits for Outa et al given above were derived from the results listed in Table 7 using the same method as for our results. There is also a slight difference in the mesonic decay rates, where our ratio is seen to be in better agreement with the earlier bubble chamber results.
Selected theoretical investigations of the nonmesonic partial decay rates are shown in Table 8. These OPE (one pion exchange) models incorporate a quark-based model for short range interactions and are currently considered to be the most successful of the OPE-based models. The results of Jun Jun01 and Inoue et al Inoue98 are shown for OPE only and OPE + quark interaction mechanism. The work of Jun utilizes a phenomenological 4-baryon point interaction model to describe the short range quark interactions, while Inoue et al uses a direct quark (DQ) interaction based on the effective weak Hamiltonian of Gilman and Wise Gilman79 . The calculation of Sasaki et al Sasaki05 employs the direct quark mechanism of Inoue et al coupled with a exchange potential. Unlike previous models, this model is able to reproduce the value of the proton asymmetry observed in polarized nonmesonic decay. All of the above models adequately reproduce the observed nonmesonic decay rates.
In regards to the rule, it is interesting to note that the direct quark models predict a significant contribution from transitions arising from the effective weak Hamiltonian used, while models based on the phenomenological 4-baryon point interaction are able to reproduce the experimental results with little or no component. All of these models enforce the rule for the meson-exchange component.
| This work | Outa et al Outa98 | Earlier results | |
|---|---|---|---|
| Reinhard92 | |||
| Block64 | |||
| Fetkovich72 | |||
| Keyes76 | |||
| Reinhard92 | |||
| Block64 | |||
| Fetkovich72 |
| Jun Jun01 | Inoue Inoue98 | Sasaki Sasaki05 | |||
|---|---|---|---|---|---|
| OPE | OPE+4BPI | OPE | OPE+DQ | DQ+ | |
| 0.0008 | 0.0373 | 0.009 | 0.038 | 0.015 | |
| 0.1478 | 0.1602 | 0.145 | 0.214 | 0.169 | |
| 0.1486 | 0.1975 | 0.154 | 0.253 | 0.184 | |
| 0.005 | 0.23 | 0.061 | 0.178 | 0.091 | |
VIII.1 FSI, three-body decays, and interference effects
Using the simple model for nonmesonic decay introduced in Sec. VII.3, the contributions of final-state interactions and three-body decays were studied utilizing the single-particle proton and neutron kinetic energy spectra, and upper limits for each case were determined as:
| (31) |
for final-state interactions and decays, respectively (95% CL). Within the model used here, the effects of FSI and decays on pertinent quantities were seen to be small and, thus, have little effect on the final interpretation of the data.
In the analysis of the nonmesonic decay rates, the various decay modes have been assumed to add incoherently, neglecting possible quantum interference effects. It has been suggested Garbarino04 ; Oka04 that such interference effects may be the origin of the so-called puzzle, and Garbarino et al Garbarino04 point out that any interference effects would be less pronounced for multiple coincidence measurements, providing a cleaner extraction of the nonmesonic decay rates. For the case of presented here, the results of the two determinations (listed in Table 5) are consistent, suggesting that interference effects are not significant at this level of statistics. A detailed study of the angular correlations in the multiple nucleon coincidence data might shed more light on the contributions of interference effects as well as FSI and decays, but the number of coincidence events in the present data set is too limited to provide anything conclusive.
VIII.2 Phenomenological analysis of -shell hypernuclei
As mentioned in the introduction, measurements of the nonmesonic decay rates for the -shell hypernucleus are currently quite limited. The most recent results from Outa et al Outa98 give a value for the total nonmesonic rate of , but no measurements of the proton- and neutron-stimulated partial rates have been made. Using the present results for , these partial rates can be calculated in the context of the previously described phenomenological model of Block and Dalitz.
From Eq. 7, the upper limit of determined for the current measurement implies an upper limit of for the proton-stimulated rate under the assumption of pure transitions. A measurement of the proton-stimulated rate greater than this value would indicate a violation of the rule for the weak interaction. The neutron-stimulated decay rate was found from Eq. 8 as . This calculation utilizes the result of Outa et al for the ratio of the neutron- to proton-stimulated rates for He, Outa05 , but makes no assumptions regarding the rule. Using this result, an alternate determination of the proton-stimulated rate can be made from the result of Outa et al for the total nonmesonic decay width of :
| (32) |
which, again, is independent of any assumptions about the isospin nature of the interaction. Because of the large error, this result is consistent with the upper limit found above. Thus, at the present level of statistics for the measurement, nothing conclusive can be said about the rule for the weak interaction.
The values of the nonmesonic decay rates derived from the above discussion represent the most current knowledge (although indirect) of the proton- and neutron-stimulated partial rates. The upper limit determined for the proton-stimulated decay rate suggests a direct measurement of this decay mode as an easy test of the rule for nucleon-stimulated decays (i.e., a measurement in excess of this upper limit would show a clear violation of the rule for the weak interaction). Measurements of the nonmesonic decay rates along with more precise determinations of the and nonmesonic decay rates would help to further determine the isospin structure of the weak interaction. Multiple nucleon coincidence studies can potentially provide the cleanest extraction of the nucleon-stimulated partial rates and would be a worthwhile avenue of future research.
Acknowledgements.
This work was partially supported by U.S. DOE grant nos. DE-FG02-87ER40315, DE-AC02-98CH10886, and DE-FG03-94ER40821.References
- (1) L.B. Okun, Leptons and Quarks (North–Holland, Amsterdam, 1982).
- (2) N. Isgur, K. Maltman, J. Weinstein, and T. Barnes, Phys. Rev. Lett. 64, 161 (1990).
- (3) W.-M. Yao et al., J. Phys G 33, 1 (2006).
- (4) K. Maltman and M. Shmatikov, Nucl. Phys. A585, 343c (1995); T. Inoue, S. Takeuchi, and M. Oka, ibid. A597, 563 (1996).
- (5) T. Inoue, M. Oka, T. Motoba, and K. Itonaga, Nucl. Phys. A633, 312 (1998).
- (6) K. Sasaki, M. Izaki, and M. Oka, Phys. Rev. C 71, 035502 (2005).
- (7) M.M. Block and R.H. Dalitz, Phys. Rev. Lett. 11, 96 (1963); C.B. Dover, Few-Body Systems, Suppl. 2, 77 (1987); J. Cohen, Phys. Rev. C 42, 2724 (1990); R.A. Schumacher, in Properties and Interactions of Hyperons, Proceedings of the U.S.-Japan Seminar, Maui, Hawaii, edited by B.F. Gibson, P.D. Barnes, and K. Nakai (World Scientific, Singapore, 1994), p.85.
- (8) R.A. Schumacher, Nucl. Phys. A547, 143c (1992).
- (9) H. Outa et al., Nucl. Phys. A754, 157c (2005).
- (10) G. Keyes, J. Sacton, J.H. Wickens, and M.M. Block, Nuovo Cimento 31A, 401 (1976).
- (11) R.C. Byrd, P.L. McGaughey, W.C. Sailor, R.C. Hammock, and Y. Yariv, Nucl. Instrum. Methods A313, 437 (1992).
- (12) I. Kumagai-Fuse, S. Okabe, and Y. Akaishi, Phys. Rev. C 54, 2843 (1996).
- (13) G.J. Feldman and R.D. Cousins, Phys. Rev. D 57, 3873 (1998).
- (14) H. Outa, M. Aoki, R.S. Hayano, T. Ishikawa, M. Iwasaki, A. Sakaguchi, E. Takada, H. Tamura, and T. Yamazaki, Nucl. Phys. A639, 251c (1998).
- (15) M.M. Block et al., in Proceedings of the International Conference on Hyperfragments, St. Cergue, Switzerland, 1963, edited by W.O. Lock (CERN, Geneva, Switzerland, 1964), p. 63.
- (16) J.G. Fetkovich, J. McKenzie, B.R. Riley, I-T. Wang, M. Derrick, T. Fields, L.G. Hyman, and G. Keyes, Phys. Rev. D 6, 3069 (1972).
- (17) J.H. Jun, Phys. Rev. C 63, 044012 (2001).
- (18) F.J. Gilman and M.B. Wise, Phys. Rev. D 20, 2392 (1979).
- (19) M. Oka, Nucl. Phys. A754, 117 (2005).
- (20) G. Garbarino, A. Parreño, and A. Ramos, Phys. Rev. C 69, 054603 (2004).