Chemical Differences between K and Na in Alkali Cobaltates
Abstract
KxCoO2 shares many similarities with NaxCoO2, as well as some important differences (no hydration-induced superconductivity has been reported). At K, K0.5CoO2 becomes an insulator with a tiny optical gap as happens in Na0.5CoO2 at 52 K. This similarity, with a known common structure, enables direct comparisons to be made. Using the K-zigzag structure recently reported and the local density approximation, we compare and contrast these cobaltates at =0.5. Although the electronic structures are quite similar as expected, substantial differences are observed near the Fermi level. These differences are found to be attributable mostly to the chemical, rather than structural difference: although Na is normally considered to be fully ion, K has somewhat more highly ionic character than does Na in these cobaltates.
pacs:
71.20.Be,71.18.+y,71.27.+aI Introduction
Takada et al. found superconductivity in the layered quasi-two dimensional NaxCoO2 when intercalating enough water (H2O) to form a separate water layer between CoO2 and Na layers.takada The nonsuperconducting dehydrated NaxCoO2 system shows a rich phase diagram, which significantly depends on .foo For , the system shows weakly correlated band-like behavior including Pauli paramagnetism, while the phase reveals correlated behavior such as large enhancement in linear specific coefficient, Curie-Weiss susceptibility,prb04 and magnetic ordering for .
The most peculiar aspect of this system is an insulating phase at foo with a tiny gap meV.ncogap As the temperature is decreased, antiferromagnetic ordering of some Co spins appears at K, and at K there is a gap opening, which reflects the charge-ordering of nonmagnetic Co1 ions and magnetic Co2 ions.mit ; yokoi Using neutron diffraction studies, Williams et al. inferred the charge difference of 0.12 between Co1 and Co2.cava2 This value is much smaller than the 1 value expected from a naive formal charge concept, but is roughly consistent with the theoretically calculated value 0.2 using a correlated band theory LDA+U method.prl05 ; prl06 As a result, even though there is small charge difference between the Co ions, the charge-disproportionation is accompanied by local moment formation and the spins are consistent with the formal valences Co3+ and Co4+.prl05 ; prl06
The discovery of an unexpected insulating state in Na0.5CoO2 (N0.5CO) and hydration-induced superconductivity has stimulated the study of isostructural and isovalent family AxCoO2 (A = K, Rb, Cs). In spite of a few attempts to produce superconductivity in hydrated KxCoO2, the amount of intercalated water is 0.8 or less, forming only a monohydrate (K+H2O) layer and no superconductivity has been detected yet.fu ; tang
The KxCoO2 system has been known for three decades, since Hagenmuller and colleagues reportedhagen1 ; hagen2 structure, transport, and magnetic data on phases with =1.0, 0.67, and 0.50. Recently, an insulating phase in K0.5CoO2 (K0.5CO) has been studied in more detail by a few groups;watanabe ; qian Nakamura et al.nakamura in the mid-1990s had reported an almost temperature-independent resistivity well above a metallic value. In K0.5CO, using NMR and neutron diffraction studies, Watanabe et al. observed similar temperature evolution as in N0.5CO.watanabe At K, a kink in the in-plane susceptibility indicates onset of antiferromagnetic ordering. The resistivity increases sharply at K, signaling the charge-ordering. At this temperature, there is an additional magnetic rearrangement, indicated by kinks in both and . From SR experiments Sugiyama et al. have obtained similar transition temperatures, 60 and 16 K, in metallic K0.49CO.sugiyama The former is a magnetic ordering temperature from a paramagnetic state. Based on a mean field treatment of a Hubbard model, they suggested there may be a linear spin density wave (SDW) state between 16 and 60 K, while a commensurate helical SDW state exists below 16 K. Additionally, K or Na ions order (structurally), resulting in formation of a 2 supercell at T and 470 K for K and Na ions, respectively.watanabe The tiny energy gap of similar magnitude with N0.5CO has been observed by Qian et al. with ARPES measurements.qian
Several characteristics of NxCO, in particular the superconductivity upon hydration and effects of cation ordering, suggest that the behavior in this system is sensitive to details of the electronic structure. The fact that K0.5CO is similar to N0.5CO, yet shows clear differences in behavior, indicates that a comparison of the electronic structures of these systems is warranted. In this paper, we compare and contrast the two insulating systems K0.5CO and N0.5CO. Here correlation effects and detailed magnetic ordering are neglected, but the observed supercell including Na/K zigzag ordering is adopted. ( is the hexagonal lattice constant.)
| parameters | (Å) | (Å) | (Å) |
|---|---|---|---|
| Na0.5CoO2 | 2.814 | 11.06 | 0.971, 0.949, 0.983 |
| K0.5CoO2 | 2.831 | 12.50 | 0.965, 0.946, 0.981 |
II Crystal Structure and Calculation Method
Although some aspects of the structure in the sodium cobaltates are still controversial (especially the alkali metal ordering), all existing information for =0.5 are based on the basic hexagonal structure. Recently, Watanabe et al. observed the orthorhombic superstructure from a K-zigzag pattern for K0.5CO.watanabe For comparison, we have used this orthorhombic structure for both cobaltates.cava1 ; cava2 As shown in Table 1, in this structure the oxygens have three different site symmetries and slightly different O heights (from the Co layers), leading to distorted CoO6 octahedra. The averaged Co–O–Co bond angle is about 96.5∘ for K0.5CO and 95.4∘ for N0.5CO (this angle would be 90∘ for undistorted octahedra). This distortion makes the three-fold manifold split into singlet and doublet bands.
The calculations reported here were carried out within the local density approximation (LDA), using the full-potential local-orbital method (FPLO).fplo The basis sets were chosen as for Co and K, for Na, and for O. (The orbitals in parentheses denote semicore orbitals.) The Brillouin zone was sampled with 98 irreducible points.
III Results
III.1 Magnetic energy
In NxCO, the FM state is generically favored energetically within LDA,singh00 ; prb04 although this picture is physically correct only for 0.7 0.9. Our calculations show this tendency is also true for KxCO. The magnetization energy, defined by the energy difference between nonmagnetic and ferromagnetic states, in N0.5CO is 22 meV/Co, and the energy in K0.5CO slightly increases to 26 meV/Co. The small energy difference can be attributed to the higher magnetic moment on Co in K0.5CO, resulting from longer parameter in K0.5CO. (This larger lattice constant results in increasing charge of each Co ion by 0.02 in K0.5CO, see below.) From a simple Stoner picture, the small magnetization energy is consistent with small total magnetic moment of 0.5 /Co.
III.2 Electronic structure
Now we will focus on the nonmagnetic state to understand the microscopic chemical differences. As observed previously for all in NxCO,singh00 ; prb04 the crystal field splitting between the partially occupied manifold with 1.3 eV width and the unoccupied manifold with 1 eV width is 2.5 eV. The large splitting makes the manifold irrelevant for low energy considerations.
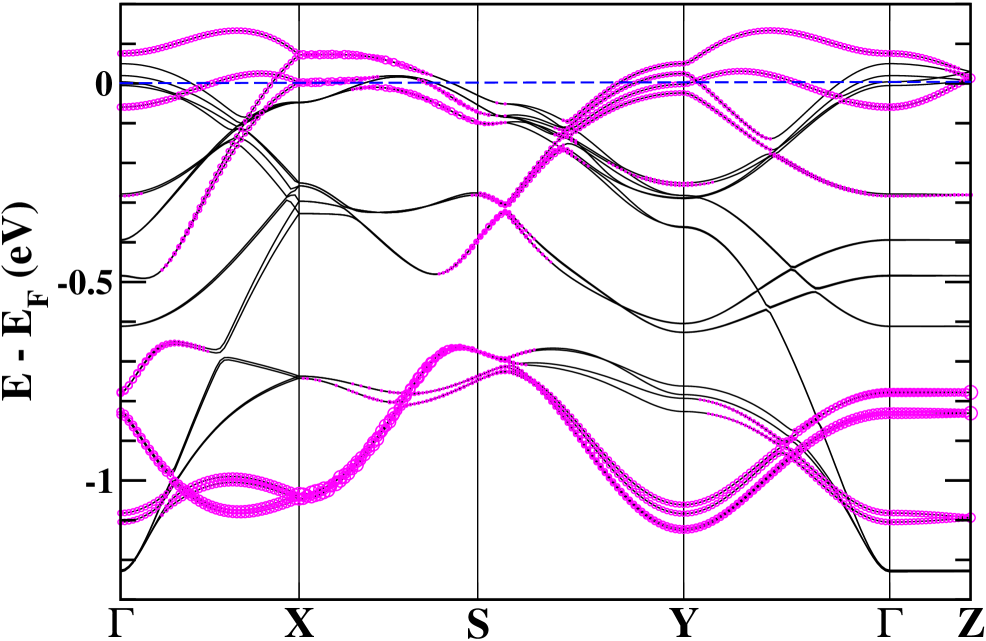
The band structure of the manifold, showing strong two-dimensionality, is given in Fig. 1. (This two-dimensionality is reflected in the Fermi surfaces displayed in Fig. LABEL:FS.) The character emphasized by the thickened (or colored) lines is represented by the “fatband” technique in Fig. 1. The character appears at both the bottom and top of the manifold, but the character is a little stronger in the bottom. This behavior is also observed in N0.5CO.
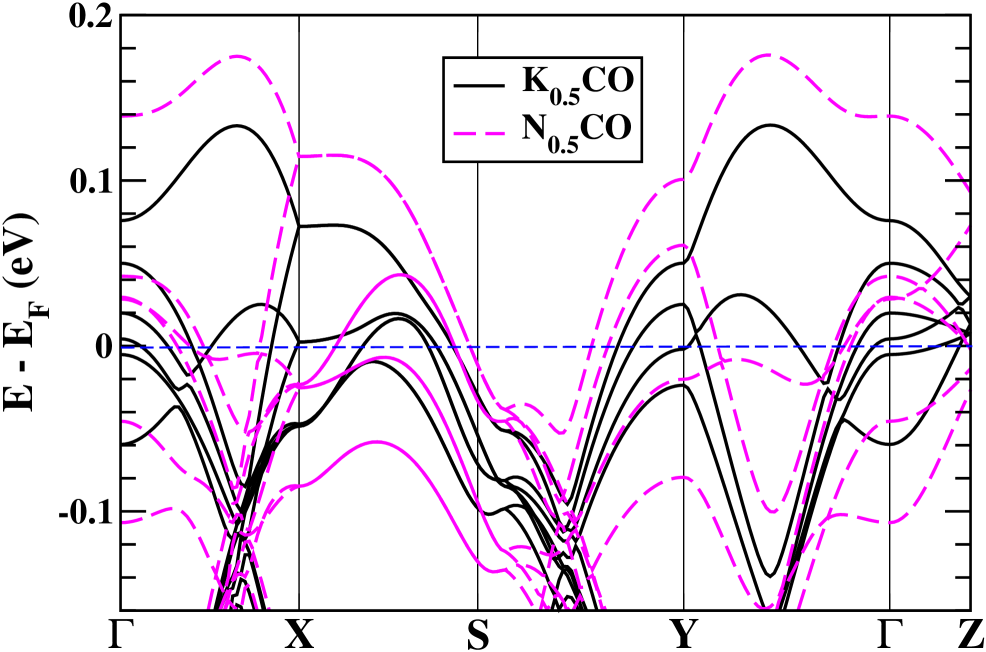
As expected from the larger lattice constant, K0.5CO has a smaller bandwidth, seen in both the O bands (not shown here) and Co bands. The change in the bandwidth appears clearly at the top valence band in the enlarged band structures near depicted in the top panel of Fig. 3. The top valence band of K0.5CO has about 60 meV lower energy at the point and contains less holes, leading to additional crossing valence band near the point and along the line. This crossing produces additional Fermi surfaces of unfolded scroll-like shape along the line, as displayed in (b) and (c) of Fig. LABEL:FS. These Fermi surfaces are almost flat near the point, suggesting enhancement of nesting effects. These nesting effects would lead to SDW, suggested in K0.49CO by Sugiyama et al. Absence of these Fermi surfaces in N0.5CO may explain why SDW does not occur in the system.
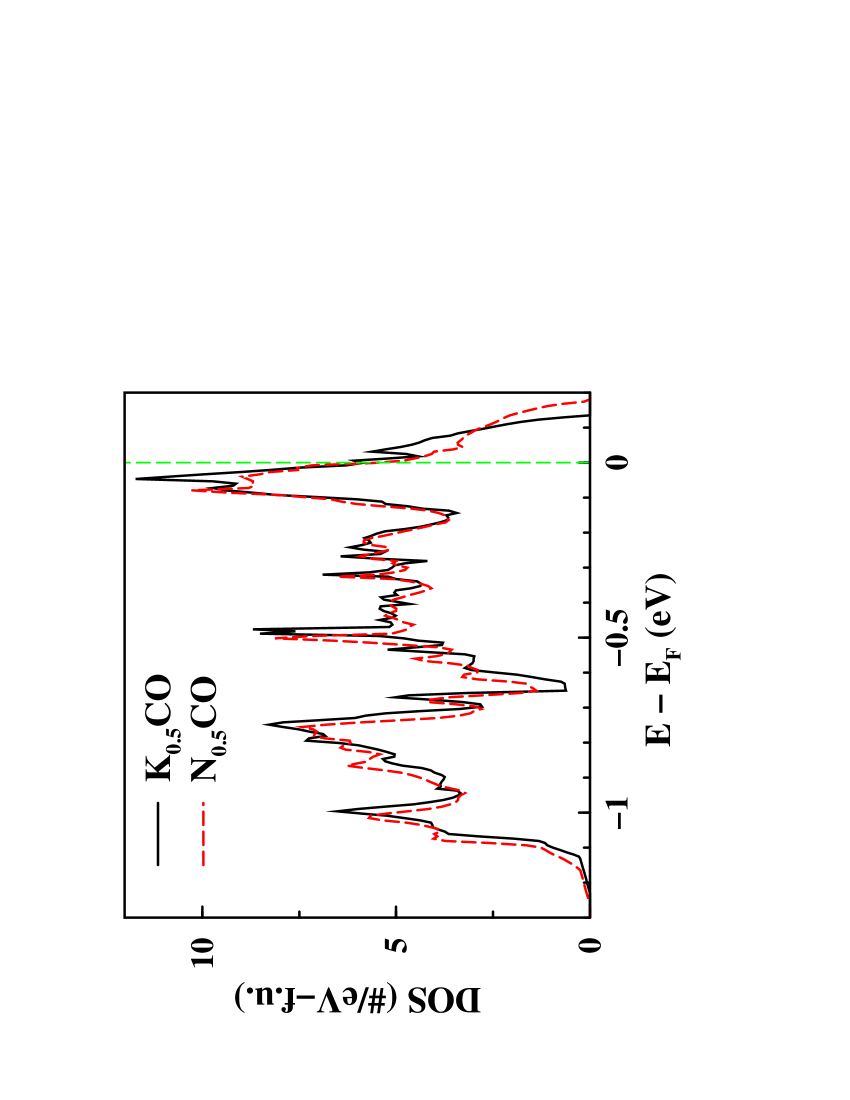
An important distinction is the stronger two-dimensionality in K0.5CO. At the and points and along the - line, near there are nearly flat bands and saddle points in K0.5CO. The bottom panel of Fig. 3 displays a comparison of the DOS of the two cobaltates in the regime. Strikingly, the Fermi energy (set to zero) of K0.5CO lies midway between two sharp peaks at and meV. In addition, a van Hove singularity appears just above (at less than 10 meV). These more complicated structures near lead to 10% higher DOS at , suggesting an increased tendency toward magnetic instability.
| atom | A | Co | O | |||||||||
|---|---|---|---|---|---|---|---|---|---|---|---|---|
| site label | ||||||||||||
| K0.5CO | +0.72 | +0.68 | +0.70 | +1.58 | +1.60 | +1.59 | ||||||
| N0.5CO | +0.64 | +0.63 | +0.63 | +1.60 | +1.62 | +1.61 | ||||||
| N0.5CO∗ | +0.64 | +0.61 | +0.63 | +1.59 | +1.60 | +1.59 | ||||||
III.3 Identifying differences
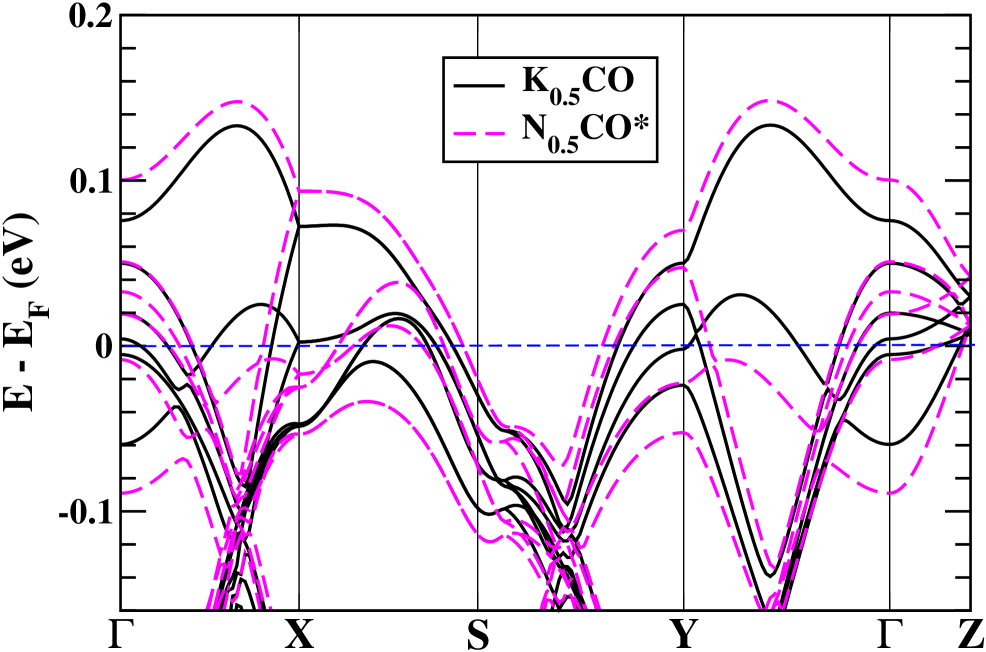
These differences between two cobaltates can be clarified in two ways. First, we can determine the effects purely due to chemical difference (K vs. Na) as opposed to the size difference leading to structural differences. For this, N0.5CO is assigned the same structure as in K0.5CO and denoted N0.5CO∗. The resulting band structure enlarged near is compared with that of K0.5CO in Fig. 4. Even in the identical structure, substantial differences on an important energy scale are evident. The top valence band in N0.5CO∗ is 20 meV higher in energy at the point, although the bandwidth is about 5% smaller (not shown). Another difference is that the projected K and Na DOS is almost identical (and small, of course) through most of the bands, except in a meV region at and below the Fermi level, where the Na projected DOS (PDOS) is 20-35% larger (more than 50% larger at EF). These distinctions indicate that the differences in electronic structure are mainly due to K substitution itself rather than indirectly through the change in structure.
Second, using the Mullikan charge decomposition, we obtained atom-decomposed charges, which are displayed in Table 2. The K ion is very noticeably more ionic than the Na ion, consistent with the PDOS difference mentioned just above. The compensating charge is spread over the oxygen ions; the Co charges are essentially the same for K0.5CO and N0.5CO∗. This higher ionicity of K seems to be the most discernible difference between these cobaltates.
III.4 Comments on hydration
It is still unclear what water does in the system. The only unambiguously aspect is that hydration dramatically increases the lattice constant, resulting in more two-dimensionality of the electronic system.water However, although the isostructural system Na1/3TaS2H2O shows very similar change in the lattice constant when hydrated,prb04 K in this system is independent of . This difference in behavior established that water has effects in the cobaltates that are not present in the transition metal disulfides and diselenides. In this respect it is interesting that (Na0.27K0.12)CoO20.87H2O shows superconductivity with K and about 7 Å increment in lattice constant from K0.55CO, which is similar in amount to that of hydrated sodium cobaltate.sasaki
IV Summary
Using a crystal structure recently reported, we have investigated at the LDA level the differences in electronic structure between K0.5CoO2 and N0.5CoO2. Comparison shows a few substantial differences near ; smaller bandwidth by 60 meV in K0.5CoO2, and additional Fermi surfaces along the line which are almost flat near the point. These differences are due more to chemical differences (higher ionic character of K) rather than to structural difference between the systems.
An angle-resolved photoemission comparison of the three systems AxCoO2, A = Na, K, and Rb, has appeared,arakane with the differences at equal doping levels being small almost too small to quantify. Unfortunately, samples at precisely =0.5 were not the focus of that study. Since the superstructure we have studied is confined to =0.5, our results cannot be compared with this data. However, the structural disorder of the alkali at 0.5, which extends to the CoO2 substructure, broadens the bands and hides small distinctions.deepa This observation suggests that carrying out spectroscopic studies of both systems in the insulating phase at =0.5 should be an excellent way to identify and characterize more precisely the effects of the different alkali cations.
V Acknowledgments
We acknowledge M. D. Johannes and D. J. Singh for illuminating conversations, and D. Qian for clarifying the ARPES data. This work was supported by DOE grant DE-FG03-01ER45876 and DOE’s Computational Materials Science Network. W.E.P. acknowledges the stimulating influence of DOE’s Stockpile Stewardship Academic Alliance Program.
References
- (1) K. Takada, H. Sakurai, E. Takayama-Muromachi, F. Izumi, R. A. Dilanian, and T. Sasaki, Nature 422, 53 (2003).
- (2) M. L. Foo, Y. Wang, S. Watauchi, H. W. Zandbergen, T. He, R. J. Cava, and N. P. Ong, Phys. Rev. Lett. 92, 247001 (2004).
- (3) K.-W. Lee, J. Kuneš, and W. E. Pickett, Phys. Rev. B 70, 045104 (2004).
- (4) N. L. Wang, D. Wu, G. Li, X. H. Chen, C. H. Wang, and X. G. Luo, Phys. Rev. Lett. 93, 147403 (2004); J. Hwang, J. Yang, T. Timusk, and F. C. Chou, Phys. Rev. B 72, 024549 (2005); S. Lupi, M. Ortolani, L. Baldassarre, P. Calvani, D. Prabhakaran, and A. T. Boothroyd, ibid. 72, 024550 (2005).
- (5) M. Yokoi, T. Moyoshi, Y. Kobayashi, M. Soda, Y. Yasui, M. Sato, and K. Kakurai, J. Phys. Soc. Jpn. 74, 3046 (2005).
- (6) G. Gašparovic̀, R. A. Ott, J.-H. Cho, F. C. Chou, Y. Chu, J. W. Lynn, and Y. S. Lee, Phys. Rev. Lett. 96, 046403 (2006).
- (7) A. J. Williams, J. P. Attfield, M. L. Foo, L. Viciu, and R. J. Cava, Phys. Rev. B 73, 134401 (2006).
- (8) K.-W. Lee, J. Kuneš, P. Novak, and W. E. Pickett, Phys. Rev. Lett. 94, 026403 (2005).
- (9) K.-W. Lee and W. E. Pickett, Phys. Rev. Lett. 96, 096403 (2006).
- (10) G.-C. Fu, C. Dong, M.-X. Li, J. Guo, and L.-H. Yang, Chin. Phys. Lett. 22, 1478 (2005).
- (11) H.-Y. Tang, H.-Y. Lin, M.-J. Wang, M.-Y. Liao, J.-L. Liu, F.-C. Hsu, and M.-K. Wu, Chem. Mater. 17, 2162 (2005).
- (12) C. Delmas, C. Fouassier, and P. Hagenmuller, J. Solid State Chem. 13, 165 (1975).
- (13) C. Fouassier, C. Delman, and P. Hagenmuller, Mat. Res. Bull. 19, 443 (1975).
- (14) D. Qian, L. Wray, D. Hsieh, D. Wu, J. L. Luo, N. L. Wang, A. Kuprin, A. Fedorov, R. J. Cava, L.Viciu, and M. Z. Hasan, Phys. Rev. Lett. 96, 046407 (2006).
- (15) H. Watanabe, Y. Mori, M. Yokoi, T. Moyoshi, M. Soda, Y. Yasui, Y. Kobayashi, M. Sato, N. Igawa, and K. Kakurai, J. Phys. Soc. Jpn. 75, 034716 (2006).
- (16) S. Nakamura, J. Ohtake, N. Yonezawa, and S. Iida, J. Phys. Soc. Jpn. 65, 358 (1996). Compared with the existing data for lattice constants, this sample does not seem to be exact phase, but . This assumption may be supported by the Curie-Weiss behavior in the sample.
- (17) J. Sugiyama, H. Nozaki, Y. Ikedo, K. Mukai, J. H. Brewer, E. J. Andreica, A. Amato, T. Fujii, and A. Asamitsu, Phys. Rev. Lett. 96, 037206 (2006).
- (18) Q. Huang, M. L. Foo, J. W. Lynn, H. W. Zandbergen, G. Lawes, Y. Wang, B. H. Toby, A. P. Ramirez, N. P. Ong, and R. J. Cava, J. Phys.: Condens. Matter 16, 5803 (2004).
- (19) K. Koepernik and H. Eschrig, Phys. Rev. B 59, 1743 (1999).
- (20) D. J. Singh, Phys. Rev. B 61, 13397 (2000).
- (21) C. A. Marianetti, G. Kotliar, and C. Ceder, Phys. Rev. Lett. 92, 196405 (2004); M. D. Johannes and D. J. Singh, Phys. Rev. B 70, 014507 (2004); R. Arita, ibid. 71, 132503 (2005).
- (22) H. Taniguchi, Y. Ebina, K. Takada, and T. Sasaki, Solid State Ionics 176, 2367 (2005).
- (23) T. Arakane, T. Sato, T. Takahashi, H. Ding, T. Fujii, and A. Asamitsu, J. Phys. Soc. Jpn. 76, 054704 (2007).
- (24) D. J. Singh and D. Kasinathan, Phys. Rev. Lett. 97, 016404 (2006).