NA60 results on spectra and the spectral function in In-In collisions
Abstract
The NA60 experiment at the CERN SPS has studied low-mass muon pairs in 158 AGeV In-In collisions. A strong excess of pairs is observed above the yield expected from neutral meson decays. The unprecedented sample size of close to 400K events and the good mass resolution of about 2% have made it possible to isolate the excess by subtraction of the decay sources (keeping the ). The shape of the resulting mass spectrum exhibits considerable broadening, but essentially no shift in mass. The acceptance-corrected transverse-momentum spectra have a shape atypical for radial flow and show a significant mass dependence, pointing to different sources in different mass regions.
1 Introduction
Thermal dilepton production in the mass region below 1 GeV/c2 is largely mediated by the light vector mesons , and . Among these, the (770 MeV/c2) is the most important, due to its strong coupling to the channel and its short lifetime of only 1.3 fm/c. Changes both in width and in mass were originally suggested as precursor signatures of the chiral transition [1] and subsequent models have tied these changes directly [2] or indirectly [3] to chiral symmetry restoration.
2 Experimental results
Details of the NA60 apparatus can be found in [6, 7], while the different analysis steps (including the critical assessment of the combinatorial background from and decays through event mixing) are described in [8]. The results reported here were obtained from the analysis of data taken in 2003 for In-In at 158 AGeV. The left part of Fig. 1 shows the opposite-sign, background and signal dimuon mass spectra, integrated over all collision centralities. After subtracting the combinatorial background and the signal fake matches, the resulting net spectrum contains about 360 000 muon pairs in the mass range 0-2 GeV/c2, roughly 50% of the total available statistics. The associated average charged-particle multiplicity density measured by the vertex tracker is =120. Vector mesons and are completely resolved with a mass resolution at the of 20 MeV/c2. Most of the analysis is done in four classes of collision centrality (defined through the charged-particle multiplicity density): peripheral (430), semiperipheral (30110), semicentral (110170) and central (170240).
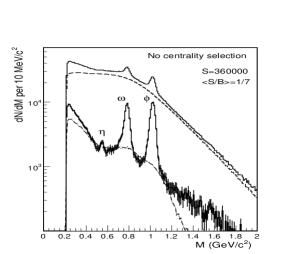
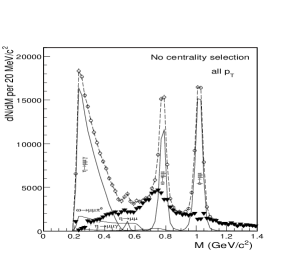
The peripheral data can essentially be described by the expected electromagnetic decays of the neutral mesons [4, 5]. This is not the case in the more central bins, due to the presence of a strong excess. To isolate this excess without any fits, a novel procedure has been devised [4, 5, 8]. The resulting spectrum for all centralities and all shows a a peaked structure residing on a broad continuum. The same feature can be seen for each centrality bin, with a yield strongly increasing with centrality, but remaining essentially centered around the position of the nominal pole.
A more quantitative analysis of the shape of the excess mass spectra vs. centrality has been performed, using a finer subdivision of the data into 12 centrality bins [5, 6]. On the basis of this analysis it is possible to rule out that the excess shape can be accounted for by the cocktail residing on a broad continuum, independent of centrality.
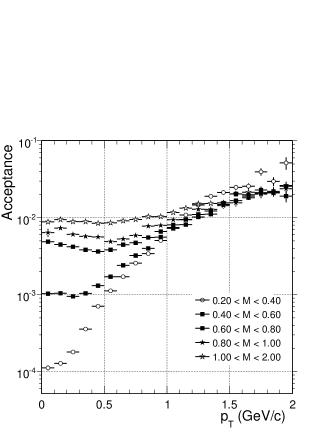
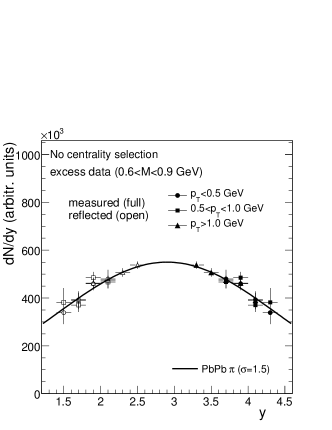

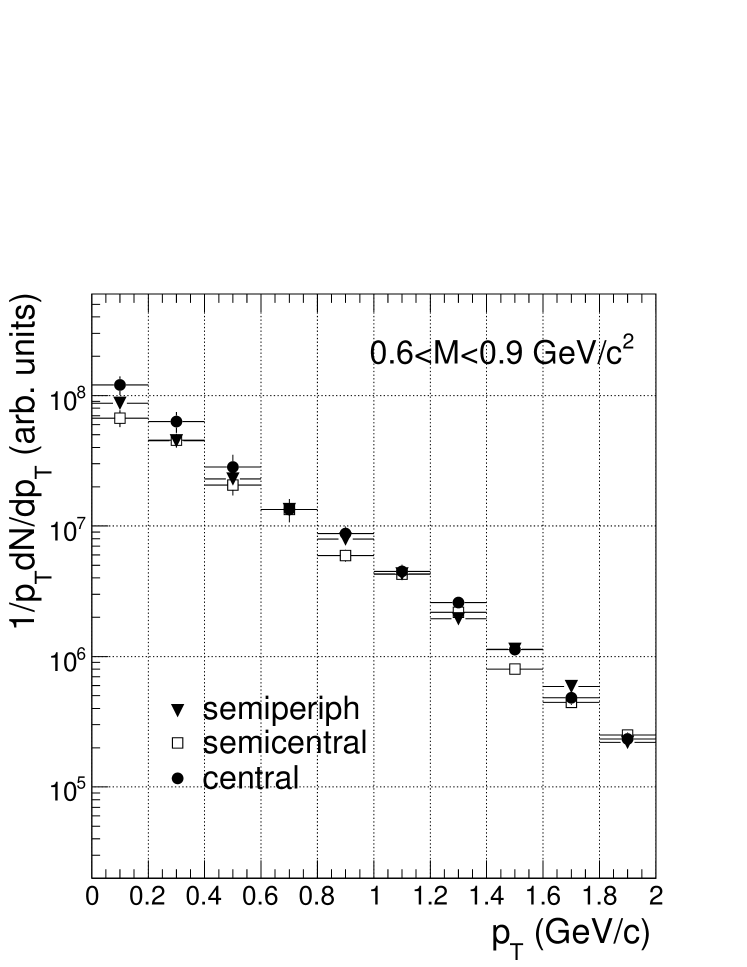
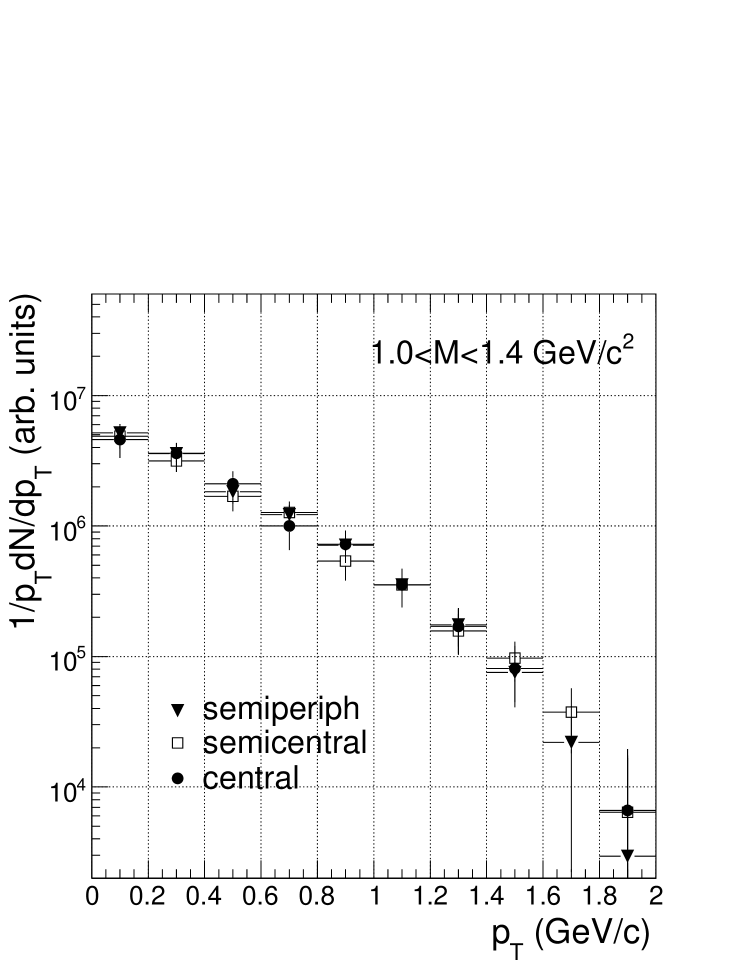
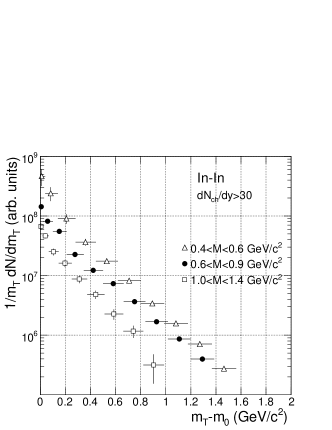
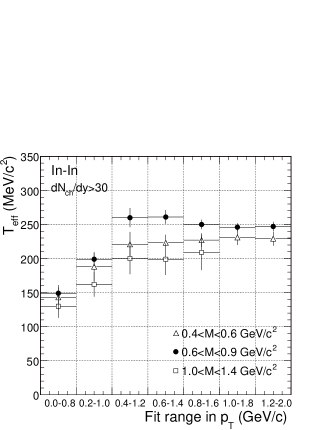
A differential analysis in was originaly performed and mass spectra associated with three different windows, without acceptance correction, were obtained [5]. The NA60 acceptance relative to as a function of as shown in Fig. 2 (left), implies that one should in principle perform the acceptance correction using a 3-dimensional grid in () space. This can lead, however, to large errors once the correction is applied. Instead, the correction is performed in 2-dimensional () space, using the measured rapidity distribution as an input. The latter was determined with an acceptance correction found, in an iterative way, from Monte Carlo simulations matched to the data in and . On the basis of this rapidity distribution, 0.1 GeV/ bins in M and 0.2 GeV/ bins in were used to determine the remaining 2-dimensional correction. After correction the results were integrated over the three extended mass windows , and GeV/c2. In Fig. 2 (right) the rapidity distribution of the central mass window is shown for three different windows, exhibiting a close resemblance to the distribution of inclusive pion production, as measured by NA49 for Pb-Pb and NA60 for In-In. The results for the acceptance-corrected spectra are summarized in Fig. 3. The errors shown are purely statistical. Systematic errors arise from the acceptance corrections including the rapidity distribution used, the subtraction of the cocktail, and the subtraction of the combinatorial background plus fake matches. For GeV/c, the combinatorial background contributes most, ranging from 10 to 25% for semiperipheral up to central. For GeV/c, the statistical errors dominate. The data show a significant dependence on mass, but hardly any on centrality. To bear out the differences in mass more clearly, the data were summed over the three more central bins and plotted in Fig. 4 (left) as a function of . The inverse slope parameter as determined from differential fits of the spectra with , using a sliding window in , is plotted on the right. Instead of flattening at very low as should be expected from radial flow, strikingly all spectra steepen, which is equivalent to very small values of . For comparison, the resonance, placed just in between the upper two mass windows, does flatten as expected. Moreover, depending on the fit region, covers an unusually large dynamic range. Finally, the largest masses have the steepest spectrum, i.e. the smallest value of everywhere, again contrary to radial flow and to what is usually observed for hadrons. All this suggests that different mass regions are coupled to basically different emission sources.
Summarizing, the previously measured excess mass spectra and the new acceptance-corrected and spectra present an unexpected behaviour. Beyond the spectral function this may lead to a better understanding of the continuum part of the spectra for GeV/c2, possibly disentangling parton-hadron duality.
References
References
- [1] R. D. Pisarski, Phys. Lett. 110B, 155 (1982)
- [2] G. E. Brown, M. Rho, Phys. Rept. 363, 85 (2002)
- [3] R. Rapp and J. Wambach, Adv. Nucl. Phys. 25, 1 (2000)
- [4] R. Arnaldi et al. (NA60 Collaboration), Phys. Rev. Lett. 96 (2006) 162302
- [5] S. Damjanovic et al. (NA60 Collaboration), nucl-ex/0609026; S. Damjanovic et al. (NA60 Collaboration), nucl-ex/0701015
- [6] G. Usai et al. (NA60 Collaboration), Eur. Phys. J. C43, 415 (2005); G. Usai et al. (NA60 Collaboration), these proceedings.
- [7] M. Keil et al., Nucl. Instrum. Meth. A539, 137 (2005) and A546, 448 (2005)
- [8] R. Shahoyan et al. (NA60 Collaboration), Nucl. Phys. A774, 677 (2006) R. Shahoyan et al. (NA60 Collaboration), these proceedings