Ultra-high Energy Predictions of proton-air Cross Sections from Accelerator Data
Abstract
We predict , the proton–air inelastic production cross section, at center-of-mass energies TeV, using high energy predictions from a saturated Froissart bound parameterization of accelerator data on forward and scattering amplitudes, together with Glauber theory. The parameterization of the and cross sections incorporates analyticity constraints and unitarity, allowing accurate extrapolations to ultra-high energies. Our predictions are in excellent agreement with cosmic ray extensive air shower measurements, both in magnitude and in energy dependence.
pacs:
13.60.Hb, 12.38.-t, 12.38.QkIntroduction. There are now available published p-air inelastic production cross sectionsfly ; akeno ; yakutsk ; eastop () that span the enormous cms (center-of-mass system) energy range TeV, reaching energies well above the Large Hadron Collider (LHC). Moreover, there are also now available very accurate predictions at cosmic ray energies for the total cross section, , from fitsblockhalzenpp to accelerator data that used adaptive data sifting algorithmssieve and analyticity constraintsblockanalyticity . However, extracting proton–proton cross sections from published cosmic ray observations of extensive air showers, and vice versa, is far from straightforwardengel . By a variety of experimental techniques, cosmic ray experiments map the atmospheric depth at which extensive air showers develop and measure the distribution of , the shower maximum, which is sensitive to the inelastic p-air cross section . From the measured distribution, the experimenters deduce . In this note we will compare published values of with predictions made from , using a Glauber model to obtain from .
from the distribution: Method I. The measured shower attenuation length () is not only sensitive to the interaction length of the protons in the atmosphere (), with
| (1) |
(with and in g cm-2, the proton mass in g, and the inelastic production cross section in mb), but also depends on the rate at which the energy of the primary proton is dissipated into electromagnetic shower energy observed in the experiment. The latter effect is parameterized in Eq. (1) by the parameter . The value of depends critically on the inclusive particle production cross section and its energy dependence in nucleon and meson interactions on the light nuclear target of the atmosphere (see Ref. engel ). We emphasize that the goal of the cosmic ray experiments is (or correspondingly, ), whereas in Method I, the measured quantity is . Thus, a significant drawback of Method I is that one needs a model of proton-air interactions to complete the loop between the measured attenuation length and the cross section , i.e., one needs the value of in Eq. (1) to compute . Shown in Table 1 are the widely varying values of used in the different experiments. Clearly the large range of -values, from 1.15 for EASTOPeastop to 1.6 for Fly’s Eyefly differ significantly, thus making the published values of unreliable. It is interesting to note the monotonic decrease over time in the ’s used in the different experiments, from 1.6 used in Fly’s Eye in 1984 to the 1.15 value used in EASTOP in 2007, showing the time evolution of Monte Carlo models of energy dissipation in showers. For comparison, Monte Carlo simulations made by Prykepryke in 2001 of several more modern shower models are also shown in Table 1. We see that even among modern shower models, the spread is still significant. The purpose of this letter is a proposal to minimize the impact of model dependence on the determination of .
| Experiment | k |
|---|---|
| Fly’s Eye | 1.6 |
| AGASSA | 1.5 |
| Yakutsk | 1.4 |
| EASTOP | 1.15 |
| Monte Carlo Results: C.L. Pryke | |
| Model | |
| CORSIKA-SIBYLL | |
| MOCCA–SIBYLL | |
| CORSIKA-QGSjet | |
| MOCCA–Internal | |
from the distribution: Method II. The HiRes groupbelov has developed a quasi model-free method of measuring directly. They fold into their shower development program a randomly generated exponential distribution of shower first interaction points, and then fit the entire distribution, and not just the trailing edge, as is done in the experiments of Ref. fly ; akeno ; yakutsk ; eastop . They obtain mb at GeV, a result which they claim is effectively model-independent and hence is an absolute determinationbelov .
Extraction of from . The total cross section is extracted from in two distinct steps. First, one calculates the -air total cross section, , from the measured inelastic production cross section using
| (2) |
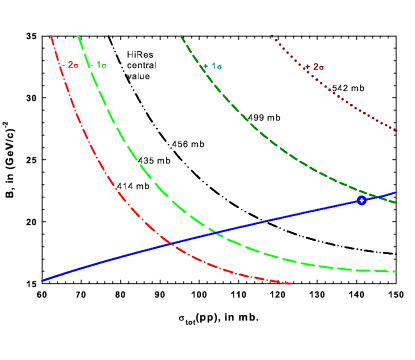
Next, the Glauber methodyodh is used to transform the measured value of into a proton–proton total cross section ; all the necessary steps are calculable in the theory. In Eq. (2) the measured cross section for particle production is supplemented with and , the elastic and quasi-elastic cross section, respectively, as calculated by the Glauber theory, to obtain the total cross section . The subsequent relation between and critically involves the nuclear slope parameter , the logarthmic slope of forward elastic scattering, , i.e.,
| (3) |
A plot of against , 5 curves of different values of , is shown in Fig. 1, taking into account inelastic screeningengelBsig . The reduction procedure from to is summarized in Ref. engel . The solid curve in Fig. 1 is a plot of vs. , which we will discuss in detail later.
Determination of . Block and Halzenbhfroissartnew have made an analytic amplitude fit that saturates the Froissart boundfroissart , to both the available high energy total cross section and -value data, where is defined as the ratio of the real to the imaginary portion of the forward scattering amplitude, for both and interactions. For their high energy expressions they used the analytic amplitude form
| (4) | |||||
| (5) | |||||
where the upper sign is for and the lower sign is for scattering, with , is the laboratory energy, is a dispersion relation subtraction constant, and the proton mass. The 7 real constants and are parameters of the fit. Since at high energies, , the square of the cms energy, is given by , we see that their cross section approaches at high energies, thus saturating the Froissart boundfroissart .
Using all of the cross sections, and , along with all of the -values, and , in the Particle Data Grouppdg archive that were in the laboratory energy interval GeV, i.e., GeV, Block and Halzenbhfroissartnew formed a sieved data set using the sieve algorithm of Ref. sieve to eliminate outliers, which markedly improved their fitbhfroissartnew . Using 4 analyticity constraintsblockanalyticity , i.e., by fixing both the cross sections and and their laboratory energy derivatives, at GeV, they reduced the number of parameters to be fit from 7 to 4 and obtained an excellent fit, which, in turn, constrained cross sections at cosmic ray energies to have a relative accuracy %. Their fits to and are shown in Fig. 2(a) and Fig. 2(b), respectively.
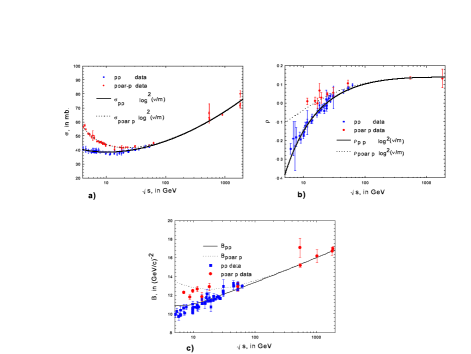
Determination of (s). A QCD-inspired parameterizationblockphysreports of forward and scattering amplitudes which is analytic, unitary and fits all data of , and for both and interactions has been made, using 2 analyticity constraints which fix and at GeV; see Fig. 2(c) for .
The solid curve in Fig. 1 is a plot of vs. , with taken from the QCD-inspired fit of Ref. blockphysreports and taken from the Froissart bound fit of Ref. bhfroissartnew . The large dot corresponds to the value of and at = 77 TeV, the HiRes energy, thus fixing the predicted value of at the HiRes energy.
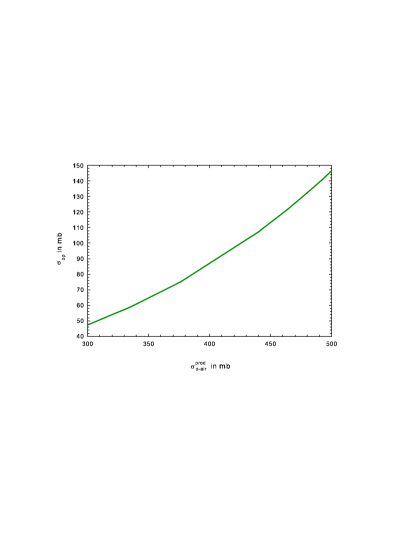
Obtaining from . In Fig. 3, we have plotted the values of vs. that are deduced from the intersections of the - curve with the curves in Fig. 1. Figure 3 furnishes cosmic ray experimenters with an easy method to convert their measured to , and vice versa. The percentage error in is % near mb, due to the error in from model parameter uncertainties.
Determining the value. It is important at this point to recall Eq. (1), , thus rewinding us of the fact that in Method I, the extraction of (or ) from the measurement of requires knowing the parameter . The measured depth at which a shower reaches maximum development in the atmosphere, which is the basis of the cross section measurement in Ref. fly , is a combined measure of the depth of the first interaction, which is determined by the inelastic cross section, and of the subsequent shower development, which has to be corrected for. The model dependent rate of shower development and its fluctuations are the origin of the deviation of from unity in Eq. (1). As seen in Table 1, its values range from 1.6 for a very old model where the inclusive cross section exhibited Feynman scaling, to 1.15 for modern models with large scaling violations.
Adopting the same strategy that earlier had been used by Block et al.blockhalzenstanev , we decided to match the data to our prediction of in order to extract a common value for . This neglects the possibility of a weak energy dependence of over the range measured, found to be very small in the simulations of Ref. pryke . By combining the results of Fig. 2 (a) and Fig. 3, we obtain our prediction of vs. , which is shown in Fig. 4. To determine , we leave it as a free parameter and make a fit to rescaled values of Fly’s Eye, fly AGASSAakeno , EAS-TOPeastop and Yakutskyakutsk , which are the experiments that need a common -value.
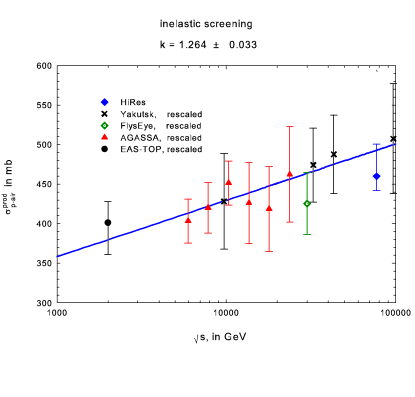
Figure 4 is a plot of vs. , the cms energy in GeV, for the two different types of experimental extraction, using Methods I and II described earlier. Plotted as published is the HiRes value at TeV, since it is an absolute measurement. We have rescaled in Fig. 4 the published values of for Fly’s Eyefly , AGASSAakeno , Yakutskyakutsk and EAS-TOPeastop , against our prediction of , using the common value of obtained from a fit, and it is the rescaled values that are plotted in Fig. 4. The error in of is the statistical error of the fit, whereas the error of is the systematic error due to the error in the prediction of . Clearly, we have an excellent fit, with complete agreement for all experimental points. Our analysis gave for 11 degrees of freedom (the low is likely due to overestimates of experimental errors). We note that our -value, , is about halfway between the values of CORSIKA-SIBYLL and CORSIKA-QSGSjet found in the Pryke simulationspryke , as seen in Table 1.
We next compare our measured parameter with a direct measurement of by the HiRes groupbelovkfactor . They measured the exponential slope of the tail of their distribution, and compared it to the p-air interaction length that they found. Using Eq. (1), they deduced that , in agreement with our value, giving us additional experimental confirmation of our method.
Conclusions. Our measured value, , agrees very well with the -value measured by the HiRes group, at the several parts per mil level, and in turn, they both agree with Monte Carlo model simulations at the 5–10 part per mil level.
It should be noted that the EASTOPeastop cms energy, 2 TeV, is essentially identical to the top energy of the Tevatron collider, where there is an experimental determination of comment , and consequently, no necessity for an extrapolation of collider cross sections. Since their value of is in excellent agreement with the predicted value of , this serves to anchor our fit at its low energy end. Correspondingly, at the high end of the cosmic ray spectrum, the absolute value of the HiRes experimental value of at 77 TeV—which requires no knowledge of the parameter—is also in good agreement with our prediction, anchoring the fit at the high end. Thus, our predictions, which span the enormous energy range, TeV, are completely consistent with all of the cosmic ray data, for both magnitude and energy dependence.
In the future, we look forward to the possibility of confirming our analysis with the high statistics of the Pierre Auger CollaborationAuger , as well as confirming the prediction of mb for the total cross sectionbhfroissartnew at the LHC energy of 14 TeV.
Acknowledgments. We would like to thank the Aspen Center for Physics for its hospitality during the writing of this manuscript.
References
- (1) R. M. Baltrusaitis et al., Phys. Rev. Lett. 52, 1380, 1984.
- (2) M. Honda et al., Phys. Rev. Lett. 70, 525, 1993.
- (3) S. P. Knurenko et al., Proc 27th ICRC (Salt Lake City), Vol. 1, 372, 2001.
- (4) M. Aglietta et al., Proc 25th ICRC (Durban) 6, 37, 1997; private communication, 2007.
- (5) M. M. Block and F. Halzen, Phys. Rev. D72, 036006, 2005.
- (6) M. M. Block, Nucl. Instrum. Methods A 556, 308, 2006.
- (7) M. M. Block, Eur. Phys J. C47, 697, 2006.
- (8) R. Engel et al., Phys. Rev. D58, 014019, 1998.
- (9) C. L. Pryke, Astropart. Phys.14, 319, 2001.
- (10) K. Belov for the Hires Collaboration, Nucl Phys. B (Proc. Suppl,) 151, 197, 2006.
- (11) T. K. Gaisser et al., Phys. Rev. D36, 1350, 1987.
- (12) R. Engel, private communication, Karlsruhe, 2005.
- (13) M. M. Block and F. Halzen, Phys. Rev. D72, 036006, 2005.
- (14) M. Froissart, Phys. Rev. 123, 1053, 1961.
- (15) Particle Data Group, K. Hagiwara S. Eidelman et al., Phys. Lett. B592, 1, 2004.
- (16) M. M. Block, Phys. Reports 436, 71, 2006.
- (17) M. M. Block et al, Phys. Rev. D62 77501, 2000.
- (18) K. Belov for the HiRes Collaboration, Aspen Workshop on Cosmic Ray Physics, April 15, 2007, http://cosmic-ray.physics.rutgers.edu/files/Belov-sigmapair.ppt .
- (19) At the cms energy TeV, the total cross sections and are expected to differ by mb, and thus, for the purpose of predicting , are the same—see Ref. blockphysreports .
- (20) The Pierre Auger Project Design Report, Fermilab report (Feb. 1997).