The Dust and Gas Around Pictoris
Abstract
We have obtained Spitzer IRS 5.5–35 m spectroscopy of the debris disk around Pictoris. In addition to the 10 silicate emission feature originally observed from the ground, we also detect the crystalline silicate emission bands at 28 and 33.5. This is the first time that the silicate bands at wavelengths longer than 10 have ever been seen in the Pictoris disk. The observed dust emission is well reproduced by a dust model consisting of fluffy cometary and crystalline olivine aggregates. We searched for line emission from molecular hydrogen and atomic [S I], Fe II, and Si II gas but detected none. We place a 3 upper limit of 17 on the H2 S(1) gas mass, assuming an excitation temperature of = 100. This suggests that there is less gas in this system than is required to form the envelope of Jupiter. We hypothesize that some of the atomic Na I gas observed in Keplerian rotation around Pictoris may be produced by photon-stimulated desorption from circumstellar dust grains.
Subject headings:
circumstellar matter— planetary systems: formation— planetary systems: protoplanetary disks— stars: individual ( Pictoris)1. Introduction
The A5V star Pictoris (HD 39060 = HR 2020) at a distance possesses a spectacular edge-on debris disk imaged in scattered light and thermal emission that extends to radii 1400 (Smith & Terrile, 1984; Holland et al., 1998; Golimowski et al., 2006). An age of 12 Myr has been estimated for for the central star based on the properties of late-type members of the Pic moving group (Zuckerman et al., 2001). The dust in this system is believed to be replenished from a reservoir, such as collisions between parent bodies or sublimation of comets because the estimated lifetime for the dust under radiation pressure, Poynting-Robertson drag, and grain-grain collisions is a few orders of magnitude shorter than the age of the system (Backman & Paresce, 1993). There may be evidence for the presence of large bodies in the Pictoris disk that perturb dust grains and parent bodies and instigate collisional cascades between them. A 5 warp at radii 80 AU has been observed in scattered light using STIS on HST and may be generated by either a brown dwarf close to the star (at distances 3 AU) or a 0.17 planet at larger distances from the star (50) (Heap et al., 2000). The Pictoris disk may also possess infalling, sublimating, refractory bodies. Time-variable, high velocity, non-periodic, red-shifted atomic absorption features have been observed toward Pictoris at ultraviolet (UV) and visual wavelengths that vary on timescales as short as hours. The velocity of the atoms, typically 100–400, is close to the free fall velocity at a few stellar radii, suggesting that the absorption is produced as stellar photons pass through the comae of infalling bodies at distances 6 from the star (Vidal-Madjar et al., 1998).
The origin of the micron-sized dust grains required to account for the observed scattered light and thermal emission is currently not well-constrained. The broad 9.7 silicate emission feature and the narrow 11.3 crystalline olivine emission feature observed toward Pictoris appear grossly similar to those observed toward comets Halley, Bradford 1987s, and Levy 1990 XX (Knacke et al., 1993), suggesting that the grains may be cometary. Models of cometary grains, idealized as fluffy aggregates of interstellar silicate cores with carbonaceous organic refractory mantles (and additional ice mantles at distances larger than the snow-line), in radiative equilibrium with the central star are able to reproduce the observed 10 silicate feature and the spectral energy distribution (SED) at IR through millimeter wavelengths (Li & Greenberg, 1998). Spatially-resolved studies of the silicate emission feature, obtained using COMICS on the Subaru Telescope, suggest that the shape of the 10 feature changes as a function of position in the disk, with large and crystalline grains concentrated at the center and small grains located in ring-like bands at 6.4, 16, and 29 from the central star (Okamoto et al., 2004). The rings of small grains may be explained by collisions between large orbiting bodies. High-resolution, mid-IR imaging of Pictoris, obtained with TReCs on the Gemini South Telescope, has resolved a prominent clump on the south-west side of the disk at 52 from the central star which may also indicate that a recent collision has occured in the Pictoris disk (Telesco et al., 2005).
Spatially resolved visual spectroscopy of Pictoris has revealed a disk of atomic gas in Keplerian rotation, observed via scattered emission from Fe I, Na I, Ca II, Ni I, Ni II, Ti I, Ti II, Cr I, and Cr II. The atomic gas possesses a NE/SW brightness asymmetry and an inner warp similar to that observed in the dust disk although the gas extends to larger heights than the dust (Brandeker et al., 2004). Estimates of the radiation pressure acting on Fe and Na atoms suggest that these species should be not be in Keplerian rotation but should be accelerated to terminal outflow velocities 100s–1000s km/sec (Brandeker et al., 2004). Lagrange et al. (1998) showed that a ring of neutral hydrogen at distance 0.5 AU could slow down the radial flow of gas. However, Fernandez et al. (2006) have recently proposed that the gas will not be radially accelerated if the carbon is overabundant; their model does not require a population of undetected atomic hydrogen. Since carbon does not experience strong radiation pressure ( = 0) and also has a large ionization fraction (0.5), they suggest that Coulomb interactions between C II and other ions reduce the effective radiation pressure on the bulk gas. In this case, the ions and neutral atoms in the disk couple together into a fluid, with an effective radiation pressure coefficient, that is bound to the system and that brakes the gas if 0.5. In particular, they suggest that if the carbon abundance is 10 solar, then all the atomic gas will be retained. Measurements of the column density of the stable component of atomic carbon (with zero velocity relative to the star) via absorption from C I (3P) 1613 (Roberge et al., 2000) and absorption from C II1036 and C II∗ 1037 superimposed on chromospheric O VI 1038, suggest that the bulk of the atomic gas is composed of carbon with a C/Fe abundance ratio that is 16 times the solar value and an ionization fraction of 0.5 (Roberge et al., 2006).
We report the results of a Spitzer IRS study of the dust and gas around Pictoris, building on the model for the composition and spatial distribution of the grains by Li & Greenberg (1998) and placing 3 upper limits on the line emission from H2 S(2), S(1), S(0) and [S I], Fe II, and Si II gas. Based upon the similarity in the spatial distribution of the dust and gas observed in scattered light, we hypothesize that the dust and gas in this system are physically associated and that the observed gas is secondary; it has been produced from circumstellar material since the star formed. We quantitatively show that the observed Na I, seen in Keplerian rotation around the star, can be produced via photon-stimulated desorption in a time that is shorter than the residence time of the gas in the disk.
2. Observations
We obtained IR Spectrograph (IRS) (Houck et al., 2004) spectral mapping mode observations of Pictoris using the Short-Low (SL; 5.2–14 ; ), Short-High (SH; 9.9–19.6 ; ), and Long-High (LH; 18.7–37.2 ; ) modules on the Spitzer Space Telescope (Werner et al., 2004). The SL2 slit has a size 3.657; the SL1 slit has a size 3.757; the SH slit has a size 4.711.3; the LH slit has a size 11.122.3. Both the low and high resolution observations were made with the spectrograph long slits aligned along the position angle of Pictoris disk to within 5.
The SL2 (AOR key: 8972288) and SL1 (AOR key: 8972544) spectra were obtained on 16 November 2004 by stepping the slit in 7 and 11 1.8 intervals perpendicular to the disk, respectively, with the center position centered on the disk. Each SL2 and SL1 map position was observed using 9 and 14 cycles, respectively, of 6 second ramps. The SH (AOR key: 4879616) and LH (AOR key: 4876800) spectra were obtained on 15 December 2003 and 4 March 2004, respectively, by stepping the slit in 3 2.4 and 4.8 intervals perpendicular to the disk, respectively, with the center position centered on the disk. Each SH and LH map position was observed using 25 and 24 cycles, respectively, of 30 and 14 second ramps. High accuracy peak-up, with the blue (13.3–18.7) array, on the nearby star HD 38891 (located 12 north of Pictoris), was used to center the disk in the SL2, SL1, and SH slits; high accuracy peak-up, with the red array (18.5–26), on HD 38891 was used to center the disk in the LH slit.
The raw data were processed into calibrated (flat-fielded, stray light corrected) 2-dimensional spectra with version S11.0.2 of the SSC pipeline. We removed masked and rogue pixels from the basic calibrated data by interpolating between their nearest neighbors, coadded the resulting images, and extracted 1-dimensional spectra using the IRS team’s SMART program (Higdon et al., 2004). Since separate nod observations of the sky were not made when Pictoris was observed, we approximated the SL sky background as a constant at each wavelength and subtracted this value from each pixel in the spatial direction across the source. Since the SL slits are long enough to sample the PSF in the spatial direction, we fit 1-dimensional Gaussians to the SL spectra in the spatial direction to determine the positions of the source in the slits. We extracted our low resolution spectra by summing over a window whose width varied as a function of wavelength to account for the changing size of the point spread function and was centered on the source position. Finally, we multiplied the resulting spectra with an Lac relative spectral response function (RSRF), obtained by dividing an Lac template spectrum with an observed Lac SL spectrum (Jura et al., 2004). Since point sources fill the high resolution slits, we extracted our high resolution spectra (without background subtraction) by summing over all of the pixels in the SH and LH slits. The extracted high resolution spectra were multiplied by a Dra high resolution RSRF.
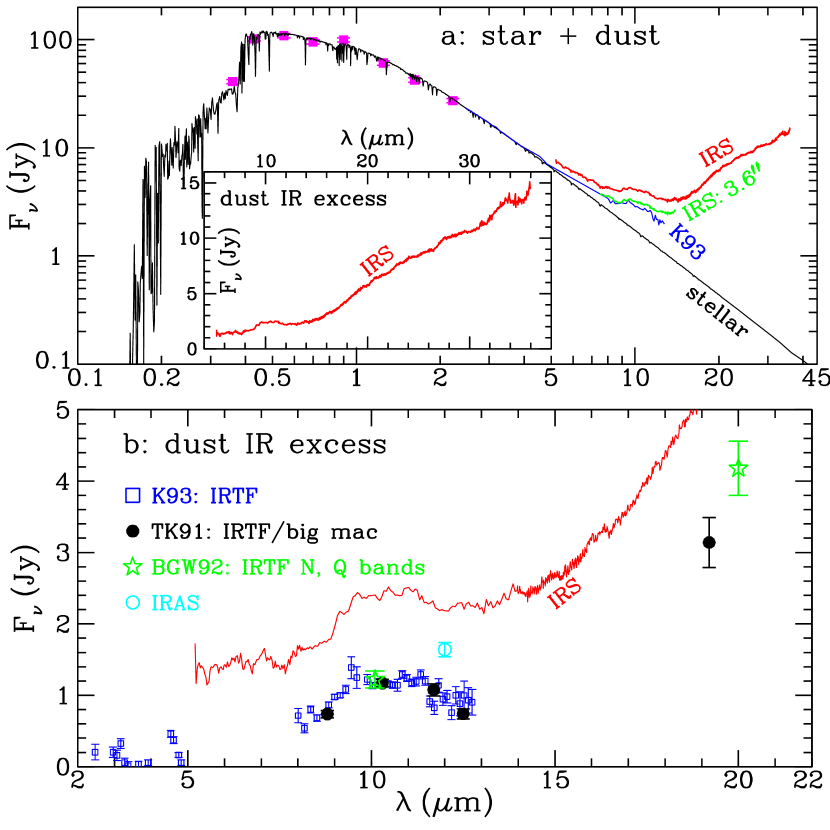
We constructed a spectrum that is consistent with the LH slit, the largest slit we used to observe Pictoris, centered on the disk. Since the source is extended in our IRS observations, we added multiple SL measurements together to construct an aperture equal to the LH aperture. Since our SH map was not large enough to cover the LH central slit position, we scaled our SH spectrum by a factor of 1.068 to match the SL and LH spectra, using the LL spectrum at 5.1939 m to 9.9232 m, the SH spectrum at 9.9461 m to 19.3179 m, and the LH spectrum at 19.2636 m to 35.9892 m. The final spectrum of Pic (shown in Figure 1) is that of a 1122 region centered on the star and oriented along the disk.
The signal:noise in our spectrum is very high. Over spans of many spectral resolution elements, the sensitivity of our spectrum is limited by flat-fielding errors to 1-2% of the continuum flux density. Over smaller spans, 10 spectral resolution elements or so, the sensitivity is limited only by photon noise from the background and target, and is significantly better: 0.1-0.5% of the continuum flux density in SH and LH, and 0.05-0.2% in SL, consistent with the point-to-point scatter in the spectrum over such small spans, and (perforce) consistent with the Spitzer-IRS facility sensitivity tool, SPEC-PET. Thus, every spectral feature visible in our Pic spectrum that is at least as wide as the spectral resolution is real, and the upper limits on weaker spectral lines are significantly smaller than 1% of the continuum. For simplicity we have calculated such upper limits directly from the point-to-point variation of the continuum-subtracted spectrum.
3. Dust Properties
Figure 1 plots the 5.2–36 IRS spectrum and the PHOENIX model stellar atmospheric spectrum with effective temperature and surface gravity log = 4.2. Figure 1 clearly shows that the dust excess emission above the stellar atmospheric radiation is even seen at wavelengths as short as 5–8, indicating that there may exist a population of hot dust ( 400–600) at a distance of 10 from the central star [see Figure 1 of Li & Greenberg (1998)].
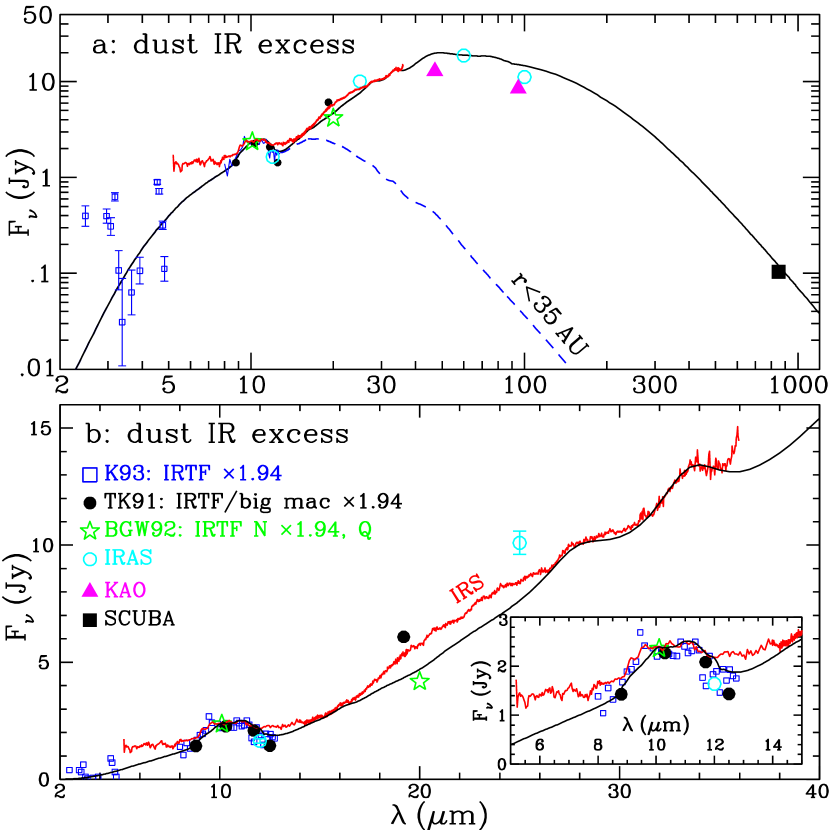
Mostly prominent in Figure 1 are the broad 10 feature (which reveals the presence of both amorphous silicates and crystalline silicates in the Pictoris disk), and the 28 and 33.5 crystalline olivine emission features (see the inset in Figure 1a) which closely resemble the Li & Greenberg (1998) model spectrum (see their Figure 6c).111Crystalline pyroxene MgxFe(1-x)SiO3 grains also have a rich set of features in the mid-IR. But their peak wavelengths and relative feature strengths are inconsistent with the IRS spectrum (e.g. see Chihara et al. 2001). Olivine Mg2xFe2(1-x)SiO4 is a mixture of forsterite Mg2SiO4 and fayalite Fe2SiO4 with a mixing proportion . In this work as well as in Li & Greenberg (1998) we adopt the refractive indices of Mg1.8Fe0.2SiO4 (Mukai & Koike 1990). Although in principle it is possible to infer the Mg:Fe ratio from the locations and strengths of the IR features (e.g. see Koike et al. 1993, 2003, Fabian et al. 2001), neither the IRS spectrum reported here reveals a large number of crystalline silicate features nor does it cover a sufficiently broad wavelength range for constraining the exact crystal composition. As shown in Figure 2, the dust model consisting of crystalline Mg1.8Fe0.2SiO4 olivine reproduces the IR features reasonably well. This is the first time that the silicate bands at wavelengths longer than 10 have ever been detected in the Pictoris disk.
For comparison, we also show in Figure 1 the IRAS broadband photometry of Gillett (1986), the photometry of Telesco & Knacke (1991) at 8.8, 10.3, 11.7 and 12.5 obtained using the Big Mac spectral filters at the NASA Infrared Telescope Facility (IRTF), the IRTF band (10.1) and band (20) photometry of Backman et al. (1992), the IRTF 2.6–13.5 intermediate resolution () spectrometry of Knacke et al. (1993), and the Kuiper Airborne Observatory (KAO) 47 and 95 photometry of Harvey et al. (1998). While the photometry of Telesco & Knacke (1991) and the IRTF band photometry of Backman et al. (1992) agree with the spectrometry of Knacke et al. (1993) very well, they are below the IRS spectrum by a factor of 1.94 (see Figure 1b and Figure 2b). This difference is much larger than the calibration uncertainty of IRS and is attributed to the fact that the Spitzer apertures ( for SL, for SH, for LH) are much larger than the apertures of ground-based observations [e.g. diameter of Knacke et al. (1993), of Telesco & Knacke (1991), diameter of Backman et al. (1992)], and therefore Spitzer detects more flux from extended material than in previous observations.222Indeed, as shown in Figure 1a, the SL point-source-extracted spectrum centered on the star (with a beam diameter of 3.6′′, approximately the same as Knacke et al. (1993)’s spectroscopic observation) is close to that of Knacke et al. (1993).
The nature (e.g. size, composition, and morphology) of the dust and its spatial distribution in protoplanetary and debris disks is mostly revealed through the interaction of the dust with the electromagnetic radiation of the central star: absorbing, scattering and polarizing the stellar radiation and re-radiating the absorbed UV/visible photons at longer wavelengths, ranging from the IR to submillimeter and millimeter. Since the disk around Pictoris subtends more than 100, it has been studied in great detail. There exists a vast variety of observational data for the dust in this disk (see Mann et al. (2006)), including (1) imaging observations of scattered light (Smith & Terrile, 1984; Paresce & Burrows, 1987; Golimowski et al., 1993; Lecavelier des Etangs et al., 1993; Kalas & Jewitt, 1995; Mouillet et al., 1997; Heap et al., 2000; Kalas et al., 2000; Golimowski et al., 2006); (2) imaging observations of dust thermal emission in the mid-IR (Lagage & Pantin, 1994; Pantin et al., 1997; Heinrichsen et al., 1999; Wahhaj et al., 2003; Telesco et al., 2005) and submillimeter (Holland et al., 1998); (3) mid-R narrow band photometry (Telesco & Knacke, 1991), as well as broadband photometry in the mid-IR (Gillett, 1986; Backman et al., 1992) and millimeter (Chini et al., 1991; Liseau et al., 2003); (4) optical (Gledhill et al., 1991; Wolstencroft et al., 1995) and near-IR (Tamura et al., 2006) imaging of polarized light; and (5) mid-IR spectroscopy (Aitken et al., 1993; Knacke et al., 1993; Weinberger et al., 2003; Okamoto et al., 2004).
To accurately describe the dust grains in the Pictoris disk, all of the aforementioned observational data must be modeled simultaneously. While recognizing the importance of a comprehensive, simultaneous modeling of all of the Pictoris observations, in this paper we present a simple model focusing on our Spitzer IRS spectrum. We defer the comprehensive modeling of the dust around Pictoris that attempts to simultaneously fit all of the observed data to a separate paper (A. Li et al. 2007, in preparation).
We model the Spitzer IRS spectrum of Pictoris building on the work of Li & Greenberg (1998) which includes (1) a population of cometary dust, composed of low-density porous aggregates of amorphous silicate core-carbonaceous mantle grains,333The mass ratio of the silicate core to the carbon mantle is assumed to be based on the cosmic abundance consideration (see Appendix A of Li & Lunine 2003). and (2) a population of crystalline olivine aggregates with the same size and spatial distributions as the amorphous cometary grains (but actually we do not require crystalline dust outside 60 from the star since at distances 60 from the star silicate grains are too cold to emit at the characteristic mid-IR bands).
For the amorphous cometary and crystalline olivine fluffy aggregates, we assume a vacuum volume fraction = 0.90 (see §2 of Li, Lunine, & Bendo 2003 for justification) and approximate the porous grains as spheres with radii . We assume a power-law dust size distribution , with a minimum grain radius , and a maximum grain radius (see Li, Lunine, & Bendo 2003 for justification).
Similar to Artymowicz & Clampin (1997), we assume a modified power-law spatial distribution for the dust, . This functional form, peaking at , behaves like a power-law at large distances (). At , the term dominates, approximating an increasing profile in the inner, dust-relatively-depleted region. We take and as derived from scattered light modeling (Artymowicz et al., 1989). The inner boundary of the disk is taken to be the location inside which silicate dust sublimates. For the Pictoris disk, micron-sized silicate grains possess an equilibrium temperature at ; therefore, we take . We take = 2000.
In modeling the dust IR emission, we – with all other parameters (i.e. , , , ) pre-chosen – are therefore left with only 2 free parameters: – the dust size distribution power-index, and which determines the amount of dust in the inner disk region [we note that Artymowicz & Clampin (1997) took = 1]. It is found that, with and , we are able to obtain a reasonably good fit to the overall SED and the Spitzer IRS spectrum including the silicate emission features at 10, 28 and 33.5 (see Figure 2).444The amount of dust in the inner disk () is inverse proportional to . With = 0.15 and = 2.7, the dust spatial distribution peaks at . At a first glance, this appears inconsistent with the scattered light images which suggest a dust spatial distribution slope change at 80–120 AU (e.g. see Golimowski et al. (1993, 2006)). However, the dust spatial distribution from 46 AU () to is rather flat: only changes by a factor of 2.3 from to , while it drops much more steeply from to 2 (by a factor of 5.8). In a subsequent paper (A. Li et al. 2007, in preparation), we will investigate in detail whether the present dust spatial distribution is able to reproduce the scattered light images. The required dust masses are approximately and for the amorphous and crystalline components, respectively.
As shown in Figure 2b, the model is somewhat deficient at 5–8 and 17–24. This is due to the oversimplified dust spatial distribution function adopted above. By including 2 rings or clumps of dust at and at 20–30 as implied by Telesco et al. (2005) and Okamoto et al. (2004), it is expected that the model will account for the excess emission at 5–8 and 17–24 (see A. Li et al. 2007, in preparation). The oversimplification of the assumed dust spatial distribution is also reflected by the model-predicted IR emission from the dust within a 3.6′′ diameter (corresponding to 35; see Figure 2a): the model-predicted emission from the inner 35 region accounts for almost all the observed 15 emission for the entire disk. Although this is consistent with the previous spatially resolved mid-IR spectroscopy which show that 10 silicate emission originates from the inner 20 (Weinberger et al., 2003; Okamoto et al., 2004), it appears to contradict the IRS detection of an appreciable amount of silicate emission from the outer 35 (see Figure 1a). This will be investigated in detail in a subsequent paper (see A. Li et al. 2007, in preparation).
4. Gas Mass Upper Limits
Core-accretion models suggest that giant planets accrete their gaseous envelopes on timescales between 1 and 20 Myr. Therefore the Pictoris disk, with an age of 12 Myr, is an excellent source to search for bulk gas. If the gas has a solar composition, then the bulk gas is expected to be hydrogen. ISO observations indicated line emission from H2 S(0) at 28.2 and S(1) at 17.0, suggesting that the disk possesses 54 warm H2 with an excitation temperature = 110 (Thi et al., 2001). However, apparently conflicting FUSE observations constrain the circumstellar H2 Lyman series absorption and place a 3 upper limit of on the H2 column density, significantly lower than (5–500) expected if the ISO-detected H2 were uniformly distributed in an edge-on disk in the beam (Lecavelier des Etangs et al., 2001), an assumed geometry that is consistent with observations of the atomic gas. Detailed studies of gas drag on the dust dynamics suggest that the gas:dust ratio is less than 1 (or 0.4 molecular hydrogen exists in the disk). For example, if the disk possessed 40 M⊕ gas, then small grains would collect at distances 200 AU and would increase the scattered light surface brightness by more than a factor of 10 (Thébault & Augereau, 2005). Searches for H I 21 cm emission constrain the mass of atomic hydrogen (Freudling et al., 1995); recent chemical models constrain the total mass of hydrogen 15 M⊕ including the molecular component based on these observations (Kamp et al., 2007).
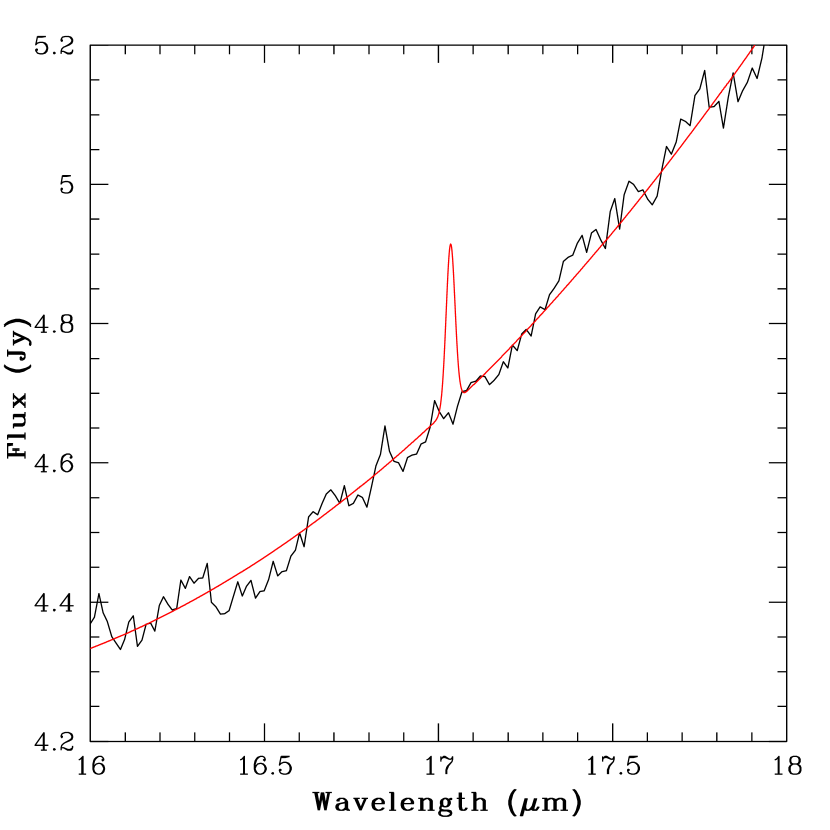
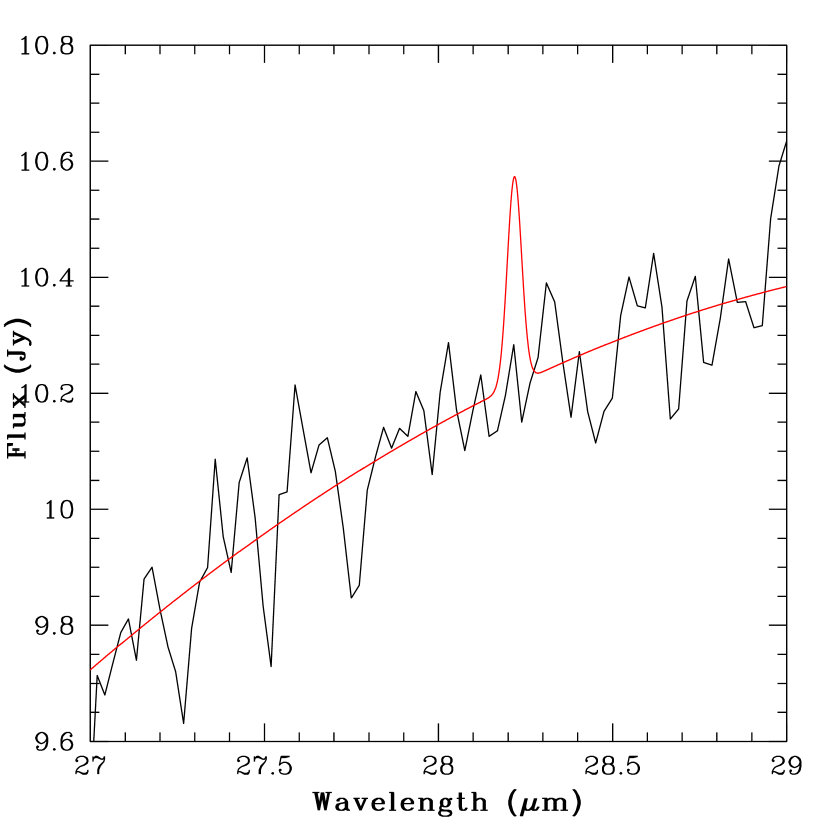
We searched for emission from H2 S(2), S(1), S(0) and [S I], Fe II, and Si II but did not detect any of these species. We place 3 upper limits on their line fluxes toward Pictoris (see Table 1). Our 3 upper limit on the H2 S(1) line flux is 1.2, a factor of 6.4 times lower than the reported ISO detection (see Figure 3). Although the Spitzer IRS SH slit is a factor of two shorter than the ISO SWS slit (1427), our upper limits effectively constrain the H2 line emission because the warm, bulk H2 is expected to be located at radii 100 (6).
Converting 3 upper limits on the line fluxes from any species into gas masses depends sensitively on the assumed gas temperature. Detailed models of the heating and cooling of molecular and atomic gas via gas-grain collisions, cosmic rays, line emission, etc. have been used to infer the temperature and chemical structure of the Pictoris disk. However, these models depend on the initial gas:dust ratio or gas mass assumed. For example, a 2 disk (with an interstellar gas:dust ratio of 100) heated primarily by gas-grain collisions may possess gas as warm as 100–150 at intermediate heights at distances of 300–500 where [O I] fine structure emission at 63.2 is the dominant coolant; while, a 0.2 disk may possess gas as warm as 300 at lower heights and similar radii in the disk where [O I] and H2 rotational/vibrational emission are the dominant coolants (Kamp & van Zadelhoff, 2001). Estimates of the total gass mass, inferred from the measured column densities of atomic species and the scattered light gas density profile of Na I, suggest that the Pictoris disk contains 7.410-4 measured gas, corresponding to a gas:dust ratio 0.019, significantly less than assumed in many detailed chemical models. Even if the gas has a solar hydrogen abundance relative to the heavy elements, then the disk possesses 3.710-3 gas, corresponding to a gas:dust ratio 0.093 (A. Roberge, private communication), still significantly less than the gas:dust ratios of 100 or 10 assumed in these models.
To estimate an upper limit on the mass of H2 based on our S(1) line flux upper limit, we must assume a gas excitation temperature. Gas temperatures can be inferred from (1) detailed models of gas in thermal balance that calculate the composition and density structure of disks in addition to the temperature structure (as described above) or (2) observations if multiple electronic transitions are observed. Far-UV observations of Pictoris have constrained the bulk circumstellar gas temperature. Analysis of the C I (3P) 1613 and 1561 multiplets suggest that the excitation temperature of the stable C I component, = 50–100 (Roberge et al., 2000). Since bulk hydrogen with a gas:dust ratio of 100 has not been directly detected (as assumed for the Kamp & van Zadelhoff models), we rely on the measured C I excitation temperature to act as a guide for the bulk gas kinetic temperature = 50–100. Therefore, we place 3 upper limits on the mass in each of the listed species assuming gas temperatures = 50 and 100 (see Table 1). The total flux produced by atoms or molecules
| (1) |
where is the distance to the star, is the energy of the radiated photons, is the fraction of atoms or molecules in level , and is the transition probability. Since the temperature of any H2 is uncertain, we plot the 3 upper limits on the H2 mass obtained from our S(1) and S(0) line fluxes as a function of temperature (see Figure 4). If = 100 K, we estimate that 17 H2 hydrogen remains in the disk from our H2 S(1) upper limit.
The nondetection of H2, [S I], Fe II, and Si II emission toward Pictoris is consistent with Spitzer observations of other 10–30 Myr old disks. ISO observations of the 20 Myr old dusty A1V star 49 Ceti have indicated line emission from H2 S(0) at 28.2, suggesting that the 49 Cet disk possesses 110 warm H2 with an excitation temperature (Thi et al., 2001). However, high resolution Spitzer IRS observations place 3 upper limits on the H2 S(0) line flux that are a factor 9 lower than the reported detection (Chen et al., 2006). A recent Spitzer IRS search for H2 emission from warm gas and millimeter search for 12CO from cool gas around 8 sun-like systems with ages 30 Myr measured upper limits 0.04 gas within a few AU of the disk inner radius (1–40 AU) and 0.04 gas at 10–40 AU (Pascucci et al., 2006). Spitzer IRS observations place 5 upper limits on the line flux from H2 S(1) and S(0) toward HD 105, a G0V member of the Tucana-Horolgium association at 40 from the Sun, suggesting that less than 1500, 12, and 0.95, respectively, at = 50, 100, or 200 remains in this disk at an age of 30 Myr (Hollenbach et al., 2005). Together, these observations suggest that warm molecular hydrogen, with = 100 K, dissipates from circumstellar disks on timescales 10 Myr.
5. The Origin of the Atomic Gas
The origin of the observed stable atomic gas in Keplerian rotation around Pictoris (described in the Introduction), like the micron-sized dust grains, is currently not well-constrained. There have been suggestions in the literature that the stable gas component is produced by infalling refractory bodies (Beust & Valiron, 2007) or by collisions between dust grains (Czechowski & Mann, 2007; Fernandez et al., 2006). We consider these possibilities and hypothesize that some of the observed atomic sodium is generated by photon-stimulated desorption from SiO2-like surfaces.
Infalling refractory bodies undoubtably contribute at least some portion of the observed gas but whether all of the gas is generated by the evaporation of parent bodies is uncertain. The spatial distribution of the gas may provide a clue to its origin. The atomic gas is detected to distances of 150–200 on the southwest side and distances of 300–350 on the northeast side of the disk. These distances correspond to the inner regions of the dusty disk that has been detected in thermal emission and scattered light to distances 1400 AU. The SW/NE dust brightness asymmetry observed in scattered light is also seen in the resonantly scattered gas emission lines; however, the asymmetry in the Na I emission is more pronounced. Finally, the gas and dust populations share an inner disk that is tilted 5 with respect to the outer disk (Brandeker et al., 2004). If infalling refractory bodies produce all of the observed gas, why are the spatial distributions of the gas and dust so similar?
To explain the similarity in the spatial distributions of the dust and gas around Pictoris, Czechowski & Mann (2007) recently proposed that the atomic gas is produced via collisions between dust grains that vaporize at least some portion of the dust. Vaporization of dust grains in energetic collisions is believed to produce atomic gas in supernovae shocks and may generate a non-trivial fraction of the gas observed in the exospheres of Mercury and the moon (Killen et al., 2001). In the Czechowski & Mann (2007) model, radiation pressure accelerates sub-blowout sized grains ( meteoroids) to large radial velocities; these small particles then collide with bound, orbiting grains with relative velocities as high as 90 km/sec (for carbonaceous grains). The observed abundances of the Pictoris dust and atomic gas may provide a clue to the origin of the stable atomic gas. If the gas is liberated in vaporizing collisions and no atomic species are selectively removed (e.g. via outgassing or differentiation), then the gas composition should be the same as the grain composition. Our models for the dust grains around Pictoris reproduce the Spitzer IRS spectrum assuming a carbon relative to silicon abundance ratio of 8.9, significantly smaller than the measured ratio of the column densities of atomic carbon and silicon gas, 500 (Roberge et al., 2006).
Photon-stimulated desorption (PSD) may produce a substantial fraction of the sodium observed in the tenuous exospheres of Mercury and the Moon (Leblanc et al., 2006; Lammer et al., 2003; Yakshinskiy & Madey, 1999) and may produce some of the spatially-extended sodium gas observed via resonant scattering toward Pictoris. Since PSD produces gas directly from the dust, it might naturally explain the similarity in the gas and dust density distributions. The cross-section for PSD jumps dramatically at UV wavelengths, becoming most efficient at (Yakshinskiy & Madey, 1999). Pictoris has been observed extensively in the far and near ultra violet using FUSE (Lecavelier des Etangs et al., 2001; Roberge et al., 2006), HST GHRS and STIS (Roberge et al., 2000), with a continuum flux at measured by IUE, (Lanz et al., 1995). Fernandez et al. (2006) model the observed stellar ultra violet spectrum of Pic using a rotationally broadened ( = 1304 km sec-1) PHOENIX model with effective temperature , and surface gravity, log = 4.2, suggesting a stellar UV photon production rate, = 2.01044 s-1.
The efficiency with which photons desorb sodium, averaged over the surface of a sphere, is
| (2) |
(Yakshinskiy & Madey, 1999) where is the photon-stimulated desorption cross section and is the atomic surface coverage. Laboratory experiments measure (31) 10-20 cm2 for lunar samples with temperatures of 250 K and using incident photons with 2500 Å, suggesting an efficiency of = 2.3 10-8 for materials with a lunar temperatures and compositions, = 3 1012 cm-2 (Yakshinskiy & Madey, 1999). In addition, the photon-stimulated desoprtion efficiency of sodium is also function of substrate temperature, . We estimate
| (3) |
from measurements of sodium desorption yields in the laboratory (Yakshinskiy & Madey, 2004), normalized to the sodium desorption efficiency at the moon as discussed above.
The rate at which atomic sodium is produced in the Pictoris disk is
| (4) |
where and are the minimum and maximum radii, and and are the minimum and maximum heights at which the atomic sodium gas is observed. Since the Na I gas in the Pic disk is located at distances of up 350 AU, well beyond our IRS slit, we use a dust density distribution inferred based on observations of the disk on large scales (rather than the dust density profile that we derive in Section 3). Artymowicz (private communication) has inferred the quantity , summed over all grain sizes, from HST STIS observations (Heap et al., 2000) assuming a grain albedo 0.5:
| (5) |
where = 120 AU, = 6.6 , and = 2. We assume that the bulk of the surface area is contained in 1 m amorphous olivine grains and estimate the grain temperature as a function of distance using Mie theory (the grains are spherical) and using laboratory-measured indices of refraction (Dorschner et al., 1995). If and , we estimate a sodium production rate from the grains via photon-stimulated desorption. We do not use the same dust spatial distribution as adopted in §3 for modeling the IR emission because the desorption properties of porous aggregates invoked in §3 are poorly known, while the desorption properties of compact grains (assumed in eq.[4])are better quantified (e.g. experimental data are available). Moreover, the dust spatial distribution adopted in §3 is already oversimplified.
We estimate the number of sodium atoms in the Pictoris disk from observations of resonantly scattered Na I and infer the time required to produce the circumstellar sodium. Since the ionization potential of sodium is 5.1 eV and Pic possesses a high UV luminosity, the majority of the circumstellar sodium is expected to be ionized. Fernandez et al. (2006) have written a photoionization code that calculates the densities of neutral and ionized elements from H to Ni, assuming that the Pic disk is optically thin and has a solar composition; they estimate a sodium neutral fraction of 310-4 at the disk midplane at 100 from the central star. Since the sodium neutral fraction is a function of distance from the stellar ionizing source, we have written a simple photoionization code which calculates the densities of neutral and ionized carbon and sodium in the disk as a function of position assuming that (1) the gas is optically thin, (2) the disk gas contains only carbon and sodium, (3) ionization of carbon produces the electron density in the disk, (4) the gas temperature, = , and (5) the circumstellar Na I possesses a density distribution
| (6) |
(Brandeker et al., 2004) where , , , , and . We use published carbon and sodium photoionization cross sections (Verner et al., 1996) and radiative recombination coefficients (Verner & Ferland, 1996; Nahar, 1995) to estimate the carbon and sodium densities assuming that the atoms are in ionization equilibrium at each point in the disk. If the gas has a solar carbon:sodium abundance ratio, then the Pictoris disk possesses 4.61044 sodium atoms and a time of 13000 years is required to produce the sodium gas. Models of the breaking of atomic gas in the Pic disk suggest that the lifetime of an atom in the disk is 104 to 105 years (Fernandez et al., 2006), suggesting that the sodium gas is in a steady state if it is produced by PSD and braked by Coulomb interactions.
We can estimate the radial dependence of the sodium number density and compare it to that inferred from resonantly scattered sodium observations (Brandeker et al., 2004). If atomic sodium produced in the disk does not migrate radially, then sodium gas generated by photon-stimulated desorption will have a number density distribution
| (7) |
where is the distance to the central star and is the surface area contained in the dust grains. The predicted PSD-produced sodium density distribution at the disk midplane falls too quickly as a function of radius compared to that inferred from observations (see Figure 5). The rapid fall off in predicted sodium density is the result of the 1/ dilution of stellar photons. The sodium desorption efficiency is able to partially overcome this effect because if the grains are 1 m olivine spheres. However, even taking into account the temperature dependence of the desorption efficiency, our predicted sodium number density falls off too quickly with radius by a factor of . If PSD produces the bulk of the observed sodium, sodium atoms must migrate to larger distances via radiation pressure.
Our model for the origin of circumstellar sodium could be extended to other atomic species in the Pictoris disk. At the current time, few laboratory measurements have been made for the photon-stimulated desorption rates of other atoms. Potassium is the only species, other than sodium, for which PSD rates have been measured. Madey et al. (1998) measure cross sections for postassium desorption from Cr2O3 surfaces, = 2 10-20 cm2 at 2500 - 3500 Å and 2 10-19 cm2 at 1900 Å. If photon-stimulated desorption of potassium has the same temperature dependence as observed for sodium and the Pic circumstellar grains have a solar potassium to sodium abundance ratio, = 2.1 1011 cm-2, then we estimate a potassium production rate in the Pic disk of 3.3 1032 K atoms s-1, 3000 times less than the sodium production rate. Atomic potassium has not yet been detected in the Pictoris disk and 3 upper limits on the circumstellar potassium mass have not yet been reported in the literature.
6. Discussion
The simple dust model presented in §3, consisting of cometary grains with a power-law size distribution and a modified power-law spatial distribution, provides a reasonably good fit to the overall SED and the observed Spitzer IRS spectrum. At a first glance, the model has many free parameters: (1) , and for the dust size distribution ; and (2) , , , , for the dust spatial distribution . With general constraints from the disk structure and the dust absorption and emission properties, we actually have only 2 free parameters and left (see §3 for details). In so doing, 2 assumptions have been made: (1) all grains have the same spatial distribution; and (2) the grains producing the IRS emission spectrum are also responsible for the optical scattered light or their spatial distribution follows that of the dust responsible for the optical scattered light. Admittedly, the former assumption is oversimplified since the response of the grains to the stellar radiation pressure and Poynting-Robertson drag varies with grain size and therefore the simple radial power law is probably not all that representative of the actual grain distribution uniformly with size. To justify the latter assumption, a simultaneous modeling of both the scattered light and IR emission is required. Nevertheless, the general conclusion for the dust (the presence of crystalline silicates and an inner warm dust component in the disk) remains valid.
We have presented a model for the production of circumstellar sodium gas around Pictoris from dust via photon-stimulated desorption. Our model is able to generate the inferred circumstellar sodium within the residence time of the gas but is unable to reproduce the radial dependence of the number density distribution if the sodium atoms do not migrate to larger distances via radiation pressure. Our estimate for the time required to desorb the observed sodium is a function of (1) the circumstellar grain temperature, (2) the circumstellar gas temperature, and (3) the gas carbon:sodium abundance ratio.
The photon-stimulated desorption rate of sodium from orbiting dust grains is dependent on the grain temperature with sodium more efficiently desorbed from warmer surfaces. Since the bulk of the surface area of the dust is contained in the smallest grains, we estimated the grain temperature assuming that the grains have radii of = 1 m, are composed of amorphous silicates, and are spherical. However, if the grains are very small (2) then the grain temperature, = , and the sodium desorption rate, = , and 4000 years are required to produce the sodium gas. Or, if the grains are very large (black bodies), then the grain temperature, = , and the sodium desorption rate, = , and 58000 years are required to produce the sodium gas.
In our simple model, we have assumed that the gas and dust have the same temperatures and we have explored the possible range in dust temperature profiles. We also consider how changes in the gas temperature profile affect our estimates for the sodium neutral fraction and therefore the total number of sodium atoms in the disk. The estimated neutral fraction of sodium is weakly dependent on the gas temperature and composition. The radiative recombination coefficients for carbon and sodium decrease by factors of 5 if the gas temperature increases from 10 K to 100 K or 100 K to 1000 K. If the gas has a temperature profile similar to small grains or black bodies (instead of 1 m olivine spheres), then we estimate that the Pictoris disk possesses either 7.01044 or 5.41044 sodium atoms, respectively, similar to the 4.61044 sodium atoms expected if the gas has the temperature profile expected from 1 m amorphous silicate grains. The assumed abundance of sodium relative to carbon also affects the total number of sodium atoms inferred from the neutral sodium observations. In our model, we have assumed that the gas has a solar composition; however, a recent inventory of the circumstellar atomic gas around Pictoris suggests that carbon is enriched compared to iron and oxygen by factors of 16 and 18, respectively (Roberge et al., 2006). If the Pictoris disk is enriched in carbon relative to sodium by a factor of 16, then the disk possesses 1.71044 sodium atoms, somewhat less than the number inferred if the gas has a solar composition.
7. Conclusions
We have obtained Spitzer Space Telescope IRS spectra of the 12 Myr old debris disk around Pictoris. We find that:
1. In addition to the 10 silicate emission feature originally detected in ground-based observations, we, for the first time, also observe weak crystalline silicate emission features at 28 and 33.5.
2. The IRS dust emission spectrum and the overall SED are well reproduced by a dust model consisting of fluffy cometary and crystalline olivine aggregates.
3. No H2, [S I], Fe II, or Si II emission is detected. Our 3 upper limits suggest that 17 H2 remains in the disk significantly less than the previously reported detections of H2 S(1) and S(0) emission. The circumstellar disk around Pictoris has too little gas to support the formation of giant planets.
4. Some of the observed resonantly scattered Na I, observed at visual wavelengths, may be produced via photon-stimulated desorption; the timescale to generate all of the inferred circumstellar sodium is 13000 yr, approximately the residence time of the gas in the disk if the gas is braked by Coulomb forces.
References
- Aitken et al. (1993) Aiken, D. K., Moore, T. J. T, Roche, P. F., Smith, C. H., & Wright, C. M. 1993, MNRAS 265, L41
- Artymowicz et al. (1989) Artymowicz, P., Burrows, C., & Paresce, F. 1989, ApJ, 337, 494
- Artymowicz & Clampin (1997) Artymowicz, P., & Clampin, M. 1997, ApJ, 490, 863
- Augereau et al. (2001) Augereau, J.-C., Nelson, R. P., Lagrange, A. M., Papaloizou, J. C. B., & Mouillet, D. 2001, A&A, 370, 447
- Backman et al. (1992) Backman, D. E., Gillett, F. C., & Witteborn, F. C. 1992, ApJ, 385, 670
- Backman & Paresce (1993) Backman, D. E., & Paresce, F. 1993, in Protostars and Planets III, eds. E. Levy and J. I. Lunine (Tuscon: University of Arizona Press), 1253
- Beust & Valiron (2007) Beust, H., & Valiron, P. 2007, A&A, 466, 201
- Brandeker et al. (2004) Brandeker, A., Liseau, R., Olofsson, G., & Fridlund, M. 2004, A&A, 413, 681
- Chen et al. (2006) Chen, C. H., Sargent, B., Bohac, C., Kim, K. H., Leibensperger, E., Jura, M., Najita, J., Forrest, W. J. et al. 2006, ApJS, 166, 351
- Chihara et al. (2001) Chihara, H., Koike, C., & Tsuchiyama, A. 2001, PASJ, 53, 243
- Chini et al. (1991) Chini, R., Krugel, E., Shustov, B., Tutukov, A., & Kreysa, E. 1991 A&A, 252, 220
- Czechowski & Mann (2007) Czechowski, A., & Mann, I. 2007, ApJ, 660, 1541
- Dent et al. (2005) Dent, W. R. F., Greaves, J. S., & Coulson, I. M. 2005, MNRAS, 359, 663
- Dorschner et al. (1995) Dorschner, J., Begemann, B., Henning, T., Jaeger, C., & Mutschke, H. 1995, A&A, 300, 500
- Fabian et al. (2001) Fabian, D., Henning, T., Jäger, C., Mutschke, H., Dorschner, J., & Wehrhan, O. 2001, A&A, 378, 228
- Fernandez et al. (2006) Fernandez, R., Brandeker, A. & Wu, Y. 2006, ApJ, 643, 509
- Freudling et al. (1995) Freudling, W., Lagrange, A.-M., Vidal-Madjar, A., Ferlet, R., & Forveille, T. 1995, A&A, 301, 231
- Gillett (1986) Gillett, F. C. 1986, in Light on Dark Matter, Proc. First Infra-Red Astronomical Satellite Conf. (Dordrecht: Reidel), 61
- Gledhill et al. (1991) Gledhill, T. M., Scarrott, S. M., & Wolstencroft, R. D. 1991, MNRAS, 252, 50
- Golimowski et al. (1993) Golimowski, D. A., Durrance, S. T., & Clampin, M. 1993, ApJ, 411, L41
- Golimowski et al. (2006) Golimowski, D. A., Ardila, D. R., Krist, J. E., Clampin, M., Ford, H. C., Illingworth, G. D., Bartko, F., Benítez, N. et al. 2006, AJ, 131, 3109
- Gorti & Hollenbach (2004) Gorti, U., & Hollenbach, D. 2004, ApJ, 613, 424
- Haas et al. (1998) Haas, M. R., Hollenbach, D., & Erickson, E. F. 1991, ApJ, 374, 555
- Harvey et al. (1998) Harvey, P. M., Smith, B. J., DiFrancesco, J., Colome, C., & Low, F. J. 1996, ApJ, 471, 973
- Heap et al. (2000) Heap, S. R., Lindler, D. J., Lanz, T. M., Cornett, R. H., Hubeny, I., Maran, S. P., & Woodgate, B. 2000, ApJ, 539, 435
- Heinrichsen et al. (1999) Heinrichsen, I., Walker, H. J., Klauss, U., Sylvester, R. J., & Lemke, D. 1999, MNRAS, 304, 589
- Higdon et al. (2004) Higdon, S. J. U., Devost, D., Higdon, J. L., Brandl, B. R., Houck, J. R., Hall, P., Barry, D., Charmandaris, V. et al. 2004, PASP, 116 975
- Holland et al. (1998) Holland, W. S., Greaves, J. S., Zuckerman, B., Webb, R. A., McCarthy, C., Coulson, I. M., Walther, D. M., Dent, W. R. F. et al. 1998, Nature, 392, 788
- Hollenbach et al. (2005) Hollenbach, D., Gorti, U., Meyer, M., Kim, J. S., Morris, P., Najita, J., Pascucci, I., Carpenter, J. et al. 2005, ApJ, 631, 1180
- Houck et al. (2004) Houck, J. R., Roellig, T. L., van Cleve, J., Forrest, W. J., Herter, T., Lawrence, C. R., Matthews, K., Reitsema, H. J. 2004, ApJS, 154, 18
- Jennings et al. (1987) Jennings, D. E., Weber, A., & Brault, J. W. 1987, J. Mol. Spectrosc., 126, 19
- Jura et al. (2004) Jura, M., Chen, C. H., Furlan, E., Green, J., Sargent, B., Forrest, W. J., Watson, D. M. et al. 2004, ApJS, 154, 453
- Kalas & Jewitt (1995) Kalas, P., & Jewitt, D. 1995, AJ, 110, 794
- Kalas et al. (2000) Kalas, P., Larwood, J., Smith, B. A., Schultz, A. 2000, ApJ, 530, L133
- Kamp & van Zadelhoff (2001) Kamp, I., & van Zadelhoff, G.-J. 2001, A&A, 373, 641
- Kamp et al. (2007) Kamp, I., Freudling, W., & Chengalur, J. N. 2007, ApJ, 660, 469
- Killen et al. (2001) Killen, R. M., Potter, A. E., Reiff, P. H., Sarantos, M., Jackson, B. V., Hick, P., & Giles, B. 2001, J. Geophys. Res., 106, 20509
- Knacke et al. (1993) Knacke, R. F., Fajardo-Acosta, S. B., Telesco, C. M., Hackwell, J. A., Lynch, D. K., Russell, R. W. 1993, ApJ, 418, 440
- Koike et al. (1993) Koike, C., Shibai, H., & Tuchiyama, A.1993, MNRAS, 264, 654
- Koike et al. (2003) Koike, C., Chihara, H., Tsuchiyama, A., Suto, H., Sogawa, H., & Okuda, H. 2003, A&A, 399, 1101
- Krivova et al. (2000) Krivova, N. A., Krivova, A. V., & Mann, I. 2000, ApJ, 539, 424
- Lagage & Pantin (1994) Lagage, P. O., & Pantin, E. 1994, Nature, 369, 628
- Lagrange et al. (1998) Lagrange, A.-M., Beust, H., Mouillet, D., Deleuil, M., Feldman, P. D., Ferlet, R., Hobbs, L., Lecavelier des Etangs, A. et al. 1998 A&A, 330, 1091
- Lammer et al. (2003) Lammer, H., Wurz, P., Patel, M. R., Killen, R., Kolb, C., Massetti, S., Orsini, S. et al. 2003, Icarus, 166, 238
- Lanz et al. (1995) Lanz, T., Heap, S. R., & Hubeny, I. 1995, ApJ, 447, L41
- Leblanc et al. (2006) Leblanc, F., Barbieri, C., Cremonese, G., Verani, S., Cosentino, R., Mendillo, M., Sprague, A., & Hunten, D. 2006, Icarus, 185, 395
- Lecavelier des Etangs et al. (1993) Lecavelier des Etangs, A., Perrin, G., Ferlet, R., Vidal-Madjar, A., Colas, A., Colas, F., Buil, C., Sevre, F. 1993, A&A, 274, 877
- Lecavelier des Etangs et al. (2001) Lecavelier des Etangs, A., Vidal-Madjar, A., Roberge, A., Feldman, P. D., Deleuil, M., André, M., Blair, W. P., Bouret, J. C., et al. 2001, Nature, 412, 706
- Li & Greenberg (1998) Li, A., & Greenberg, J. M. 1998, A&A, 331, 291
- Li & Lunine (2003) Li, A., & Lunine, J. I. 2003, ApJ, 590, 368
- Li et al. (2003) Li, A., Lunine, J. I., & Bendo, G. J. 2003, ApJ, 598, L51
- Liseau et al. (2003) Liseau, R., Brandeker, A., Fridlund, M., Olofsson, G., Takeuchi, T., & Artymowicz, P. 2003, A&A, 402, 183
- Madey et al. (1998) Madey, T. E., Yakshinskiy, B. V., Ageev, V. N., & Johnson, R. E. 1998 J. Geophys. Res., 103, 5873
- Mann et al. (2006) Mann, I., Köhler, M., Kimura, H., Cechowski, A., & Minato, T. 2006, A&A Rev., 13, 159
- Mouillet et al. (1997) Mouillet, D., Larwood, J. D., Papaloizou, J. C. B., & Lagrange, A.-M. 1997, MNRAS, 292, 896
- Mukai & Koike (1990) Mukai, T., & Koike, C. 1990, Icarus, 87, 180
- Nahar (1995) Nahar, S. N. 1995, ApJ, 101, 423
- Nussbaumer & Storey (1980) Nussbaumer, H., & Storey, P. J. 1980, A&A, 308, 1980
- Okamoto et al. (2004) Okamoto, Y. K., Kataza, H., Honda, M., Yamashita, T., Onaka, T., Watanabe, J.-I., Miyata, T., Sako, S., et al. 2004, Nature, 431, 660
- Pantin et al. (1997) Pantin, E., Lagage, P. O., & Artymowicz, P. 1997, A&A, 327, 1123
- Paresce & Burrows (1987) Paresce, F., & Burrows, C. 1987, ApJ, 319, L23
- Pascucci et al. (2006) Pascucci, I., Gorti, U., Hollenbach, D., Najita, J., Meyer, M. R., Carpenter, J. M., Hillenbrand, L. A., Herczeg, G. J. et al. ApJ, 2006, 651, 1177
- Roberge et al. (2000) Roberge, A., Feldman, P. D., Lagrange, A.-M., Vidal-Madjar, A., Ferlet, R., Jolly, A., Lemaire, J. L., & Rostas, F. 2000, ApJ, 538, 904
- Roberge et al. (2006) Roberge, A., Feldman, P. D., Weinberger, A. J., Deleuil, M., & Bouret, J.-C. 2006, Nature, 441, 724
- Sheret et al. (2004) Sheret, I., Dent, W. R. F., & Wyatt, M. C. 2004, MNRAS, 348, 1282
- Smith & Terrile (1984) Smith, B. A., & Terrile, R. J. 1984, Science, 226, 1421
- Tamura et al. (2006) Tamura, M., Fukagawa, M., Kimura, H., Yamamoto, T., Suto, H., & Abe, L. 2006, ApJ, 641, 1172
- Telesco & Knacke (1991) Telesco, C. M., & Knacke, R. F. 1991, ApJ, 372, L29
- Telesco et al. (2005) Telesco, C. M., Fisher, R. S., Wyatt, M. C., Dermott, S. F., Kehoe, T. J. J., Novotny, S., Marinas, N., Radomski, J. T., Packham, C., De Buizer, J., & Hayward T. L. 2005, Nature, 433, 133
- Thébault & Augereau (2005) Thébault, P., & Augereau, J.-C. 2005, A&A, 437, 141
- Thi et al. (2001) Thi, W. F., Blake, G. A., van Dishoeck, E. F., van Zadelhoff, G. J., Horn, J. M. M., Becklin, E. E., Mannings, V., Sargent, A. I., van den Ancker, M. E., & Natta, A. 2001, Nature, 409, 60
- Verner & Ferland (1996) Verner, D. A., & Ferland, G. J. 1996, ApJS, 103, 467
- Verner et al. (1996) Verner, D. A., Ferland, G. J., Korista, K. T., & Yakovlev, D. G. 1996, ApJ, 465, 487
- Vidal-Madjar et al. (1998) Vidal-Madjar, A., Lecavelier des Etangs, A., & Ferlet, R. 1998, Planet Space Sci. 46, 629
- Voshchinnikov & Krügel (1999) Voshchinnikov, N. V., & Krügel, E. 1999, A&A, 352, 508
- Wahhaj et al. (2003) Wahhaj, Z., Koerner, D. W., Ressler, M. E., Werner, M. W., Backman, D. E., & Sargent, A. I. 2003, ApJ, 584, L27
- Weinberger et al. (2003) Weinberger, A. J., Becklin, E. E., & Zuckerman, B. 2003, ApJ, 584, L33
- Werner et al. (2004) Werner, M. W., Roellig, T., Low, F., Rieke, G., Rieke, M., Hoffmann, W., Young, E., Houck, J. et al. 2004, ApJS, 154, 1
- Wolniewicz et al. (1998) Wolniewicz, L., Simbotin, I., & Dalgarno, A. 1998, ApJS, 115, 293
- Wolstencroft et al. (1995) Wolstencroft, R. D., Scarrott, S. M., & Gledhill, T. M. 1995, Ap&SS, 224, 395
- Yakshinskiy & Madey (1999) Yakshinskiy, B. V., & Madey, T. E. 1999, Nature, 400, 642
- Yakshinskiy & Madey (2004) Yakshinskiy, B. V., & Madey, T. E. 2004, Icarus, 168, 53
- Zuckerman et al. (1995) Zuckerman, B., Forveille, T., & Kastner, J. 1995, Nature, 373, 494
- Zuckerman et al. (2001) Zuckerman, B., Song, I., Bessell, M. S., & Webb, R. A. 2001, ApJ, 562, L87
| 50 | 100 | Atomic/Molecular | |||
|---|---|---|---|---|---|
| Gas Species | Wavelength | Line Flux | Mgas | Mgas | Data |
| (m) | () | () | () | References | |
| H2 S(2) | 12.279 | 5.010-14 | 1.61011 | 1.7104 | 2,4 |
| H2 S(1) | 17.035 | 1.210-14 | 2.1105 | 17 | 2,4 |
| S I | 25.249 | 8.610-14 | 0.047 | 0.00016 | 1 |
| Fe II | 25.988 | 6.110-14 | 0.29 | 0.0011 | 3 |
| H2 S(0) | 28.221 | 4.110-14 | 3400 | 43 | 2,4 |
| Si II | 34.814 | 4.910-13 | 0.028 | 0.00046 | 1 |
References. — (1) Haas, Hollenbach, & Erickson 1991; (2) Jennings, Weber & Brault 1987; (3) Nussbaumer & Storey 1980; (4) Wolniewicz, Simbotin, & Dalgarno 1998