Dependence of hillslope moisture content on downhill saturation
Abstract
We derive steady equilibria for lateral downslope moisture flow in an idealized thin closed layer as a solution to the 1D Richards’ Equation. The equilibria are determined by two free parameters: the downslope flux and a boundary condition. Solutions exhibit a constant downslope flow speed and moisture content for the constant equilibrium flux, which is the product of the two. However where an isolated zone of fixed saturation degree exists representing a boundary condition, the flow speed immediately upslope is reduced and the moisture content correspondingly increased to preserve the constant equilibrium flux. The capillary head jump at the saturated zone produces a blockage that gives a high moisture content back upslope through a pooling distance determined by the equilibrium condition that the downslope flux is constant. In our numerical integrations, the vertically projected pooling height is more than 10 km for a fully saturated zone in mixed silty or clay soils, but decreases by about an order of magnitude with every 10% decrease in the boundary-zone saturation degree. The drying of downhill saturated zones with the increased speed of mountain moisture outflow and corresponding decreased mountain moisture content gives a viable explanation for the mysterious unaccounted drop seen in the spring outflow in the La Luz / Fresnal Watershed at Alamogordo’s upstream spring-box diversions in the semiarid southeastern New Mexico USA.
[agu index terms: hydrology (1800), groundwater hydrology (1829), groundwater transport (1832), streamflow (1860), soil moisture (1866), vadose zone (1875)]
NOVEMBER \titlerunningheadHILLSLOPE MOISTURE CONTENT \authoraddrL. J. November, La Luz Physics, La Luz NM 88337-0217 USA (laluzphys@yahoo.com)
1 Introduction
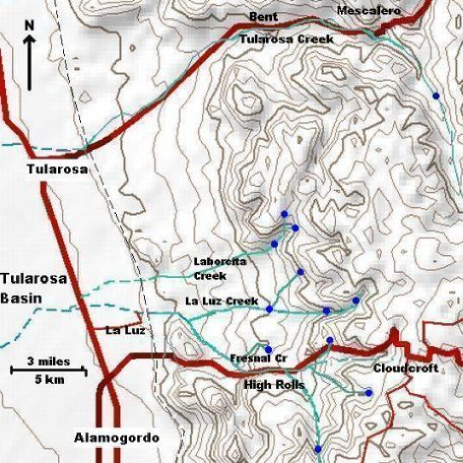
Largely with the hope of increasing the captured outflow of the La Luz / Fresnal Canyon stream system, the Town of Alamogordo New Mexico substantially repaired and moved its collection system between 1982-1997, to divert nearly all of the streamflow at or just below the mountain spring sources. The locale is shown on the topo map in Figure 1 with the main springs indicated. By transporting the water in pipes through the lower canyons of the western Sacramento Mountains they minimize evapotranspiration losses and avoid possible losses due to unappropriated human usage, which is believed to have been a problem historically.
The 100-year-span USGS-monitored baseflow at the foot of the mountains near the village of La Luz was 7.8 million gallons per day (Mgal/d) (342 l/s), shown as a dashed line in Figure 2a (USGS reports summarized in Table E-6 of South Central Mountain RC&D Council et al. 2002), but in the mid 1980s the streamflow ranged up to about 11.5 Mgal/d (504 l/s) in the median of the daily averages selected from two-month periods when the flows were consistently high (plus signs, from New Mexico Water Resources Data, USGS yearly reports). The La Luz / Fresnal streamflow was quite variable since the USGS monitoring resumed after 1980 due to the intermittent operation of Alamogordo’s diversions, but during 1985-87 the La Luz spring capture boxes were not operated and the streams allowed to flow fully during the transition to the new system. A consistently high flow during the transition period indicates that Alamogordo was not diverting the water elsewhere in the system and allows us to obtain a best minimum estimate for the full natural streamflow. The empty boxes in Figure 2a show the average metered pipe flow made during periods when some streamflow was allowed and give a lower bound on the actual system outflow; the filled boxes are for periods when the entire flow was piped and streams dryed, and represent essentially the full system outflow (New Mexico Office of the State Engineer, unpublished data, 2006; Town of Alamogordo, unpublished data, 2007). The data point rms accuracy is limited by the inherent device precision, which for Alamogordo’s pipe-flow measurements is 2%, and for the USGS streamflow measurements is estimated to be 5%, the minimum noise for the daily averages obtained with their system.

However after the upstream diversion relocation was complete, rather than increase, the total outflow of the system dropped to less than 2.5 Mgal/d (110 l/s) by 2002. The drop represents a huge decrease from about 11.5 Mgal/d (504 l/s) to less than 2.5 Mgal/d (110 l/s) or a loss of about 78%! During the same 1986-2002 period, the average precipitation in the Cloudcroft and mountain source area decreased by about 25%, as shown by the smoothed curve in Figure 2c (Western Regional Climate Center 2006). Similar Tularosa Creek showed a larger 30% drop during the period suggesting a streamflow overresponse to the precipitation change and implying a reduced projected La Luz / Fresnal flow for the dry period of about 8 Mgal/d (351 l/s). Thus without other significant appropriations or diversions, we estimate a drop in the total system outflow from about 8 Mgal/d (351 l/s) to less than 2.5 Mgal/d (110 l/s) meaning that about 69% of the normal system outflow cannot be accounted for since the mid-1980’s. The unaccounted drop is probably conservative since downstream losses are not considered in comparing upstream spring outflow to downstream flow. However small secondary sources are also known to exist, which act oppositely, adding to the downstream flow.
As a baseline, the USGS daily record from Bent NM shows that Tularosa Creek about 10 miles (16 km) to the north, which has remained intact, has changed consistently with the mountain precipitation with a 3.76 year delayed response, evident in comparing the smoothed data lines between Figures 2b and 2c (New Mexico Water Resources Data, USGS yearly reports). Since 1998, Cloudcroft and its surroundings above the La Luz / Fresnal Watershed have experienced considerable drying of wells and springs, with a forest mortality consistent with a reduced mountain moisture content, whereas no similar depletions or its effects seem evident in Mescalero and the mountains above Tularosa Creek. Laborcita Creek, which has a much smaller normal outflow, was not monitored consistently during the period.
The drop in outflow seen in the La Luz / Fresnal Stream System is regionally localized, appears to be historically unprecedented, and has been persisting after 2002, so most common effects can be ruled out. For example, precipitation patterns, snowpack variation or storm distribution and frequency, have larger spatial scale and are historically recurring. A similarly large drop in outflow was not seen in the other major stream systems in the locale, and an unusually large drop did not occur in the La Luz / Fresnal Stream System following the 1970s dry period. The loss is greater than all the other appropriations in the system combined and much larger than the 0.56 Mgal/d (24.5 l/s) increase in appropriations for the 1980-2000 period, which was for domestic wells mainly located below the Alamogordo diversions (from New Mexico Office of the State Engineer, WATERS database www.ose.state.nm.us, 2007). Other water users in the system have experienced similar drops in their spring flow and drying of their wells during the period too. Thus a significant impact due to other human usage seems precluded.
The steady and precipitous drop with approximately the same e-folding time as the delayed response in the Tularosa Creek system, and apparently nearly uniform loss in all of the springs after 1997 when Alamogordo started taking all of the streamflow, suggests a hydrological phenomenon. Rick Warnock, president of the Sacramento Mountain Watershed Restoration Corporation, has maintained that the lower-canyon drying must be the main cause of the mountain water depletion (Warnock July 11, 2006). In one study in another system, diurnal and bi-annual moisture variations are found to be strongly linked to changing downstream river flow (Waichler and Yabusaki 2005).
Such a large anomalous event gives unique opportunity for a critical hydrological test: Is it possible that downstream drying could cause upslope moisture depletion? A downstream influence on upslope conditions may be possible if unsaturated lateral downslope moisture dynamics plays a dominant role in controlling the water distribution throughout the system. The relative importance and interrelation of saturated/unsaturated dynamics in downslope flow has been a matter of study and discussion (Freeze and Witherspoon 1966; Jackson 1992). Numerous measurements indicate direct 3D unsaturated near-surface moisture flow, suggesting that a significant downslope flow component may remain as unsaturated (e.g. Weyman 1973; Nieber and Walter 1981; Miyazaki 1988; Sinai and Dirksen 2006). A largely unsaturated downslope flow may be suggested by the fact that the streamflow in these systems is never larger than about 15% of the total precipitation inflow.
We seek guidance on the gross characteristics of large-scale mountain moisture storage dynamics outlined here. The geological and topographical constraints suggest that moisture leaves the mountains traveling through the lower canyons mainly as a lateral downslope flow in a thin layer being prevented from seeping down very far because of underlying impervious layers. The Richards’ Equation describes general moisture flow in mixed saturated/unsaturated ground-water systems giving a correct upper vadose zone, capillary fringe, water table, and lower saturated zone in simulations, though its multidimensional form is difficult to model due to its nonlinear properties (Fipps and Skaggs 1989; Fiori and Russo 2007).
One published solution to the Richards’ Equation for general downslope flow in a thin layer assumes a constant downslope flow speed and moisture content (Philip 1991), while others show pooling at the bottom of the hillslope (Sloan and Moore 1984; Hurley and Pantelis 1985; Stagnitti et al. 1986; Steenhuis et al. 1999). As we show in this study, flow solutions of both these types are obtained depending upon the choice of downhill boundary condition. The boundary condition may be affected by streamflow maintaining a downhill saturated zone. Where a high downhill saturation degree is maintained, moisture backs upslope through a pooling distance that depends upon the soil type. Alamogordo’s diversions near the canyon spring sources dry the lower-canyon stream system, which must dry the lower saturated zones and change the downhill boundary condition. Such drying leads to a higher-speed lateral downslope moisture flow into the open alluvial basin below with a decreased moisture content back upslope as we describe. The reduced moisture content can affect the nearby spring outflow as well as possibly the relative mountain moisture content above.
2 1D Steady Moisture Flow
Friction flow down a uniformly filled closed layer of constant inclination and thickness is an idealization of the flow of mountain moisture to a lower basin outlet over a distance , as illustrated in Figure 3. By Darcy’s rule, the flux (or specific flux) with units of speed (L/T) is always away from the pressure head (Chapter 5, Bear 1988)
| (1) |
written for isotropic conditions, where the scalar hydraulic conductivity with units of speed (L/T) and the capillary pressure head with units of length (L) are functions of the saturation (or saturation degree) and the soil properties; represents the gradient of the gravitational pressure head. The saturation degree ranges from 0 to 1 in proportion to the fractional water filling of the available spaces between soil grains, with indicating fully saturated. The flux is proportional to the flow speed
| (2) |
where defines the moisture content (Section 9.4.4 Bear 1988), and is the porosity, the fractional volume of open space between soil grains. Though in our mathematical formulation a spatially varying porosity is allowed, in general discussions concerning the downslope flow speed and moisture content, a uniform porosity is assumed for simplicity.

The conservation of moisture is represented by the incompressible form of the continuity equation (Section 9.4, Bear 1988)
| (3) |
assuming that the medium is nondeformable or the porosity not temporally varying. We have neglected other terms commonly introduced into the continuity equation representing precipitation influx, evapotranspiration loss, or seepage out the bottom below the hilltop entry point at . While such effects might be included, they should not alter the essential physical properties of the solutions, as we discuss further in Section 7.
Combining (1) and (3) yields the Richards’ general flow equation (Richards 1931)
| (4) |
having expanded the gradient of the capillary head with its implicit spatial dependence .
We are primarily interested in the lateral downslope component to the flux , which satisfies the vector-element equation of (1)
| (5) |
using , for the hillslope inclination .
We adopt the 1D approximation as justified and used in other similar studies (Sloan and Moore 1984; Hurley and Pantelis 1985; Stagnitti et al. 1986; Steenhuis et al. 1999), supposing that moisture changes normal to the surface are small compared to lateral changes down the flow layer, which should be the case when the idealized flow layer of Figure 3 is thin. The 1D flow vector can be written , and with variations only in the downslope direction , the flux and saturation written and . The continuity equation (3) in the 1D approximation is written
| (6) |
Steady equilibrium solutions are obtained with in (6), which gives a constant flux downslope in . A constant saturation down the flow layer for the reference saturation degree gives the constant flux and represents one steady solution to (5), written
| (7) |
However general steady equilibria with a varying and nonzero derivative in (5) also exist. Solving for the derivative gives the governing differential equation for saturation degree as a function of position down the flow layer
| (8) |
now using the reference saturation degree as a problem constant to represent the constant flux defined by (7). Since , dependencies on the inclination angle simply project, and the equation exhibits universal solutions as functions of the vertical coordinate measured positively upward and independent of the inclination angle
| (9) |
Solutions to the first-order differential equation are describable by one additional free parameter besides the constant flux or reference saturation , a boundary value at some downslope position , which may represent the saturation in a fixed constant boundary zone. The boundary condition only makes physical sense as a downhill condition given the form of the solutions found in Section 3, as we discuss further in Section 6.
We adopt the van Genuchten material functions for and (van Genuchten 1980; van Genuchten and Neilsen 1985), written in terms of the effective saturation degree , for a small retained moisture saturation degree
| (10) |
| (11) |
where , the saturated hydraulic conductivity, , and are material constants. The retained moisture saturation degree is a small zero offset for the saturation curves that depends upon the soil type. For our calculations, we suppose uniform soil properties with constant material parameters , , , and , and use .
The Van Genuchten formulation is empirical, but is a good approximation for soil measurements as described by Assouline and collaborators in their fully developed theoretical formulation of the problem. Assouline and Tartakovsky (2001) give best fits for the van Genuchten coefficients for different materials in their Table 2. Figure 4 illustrates the van Genuchten material functions for various soil samples. The singular behavior in the derivative approaching full saturation leads to a very small saturation change with height near full saturation in (9) and solutions with large pooling heights. The La Luz / Fresnal Watershed consists of mixed soils and should correspond to an intermediate silty soil between coarse sand and dense clay , taken between Pachappa Loam and hypothetical mix 2.

Solutions to (9) are independent of the saturated hydraulic conductivity , which divides out in the ratio . Such independence gives the equilibria certain robustness as is the least certain material constant due to the inhomogeneous character of real ground material, which can allow some relatively high-speed horizontal flow in cracks and open zones (Sigda and Wilson 2003). It ranged from about 0.01 to 3 m/d in field tests (from the averages in Table 1 of Xiang et al. 1997), but to much larger values m/d with a median of 7 m/d for a sample of wells from draw-down measurements made in the Tularosa Basin (Orr and Myers 1986). We suppose m/d for estimating downslope flow speeds. The choice gives a saturated flow speed 5.0 m/d, combining (7) and (2) for , with as the half-mountain-height inclination, and with the choice for the porosity of poorly sorted soils (Section 2.5.2, Bear 1988). For an approximate 7 km mid-mountain characteristic downslope spatial scale for upper La Luz Creek from Figure 1, we obtain a saturated-flow timescale of 3.8 years for the system, consistent with the e-folding time for the drop after 1997 seen in Figure 2 or the delayed response for Tularosa Creek with changing precipitation.
3 Numerical Solutions
Figure 5 presents equilibrium solutions to (9) formed by fourth-order Runge-Kutta numerical integration in the upslope direction from a given fixed downhill saturation degree at 20 km, as labeled on the right of each example, for the reference saturation degree and materials defined by the van Genuchten coefficient combinations and given with Figure 4. The integration step of 1 m was chosen as the largest step size that always produces stable and consistent results. The models illustrate the tendency for moisture to backup upslope at near the saturation degree of the fixed downhill zone through a characteristic pooling height determined by the boundary value and material type.


Figure 6 shows the pooling height as a function of the boundary saturation degree, which is defined by locating the intercept of the saturation curve above the lower boundary with the upper-hillslope reference saturation line in numerical solutions as from Figure 5. The pooling height shows about a factor of 10 drop with every 10% decrease in the downhill saturation degree for any soil type near high saturation, though clays and silts require less downhill saturation for a given pooling height. The pooling height is more than 10 km behind a downhill saturated zone in all but the sandiest soil type, the Pachappa fine sandy clay. For average mix 1 or sandier, it decreases to less than 2 km with a downhill saturation degree of , and less than a km with . Though not shown, pooling heights decrease a little with smaller reference saturation degree and are not very sensitive to the retained moisture saturation degree .

4 Upper-Hillslope Flow Conditions
The Richards’ Equation solution properties, the variations of saturation degree and flow speed, are defined by the downslope flux. The flux is defined by the product of the saturation degree and flow speed in (2), or for the 1D solutions
| (12) |
The 1D equilibrium solutions from (9) determine the downslope saturation function for a given flux or reference saturation degree . Given a saturation function , we obtain immediately the general product containing the downslope flow speed using (12), for what may be possibly a downslope varying porosity . Since is a monotonically increasing function of for all material types from Figure 4a, a constant reference saturation degree is uniquely defined by the constant flux in (7), so both the constant product with the flow speed and constant saturation degree for the upper hillslope are determined by the given flux using (7) and (12).
The reference saturation degree must always increase with increasing flux from (7). However the upper-hillslope flow speed in may either increase or decrease with increasing from (12). The rate of change can be determined by taking the derivative in (12), which gives
| (13) |
then substituting the derivative from (7) and re-using (12) and (7) gives
| (14) |
The discriminator is determined by the hydraulic conductivity function from (10) alone and is plotted in Figure 7 for all of the van Genuchten material types defined in Figure 4. Where is negative, the flow speed in the upper hillslope decreases with increasing flux.

5 Flux Estimate
Our choice of reference saturation degree for the La Luz / Fresnal Watershed is reasonable considering the drop in outflow seen at the upstream spring boxes, but seems justified too given estimates of the precipitation inflow. The constant flux down the layer is defined by (7). For , , and the choice m/d, with Pachappa loam as defined in Figure 4, we obtain the flux ; with mix 1, m/d; and with mix 2, m/d.
The specific flux through the system is determined by the total precipitation inflow normalized by the dimensions of the flow layer
| (15) |
where is the total precipitation inflow, is the specific precipitation flux incident through the horizontal plane, the relative precipitation fraction that goes into the downslope moisture flow, the spatial extent of the high-precipitation source region in above the flow layer, the spatial extent of the source region into the plane of the drawing Figure 3 in , and the thickness of the flow layer (see Section 5.1, Bear 1988). The results are independent of the scale , which divides out of the total precipitation inflow .
For purposes of estimating the downslope flux, we suppose that the total precipitation inflow can be divided systematically between components: ground moisture flow , streamflow , evapotranspiration loss , and immediate run off . For the dry 2000s
| (16) |
and for the wet 1980s
| (17) |
The Tularosa Creek streamflow overresponse to the precipitation change suggests that there was less relative evapotranspiration during the wet period. Total evaporation is determined by the exposed surface water, which should not change much with a small change in precipitation. Although the transpiration physics is complicated, natural mechanisms tend to compensate for decreased available moisture in the root zone so that plant transpiration may remain nearly constant with changing precipitation (Salvucci 2001; Teuling et al. 2006), thus we take . About 5% leaves as immediate flood runoff in 3-7 large storm events per year so and (estimated using New Mexico Water Resources Data, USGS yearly reports). The highest precipitation from 1987 was 33% higher than for the dry 2000s, from the average line in Figure 2c, but the maximum relative Tularosa Creek streamflow was actually larger from Figure 2b.
Though streamflow responds to the underground saturation in nonlinear ways as we describe in Section 8, supposing for overall estimation purposes only that the streamflow stays approximately proportional to the downslope moisture flow for the relatively small changes as may be caused by precipitation variations in similar downhill saturation conditions, we have . Using , we can eliminate all the quantities for the wetter period in (17), giving
| (18) |
Then substituting in (16) and eliminating with (18) gives the relative evapotranspiration
| (19) |
Under normal downhill saturated conditions in the area system, about 15% of the precipitation appears as streamflow so , giving the ground moisture flow for the moisture fraction . Under the reduced downhill saturation conditions in the La Luz / Fresnal Watershed after 2002, the relative streamflow was , which gives an increased relative moisture flow of for .
The precipitation influx for the La Luz / Fresnal Watershed is 25 in/yr = 1.74 mm/d asymptotically as a base level for 2006 from Figure 2c. We estimate the spatial extent for the high-precipitation source region as 12 km as the flattening top of the watershed above 7000 ft (2134 m) elevation partially shown in Figure 1. A representative flow-layer thickness seems most uncertain, but we assume a typical spacing of the impervious limestone strata of m characteristic of parts of the mountain system. With our guess and using the intermediate moisture fraction , we obtain 0.326 m/d from (15) reasonably consistent with the fluxes we obtained for the reference saturation degree . We must point out however that by adjusting the parameters within acceptable ranges, we obtain a range of fluxes and corresponding reference saturations.
The downslope moisture flow speed is defined from (12). Taking a porosity 0.17 for poorly sorted soils, with the flux m/d and intermediate saturation degree , we obtain the flow speed m/d.
6 Physical Interpretation
Steady equilibria like those derived in Section 2 represent the long-term downslope profiles of saturation degree. Time series as represented by (1) and (3), or by the general Richards’ Equation (4), or the 1D equations (5) and (6) must tend to the nearest equilibrium with a characteristic timescale determined by the flow speeds for the problem.
The 1D steady lateral downslope equilibria are determined by two free parameters: the flux and a boundary condition. Streamflows stay approximately uniform below the springs, but are absorbed into the ground within a few km beyond the foot of the mountains shown on the topo map in Figure 1, where the geology changes from sandy-clay limestone stratigraphy to alluvial fill. There the hydrology should change correspondingly from closed to open. In the basin, moisture pools with a variable deep water table and thus can exert no pressure back upslope. With an open boundary, no change in the downhill saturation is imposed and the downslope flow must follow the upper-hillslope form seen in all of the solution curves, a constant flow speed and saturation degree for the given flux from (12), like the solution reported in one study (Philip 1991). With a change of precipitation inflow for a new flux , the flow speed and saturation degree must adjust to the new steady equilibrium defined in Section 4 with Figure 7.
At the onset of a new saturated zone, as may be produced with a renewed sufficient continuous streamflow, the flux immediately upslope defined in (5) must be greatly decreased and may even become negative by the imposed positive singularity due to the large factor near . The downslope flux is slowed or may even reverse its direction representing a net flux back upslope. The reduced downslope flux produces an increased upslope saturation according to the 1D continuity condition (6). In effect the downslope moisture flow is blocked, and the blockage must propagate back upslope as moisture piles up behind it leading to equilibrium solutions (9) with profiles like those shown in Figure 5, which represent a return to the equilibrium constant downslope-flux condition. We may say that moisture backs up behind the capillary head jump introduced in a zone of fixed saturation degree through a pooling height determined by the balance between the downslope gravity-driven flux out the bottom of the blockage and the influx into the top. If the saturated zone is not sufficiently maintained, nonequilibrium or discontinuous behavior is possible and the flow may again return to the reference saturation below the saturated zone depending upon conditions further downslope.
During the transition from normal streamflow to no streamflow or from a normally saturated downhill boundary condition to an open boundary condition, a temporary increase in the total moisture outflow into the basin below must occur. The normal flux out into the basin will return as the dryed system reaches a new equilibrium on the adjustment timescale. The adjustment might be evidenced as a locally increased water table in the basin, except that the Tularosa Basin is so large that such changes may be difficult to detect and probably could not be distinguished from other effects, like precipitation change or distributional inhomogeneity. The Tularosa Basin surface area is about 13,500 km2 compared to the La Luz / Fresnal Watershed, which is about 200 km2. Also it seems that adequate basin water-table measurements are not available.
7 Generalizations to 3D
In real 3D conditions, moisture can travel out of the mountain source area along a number of independent paths, with different inflows, downslope variations in conditions, and differing downhill saturation zones on each path. The 1D approximation should remain applicable in the idealized flow layer of Figure 3 even with changing material properties downslope in . As the equilibrium equations (5), (10), and (11), with constant in are independent of the porosity , a changing porosity downslope does not affect the downslope saturation solutions, but does affect the flow speed through (12). A changing hydraulic conductivity or capillary pressure downslope in does not affect the 1D assumptions either since it only changes the material functions that enter (9), so solutions for should be like what is found in the uniform cases.
A slowly changing downslope flux , as produced with an added precipitation influx, or evapotranspiration or flow-layer losses, in a thin flow layer of constant cross section must produce a slightly changed saturation degree downslope in the integrated (9), but should not alter the essential solution properties. Such variations should produce systematic modifications to the pooling heights above saturated zones.
With variations in conditions across the flow layer or a varying cross section or inclination downslope, non-lateral components to the flux vector may be introduced and the 1D approximation break down, consistent with the belief that underground geological and topographical structure gives rise to deeper saturated structure like perched aquifers (Jackson 1992; Neuweiler and Cirpka 2005). In principle, the four equilibrium equations from (3) , and the three components of (1) define the three components of and throughout the 3D volume of the flow layer. The flux equation (5) still represents the downslope component in the general 3D conditions and must be preserved in integrated form in the equilibrium solutions. Thus we argue that in 3D conditions where a nonnegligible downslope flux covering the cross section exists down the flow layer, the basic physical conservation principles from the 1D solutions should still apply, and flow backup similarly above downhill saturated zones that cover the cross section of a closed flow layer. Hurley and Pantelis (1985) define special forms of variations that still preserve the 1D flow vector.
The 1D approximation breaks down too in the boundary zone if the saturating process by streamflow produces a non-uniform moisture distribution underground. Variations in the upslope pooling properties can occur if the underground is inhomogeneously partially saturated rather than being uniformly filled with a single saturation degree, as idealized in our 1D solutions. While the two cases of a fully saturated boundary zone covering the cross section of the flow layer with maximum pooling above and an open boundary with no pooling are still correctly represented, partial coverage may change the properties of the downslope flow blockage and modify the pooling heights between the two extremes.
8 Conclusions
The hypothesis that water leaves the mountains mainly in a large-scale near-surface moisture flow is idealized by our 1D Richards’ Equation model for lateral downslope steady flow in a uniformly filled thin closed layer of constant cross section and inclination. The Richards’ Equation represents general saturated/unsaturated underground moisture dynamics. The 1D steady flow equation is directly integratable and exhibits a constant downslope flow speed and moisture content determined by the constant downslope flux. At a boundary zone of increased saturation degree, the flow speed is slowed and moisture content increased back upslope through a pooling height, characteristized by the equilibrium condition that the flux, the product of the flow speed and moisture content, is constant. Surface streamflow must produce zones of increased saturation degree that affect the underground saturated boundary condition. Such a strong solution dependence on the form of the lower boundary condition suggests that mountain moisture content in hillslopes above deep alluvial basins may be strongly affected by lower streamflow.
In our numerical integrations, the pooling height is more than 10 km vertically projected behind a fully saturated zone in all but the sandiest soil types, but decreases rapidly with a decreasing boundary saturation degree. The other cited studies of downslope moisture flow in a thin layer also show a constant flow speed and saturation degree or pooling at the bottom asymptotically in their time series, but our pooling heights appear to be much larger than what is found in the other studies. The large scale arises mainly because material capillary head functions exhibit singular behavior near full saturation, and all of the cited studies that show downstream pooling use different approximations for the material hydraulic conductivity or capillary-head functions to obtain a more tractable problem.
Spring outflow must be a direct result of the coalescence of underground moisture in irregular topography near or upslope from the spring (Freeze 1972; Fipps and Skaggs 1989). With a reduced downhill saturation, the saturation degree outside the streambed and back up to the spring may be greatly decreased from a near 100% pooling-determined saturation degree to a 30% reference saturation degree for representative conditions in the La Luz / Fresnal Watershed. Thus the drop of in spring outflow, as the unaccounted loss seen at Alamogordo’s upstream spring-box diversions, seems a reasonable possibility for the downhill drying, taking the spring outflow to be simply proportional to the saturation degree in the spring locale. Though individual spring response to changing conditions may be nonlinear, without knowing the specifics, the general suggestion from studies is that the central hillslope outflow increases with the local water-table height (cited references and Weyman 1973). The mountain saturation above may be significantly, but probably less compromised by downhill drying, as presumably not all of the moisture paths out of the mountain source area are affected. Also the adjustment time for the mountains above is longer and effects there should become evident only more slowly.
The rate at which moisture moves downslope from a disappearing saturated zone or backs up behind a newly established one might be estimated supposing that an unmaintained saturated zone will dissipate downslope at the average flow speed, or flow backup behind a newly formed saturated zone at the same rate. The actual timescale for depletion of the La Luz / Fresnal Watershed seen in Figure 2a and known from the history of the Alamogordo project was about years, which for the flow speed m/d is the time required to travel km, not out of range for the spring distances from the mountain-basin outlet shown in Figure 1. The estimate is consistent with the saturated-flow estimate described at the end of Section 2. We note however the large uncertainty in the flow speed due especially to the uncertainties in the saturated hydraulic conductivity in real field conditions.
References
- Assouline and Tartakovsky (2001) Assouline, S., and D. M. Tartakovsky (2001), Unsaturated hydraulic conductivity function based on a soil fragmentation process, Water Resources Research, 37, 1309–1312, 10.1029/2000WR900332.
- Bear (1988) Bear, J. (1988), Dynamics of Fluids in Porous Media, Dover Publications, Inc., New York.
- Fiori and Russo (2007) Fiori, A., and D. Russo (2007), Numerical analyses of subsurface flow in a steep hillslope under rainfall: The role of the spatial heterogeneity of the formation hydraulic properties, Water Resources Research, 43, 7445–7459, 10.1029/2006WR005365.
- Fipps and Skaggs (1989) Fipps, G., and R. W. Skaggs (1989), Influence of Slope on Subsurface Drainage of Hillslopes, Water Resources Research, 25, 1717–1726.
- Freeze (1972) Freeze, R. A. (1972), Role of Subsurface Flow in Generating Surface Runoff 2. Upstream Source Areas, Water Resources Research, 8, 1272–1283.
- Freeze and Witherspoon (1966) Freeze, R. A., and P. A. Witherspoon (1966), Theoretical Analysis of Regional Groundwater Flow: I. Analytic and Numerical Solutions to the Mathematical Model, Water Resources Research, 2, 641–656.
- Hurley and Pantelis (1985) Hurley, D. G., and G. Pantelis (1985), Unsaturated and Saturated Flow Through a Thin Porous Layer on a Hillslope, Water Resources Research, 21, 821–824.
- Jackson (1992) Jackson, C. R. (1992), Hillslope Infiltration and Lateral Downslope Unsaturated Flow, Water Resources Research, 28, 2533–2539, 10.1029/92WR00664.
- Miyazaki (1988) Miyazaki, T. (1988), Water Flow in Unsaturated Soil in Layered Slopes, Journal of Hydrology, 102, 201–214.
- Neuweiler and Cirpka (2005) Neuweiler, I., and O. A. Cirpka (2005), Homogenization of Richards equation in permeability fields with different connectivities, Water Resources Research, 41, 2009–+, 10.1029/2004WR003329.
- Nieber and Walter (1981) Nieber, J. L., and M. F. Walter (1981), Two-Dimensional Soil Moisture Flow in a Sloping Rectangular Region: Experimental and Numerical Studies, Water Resources Research, 17, 1722–1730.
- Orr and Myers (1986) Orr, B. R., and R. G. Myers (1986), Water in basin-fill deposits in the Tularosa Basin, New Mexico, US Geological Survey Water Resource Investigations Report 85-4219.
- Philip (1991) Philip, J. R. (1991), Hillslope Infiltration: Planar Slopes, Water Resources Research, 27, 109–117, 10.1029/90WR01704.
- Richards (1931) Richards, L. A. (1931), Capillary conduction of liquids through porous media, J. Appl. Phys., 1, 318–333.
- Salvucci (2001) Salvucci, G. D. (2001), Estimating the moisture dependence of root zone water loss using conditionally averaged precipitation, Water Resources Research, 37, 1357–1366, 10.1029/2000WR900336.
- Sigda and Wilson (2003) Sigda, J. M., and J. L. Wilson (2003), Are faults preferential flow paths through semiarid and arid vadose zones?, Water Resources Research, 39, 10–1, 10.1029/2002WR001370.
- Sinai and Dirksen (2006) Sinai, G., and C. Dirksen (2006), Experimental evidence of lateral flow in unsaturated homogeneous isotropic sloping soil due to rainfall, Water Resources Research, 42, 12,402–12,414, 10.1029/2005WR004617.
- Sloan and Moore (1984) Sloan, P. G., and I. D. Moore (1984), Modeling Subsurface Stormflow on Steeply Sloping Forested Watersheds, Water Resources Research, 20, 1815–1822.
- South Central Mountain RC&D Council et al. (2002) South Central Mountain RC&D Council, Livingston Associates, and Shomaker and Associates (2002), Tularosa Basin and Salt-River Basin Regional Water Plan 2000-2040, South Central Mountain RC&D Council, Inc., Carrizozo NM.
- Stagnitti et al. (1986) Stagnitti, F., M. B. Parlange, T. S. Steenhuis, and J.-Y. Parlange (1986), Drainage From a Uniform Soil Layer on a Hillslope, Water Resources Research, 22, 631–634.
- Steenhuis et al. (1999) Steenhuis, T. S., J.-Y. Parlange, W. E. Sanford, A. Heilig, F. Stagnitti, and M. F. Walter (1999), Can we distinguish Richards’ and Boussinesq’s equations for hillslopes?: The Coweeta experiment revisited, Water Resources Research, 35, 589–594, 10.1029/1998WR900067.
- Teuling et al. (2006) Teuling, A. J., R. Uijlenhoet, F. Hupet, and P. A. Troch (2006), Impact of plant water uptake strategy on soil moisture and evapotranspiration dynamics during drydown, Geophys. Res. Lett., 33, 3401–+, 10.1029/2005GL025019.
- van Genuchten (1980) van Genuchten, M. T. (1980), A closed-form equation for predicting the hydraulic conductivity of unsaturated soild, Soil Sci. Soc. Am. J., 44, 892–898.
- van Genuchten and Neilsen (1985) van Genuchten, M. T., and D. R. Neilsen (1985), On describing and predicting the hydraulic properties of unsaturated soils, Ann. Geophys., 3, 615–628.
- Waichler and Yabusaki (2005) Waichler, S. R., and S. B. Yabusaki (2005), Mixing of groundwater and surface water under diurnal and seasonal river stage cycles, AGU Fall Meeting Abstracts, F, 1497.
- Warnock (July 11, 2006) Warnock, R. (July 11, 2006), Too many unanswered questions on water, Alamogordo Daily News, pp. 4A, Letter to the Editor.
- Western Regional Climate Center (2006) Western Regional Climate Center (2006), Monthly Total Precipitation, Cloudcroft NM, http://www.wrcc.dri.edu.
- Weyman (1973) Weyman, D. R. (1973), Measurements of the Downslope Flow of Water in a Soil, Water Resources Research, 20, 267–288.
- Xiang et al. (1997) Xiang, J., B. R. Scanlon, W. F. M. III, L. Chen, and R. S. Goldsmith (1997), A multistep constant-head borehole test to determine field saturated hydraulic conductivity of layered soils, Advances in Water Resources, 20, 45–57.