A sharper view of the outer Galaxy at 1420 and 408 MHz from the Canadian Galactic Plane Survey I: Revisiting the KR catalogue and new Gigahertz Peaked Spectrum sources
Abstract
Arcminute-resolution radio continuum images at 408 and 1420 MHz from the Canadian Galactic Plane Survey (CGPS) have been used to reexamine radio sources listed in the Kallas & Reich (1980) catalogue. This catalogue is of particular interest to Galactic studies as it lists both extended and compact radio sources found in the second Galactic quadrant. We have determined the nature (extended vs. compact, Galactic vs. extragalactic) of all of these bright radio sources. A number of large H ii regions with no optical counterparts are highlighted along with a sample of large radio galaxies. Many sources previously thought to be extended Galactic objects are shown to be point sources. A sample of point sources with flat or rising spectra between 408 and 1420 MHz has been compiled, and within this sample likely Gigahertz Peaked Spectrum sources have been identified.
keywords:
surveys – catalogues – Galaxy: disc – radio continuum: general.1 Introduction
Radio continuum observations of the second quadrant of our Galaxy () provide an unmatched opportunity for studying the structure and content of a spiral arm in detail. The Perseus Arm dominates Galactic structure in this quadrant and is viewed almost perpendicular to its long axis over the entire longitude range. The more distant Outer Arm is also well placed for study in this quadrant and in both cases confusion from Local Arm sources is minimal (cf. the view of the Galaxy around looking along the Local Arm). The previously best view of this region in the radio continuum (at 1420 MHz) was a series of surveys done by the Effelsberg 100-m telescope at 9-arcmin resolution. The surveys were summarized in the Kallas & Reich (1980) and Reich, Reich & Fürst (1997) catalogues (KR and RRF respectively). RRF provides a listing of small diameter sources ( arcmin in extent) with an 80 mJy flux density limit (for point sources). The KR catalogue has a higher flux density limit (0.3 Jy) but is of particular interest to Galactic studies as it lists both compact and extended objects.
The new Canadian Galactic Plane Survey (CGPS; Taylor et al. 2003) data provide an unprecedented view of the continuum radiation at both 1420 and 408 MHz from the outer Galaxy. The data have arcminute-scale resolution and have full spatial frequency sensitivity crucial for the detection of extended structures.
In this paper we first revisit the sources found in the KR catalogue. Fich (1986) obtained high resolution VLA images of the sources originally classified as point sources in KR. For these sources we are primarily interested in observing the few of them that had poor VLA observations and to look for inverted spectrum sources. Trushkin (1990) obtained one-dimensional scans at 7.6 and 31.3 cm of most of the extended KR sources using the RATAN-600 telescope and found that many of the apparently extended KR objects were compact sources ( 1-arcmin scale). Trushkin (1990) also suggested that a number of the KR objects were previously unknown compact Galactic supernova remnants (SNRs). We have reexamined all of these sources using the higher resolution and regular beamshape of the CGPS data and have been able to better determine the nature of all of the extended KR objects.
In the course of this study a new sample of extragalactic Gigahertz Peaked Spectrum (GPS) sources has been compiled. CGPS data have also revealed numerous new extended emission features in the second quadrant including both low-surface brightness extended emission and narrow filamentary features – both of which tend to be missed in the lower resolution surveys. The second paper in this series will present a complete catalogue of all extended emission features seen in the CGPS radio continuum data thus providing an updated version of the comprehensive catalogue compiled by Fich (1986).
2 Observations
The goal of the CGPS is to enhance the study of our Galaxy by obtaining arcminute-resolution images of all of the major components of the interstellar medium (ISM) in our Galaxy. Radio continuum observations made as part of this project were obtained using the seven-element interferometer at the Dominion Radio Astrophysical Observatory (DRAO) in Penticton, Canada (Landecker et al., 2000). Details of the CGPS radio continuum observations, data reduction and data distribution are discussed at length in Taylor et al. (2003). CGPS observations currently cover between encompassing almost the entire second quadrant. The 1420 MHz observations have a nominal 1-arcmin resolution and both the 1420 and 408 MHz survey images were constructed with full spatial frequency coverage by combining the interferometer data with data from surveys using the Effelsberg single-dish and the Stockert single-dish telescopes. This provides sensitivity to extended structure which is very important for Galactic studies.
The simultaneous 408 MHz images, with nominal 3-arcmin resolution, provide invaluable data on the shape of the radio continuum spectrum as parameterized by the spectral index () between 408 and 1420 MHz (where flux density F). In this paper we refer to inverted-spectrum sources as those with and flat-spectrum sources as those with .
We also make use of the Mid-infrared Galaxy Atlas (MIGA; Kerton & Martin 2000) and Infrared Galaxy Atlas (IGA; Cao et al. 1997) arcminute resolution infrared images which make up part of the larger CGPS data collection. These infrared images are very useful in the identification of Galactic H ii regions in cases where there is no associated optical emission or available radio recombination line observations.
Flux density measurements were made using software contained in the DRAO Export Software Package. Point source flux densities were obtained using the “fluxfit” program which fits Gaussians to the image and makes use of the beam shape information available in the CGPS data. Extended sources were measured using the “imview” program which allows the user to interactively derive background levels to use in determining the flux densities.
3 Extended sources in the KR catalogue
The KR catalogue is based on 1420 MHz radio continuum observations made at 9-arcmin resolution with the Effelsburg 100-m telescope. Kallas & Reich (1980) identified 236 radio sources with flux density Jy including point sources and extended objects up to 30-arcmin in diameter. The catalogue covered to and . Extended sources were subdivided into three categories depending upon their apparent size: EP (partially extended), E (extended) and VE (very extended). EP sources had a greatest extent of 9-arcmin, E sources had greatest extents between 11-arcmin and 20-arcmin, while VE sources had greatest extents between 20-arcmin and 30-arcmin.
3.1 Very-extended (VE) sources
Data on the twelve very-extended (VE) objects identified by Kallas & Reich (1980) are listed in Table 1. The first column gives the KR catalogue number. Letters following the KR number are used in cases where the object is actually a multiple source at arcminute resolution and are not part of the original classification (e.g., KR206A). Columns 2 through 5 give the flux density measurements and 1 error estimates at 1420 and 408 MHz from the CGPS data. The spectral index between 408 and 1420 MHz () is given in column 6 followed by the angular scale of the source as seen in the 1420 MHz images in column 7. The final column provides extra information about the source, such as an association with well-known optically visible H ii region or SNR. For extended (at 1-arcmin resolution) sources the RRF catalogue number is given if applicable, and for all of the arcminute-scale point sources the NRAO VLA Sky Survey (NVSS; Condon et al. 1998) catalogue designation is provided.
| KR | Fν (1420) | (1420) | Fν (408) | (408) | Diameter | Notes | |
|---|---|---|---|---|---|---|---|
| (mJy) | (mJy) | (mJy) | (mJy) | ′ | |||
| 1 | 120 | RRF 861; H ii Region | |||||
| 3 | 18 | RRF 863; H ii Region | |||||
| 6 | 12 | H ii Region | |||||
| 20 | 15 | H ii Region | |||||
| 47 | 20 | Sh 2-135 | |||||
| 65 | 12 | Sh 2-151 | |||||
| 122 | 24 | H ii Region | |||||
| 166A | 1 | NVSS J032719+552029 | |||||
| 166B | 1 | NVSS J032744+552226 | |||||
| 175A | 1 | NVSS J032952+533236 | |||||
| 175B | 1 | NVSS J033003+532944 | |||||
| 180 | 1 | NVSS J035927+571706 | |||||
| 206A | 1 | NVSS J043523+511422 | |||||
| 206B | 1 | NVSS J043621+511253 | |||||
| 210A | 1 | NVSS J043342+502428 | |||||
| 210B | 1 | NVSS J043357+502420 |
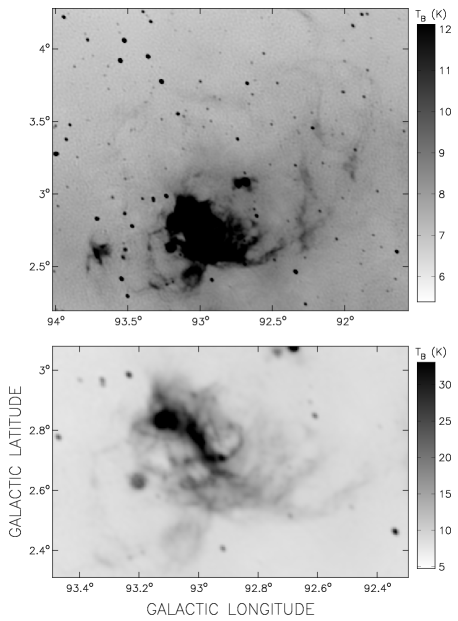
Seven of these sources are Galactic H ii regions. These sources all have flat or inverted spectral indices and have extensive infrared emission visible in the IRAS images. Five of the H ii regions have no optical counterparts. KR 1 is an enormous H ii region stretching up to 2°in size (see Figure 1). Radio recombination line emission has been detected from the region at V km s-1 (Fich, 1986) yielding a kinematic distance (accounting for known streaming motions) of kpc, which implies that the region is also physically large ( pc). Note that the RRF 861 source associated with the region refers only to a compact source making up only a small portion of this extensive region.
KR 3, often incorrectly classified as a SNR, is a Galactic H ii region with a blister morphology which was extensively studied by Foster & Routledge (2001). In addition to the flat radio spectrum and extensive associated infrared emission, radio recombination line emission from the region has also been detected (Foster & Routledge, 2001) solidifying its classification as an H ii region. RRF 863 is centered on the bright radio emission associated with the H ii region/molecular cloud interface while the entire region extends up to 03 in size.
KR 6, KR 20 and KR 122 are all classified as extended Galactic H ii regions on the basis of their radio spectrum and associated infrared emission. None of these regions have known optical counterparts. Finally there are two radio sources associated with optically visible H ii regions. KR 47 is radio emission, about 20-arcmin in extent, associated with the Sh 2-135 H ii region, while KR 65 is diffuse radio emission, about 12-arcmin in extent, that is apparently associated with Sh 2-151.
The remaining five VE sources turn out to be point sources at arcmin-scale resolution. KR 180 appears to have been misclassified because of nearby diffuse radio emission associated with Sh 2-214. This object was also listed by Trushkin (1990) as being extended and being a possible SNR but the CGPS data show this is not the case. The other sources tend to be pairs of point sources with separations 9-arcmin. All but one of the point sources have a non-thermal spectral index and no detectable infrared emission, consistent with them being distant extragalactic objects. The exception is the compact massive star-forming region KR 206B (NVSS J043621+511254) which has an inverted spectrum () and is associated with the bright infrared source IRAS 04324+5106 (RAFGL 5124).
3.2 Extended (E) sources
Kallas & Reich (1980) listed 48 of these sources. Table 2 summarizes the CGPS view of this sample using the same notation as in Table 1. Note that KR 86 was not observed in the CGPS and KR 35 is apparently a spurious source; no bright point source or region of diffuse emission was detected near its catalogued position.
| KR | Fν (1420) | (1420) | Fν (408) | (408) | Diameter | Notes | |
|---|---|---|---|---|---|---|---|
| (mJy) | (mJy) | (mJy) | (mJy) | ′ | |||
| 4 | 12 | RRF 865; H ii Region | |||||
| 7 | 12 | RRF 874; H ii Region | |||||
| 19A | 5 | RRF 903; H ii Region | |||||
| 19B | 4 | RRF 903; H ii Region | |||||
| 21A | 1 | NVSS J214343+523958 | |||||
| 21B | 1 | NVSS J214418+524501 |
Table 2 is presented in its entirety in the electronic edition of the journal.
One source, KR 196, is a very large (25-arcmin diameter) region of bright radio emission associated with the optical H ii region Sh 2-206. Seven other sources match the original classification (diameters between 11-arcmin and 20-arcmin). Three of these (KR 55, 91 and 98) are associated with radio emission from known optical H ii regions, while three others (KR 4, 7, and 80) are H ii regions with no optical counterparts. All of these objects have flat or inverted radio spectra and have associated infrared emission. Finally KR 101 is the well-studied SNR 3C 10 (Tycho’s SNR).
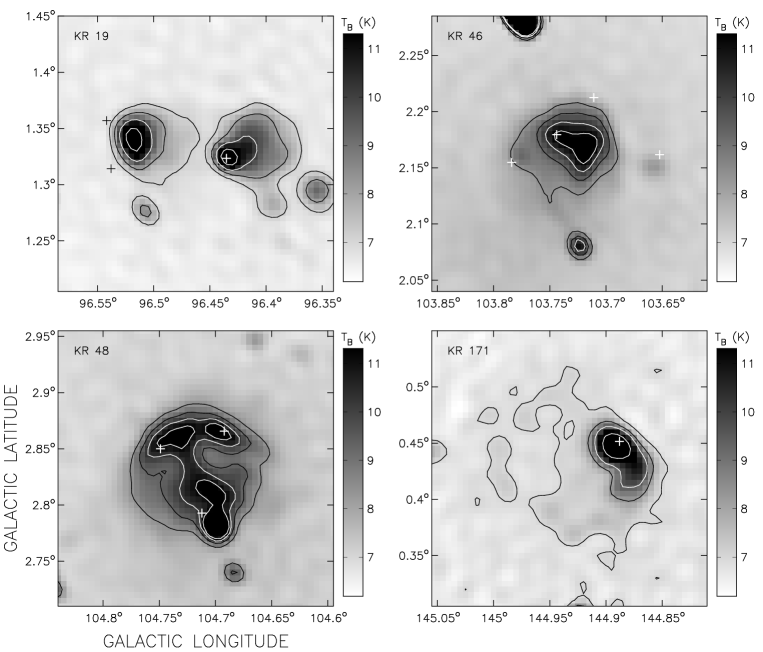
Five other regions (KR 19, 46, 48, 171 and 198) are smaller extended regions. KR 19 consists of two compact H ii regions with the western (19A) region being associated with IRAS 21336+5333 and the eastern one (19B) being associated with two infrared sources IRAS 21340+5339 and IRAS 21340+5337 (see Figure 2). KR 46 is a compact H ii region that shows hints of a blister morphology at 1-arcmin resolution. The radio spectrum is thermal and there is bright infrared emission associated with the region. Trushkin (1990) suggested that KR 48 and KR 171 were possible Galactic supernova remnants. However the CGPS data show the regions have inverted (KR 48) and flat (KR 171) radio spectra and are associated with bright diffuse infrared emission and IRAS point sources. Thus it is more likely that they are both Galactic H ii regions. Finally KR 198 is associated with the optical H ii region Sh 2-207.
KR 168 consists of two slightly elongated sources separated by arcmin. It is likely that these sources are extragalactic jets that are just barely resolved at 1-arcmin resolution. It is not clear that the two sources are physically associated. KR 188 also consists of two elongated sources with a similar point source plus faint jet structure with the point sources being separated by 4 arcmin. In this case the two objects do share common diffuse emission and the jet structures both point back to a common point suggesting that they are physically related. In Table 2 the NVSS designations for the point-like portions of these objects are given.
The remaining “extended” KR sources are all actually point sources at 1-arcmin resolution. The majority of these sources are extragalactic as they have strongly non-thermal spectral indices, are unresolved at 1-arcmin resolution, and have no associated infrared emission. Three of the sources have flat spectra (KR 63, 189 and 192A) and two have inverted spectra (KR 53 and 60A). None of the flat spectrum sources have associated infrared emission and, given that they all have , they are also most likely extragalactic objects. KR 53 is associated with the optical H ii region Sh 2-138. Finally, KR 60A is apparently a flat-spectrum radio galaxy. There is no associated infrared emission and, combining the CGPS flux density measurements with data obtained using SPECFIND (Vollmer et al., 2005), we find a very flat spectral index of over the range from 325 to 4800 MHz as illustrated in Figure 3.

3.3 Partially-extended (EP) sources
The KR catalogue lists 41 of these sources. Table 3 summarizes the CGPS view of this sample using the same notation as in the previous tables. One source (KR 145) appears to have been a spurious object as there are no strong point sources or regions of extended emission near the catalogued coordinates.
Three of the sources have diameters greater than 11-arcmin. KR 200 is a large ( arcmin) region of radio emission a portion of which is directly associated with the optical H ii region Sh 2-209. KR 140 is a 12-arcmin scale H ii region and KR 130 is the well-studied SNR 3C 58.
There are 13 sources which are not point sources but have diameters arcmin. Nine of these objects are radio sources associated with known small-diameter optical H ii regions and one is associated with the nearby galaxy Maffei 2.
| KR | Fν (1420) | (1420) | Fν (408) | (408) | Diameter | Notes | |
|---|---|---|---|---|---|---|---|
| (mJy) | (mJy) | (mJy) | (mJy) | ′ | |||
| 13 | 6 | RRF 888; BFS 6 | |||||
| 15 | 1 | NVSS J212305+550027 | |||||
| 17 | 2 | RRF 899; Sh 2-187 | |||||
| 18 | 6 | RRF 929; BFS 8 | |||||
| 28A | 1 | NVSS J213932+554030 | |||||
| 28B | 1 | NVSS J213934+554445 | |||||
| 28C | 1 | NVSS J213943+554340 |
Table 3 is presented in its entirety in the electronic edition of the journal.
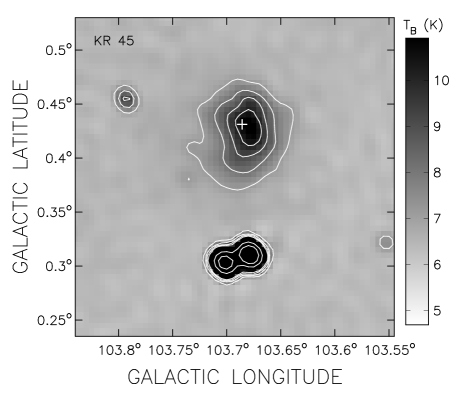
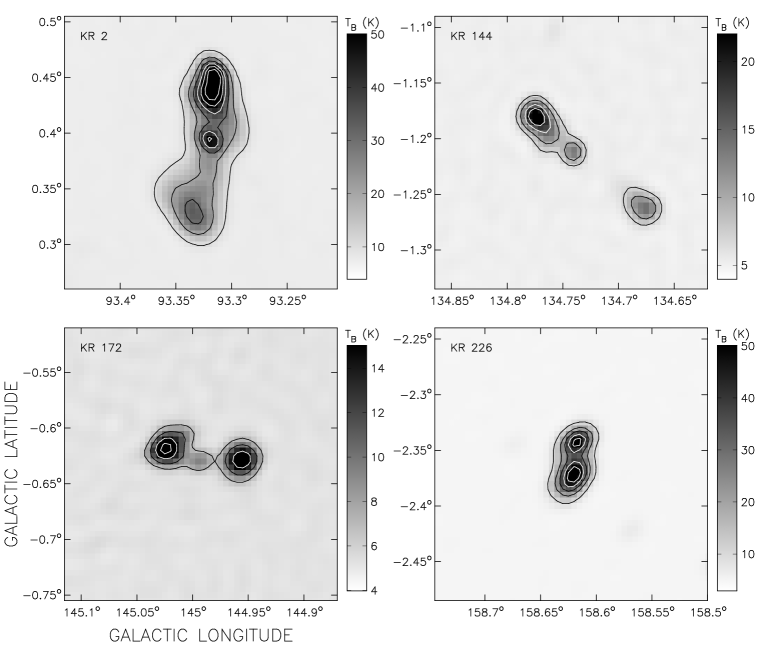
KR 45 (RRF 981) is a combination of extended and point source emission (see Figure 4). The extended radio emission is associated with the distant H ii region IRAS 22181+5716. Molecular line (CO) observations towards this source detect emission at V km s-1 placing the H ii region at a heliocentric distance of kpc. There is also a close double point source (denoted 45A and 45B) which is unresolved in the lower resolution 408 MHz images. These non-thermal point sources have no infrared counterparts and are apparently just background extragalactic sources. The remaining two extended objects (KR 144 and 172) both appear to be radio galaxies with a distinct core/lobe morphology (see Figure 5). The objects shown in Figure 5 appear to be similar to the giant radio source WN 1626+5153 discovered in the Westerbork Northern Sky Survey (Röttgering et al., 1996).
Finally the remaining EP sources are all point sources at 1-arcmin resolution. All but one (KR 58) are likely extragalactic sources having a non-thermal spectral index and no detectable infrared emission. KR 58 has an inverted spectrum and is the planetary nebula NGC 7354 (IRAS 22384+6101).
4 The nature of the point sources in the KR Catalogue
All of the KR point sources (135 in total) except one (KR 195) were observed by the CGPS. Table 4 summarizes the CGPS view of this sample using the same notation as in the previous tables.
The vast majority of these sources are point sources at 1-arcmin resolution. As first demonstrated by Fich (1986) most of these are extragalactic sources as indicated in this study by their strongly negative spectral index between 408 and 1420 MHz and lack of associated infrared emission.
There are a few small extended sources in this subsample. KR 77, 212 and 228 are all regions of extended thermal emission associated with the optical H ii regions Sh 2-159, Sh 2-212 and Sh 2-217 respectively. Perhaps more interesting are the extended extragalactic sources KR 2 and KR 226. Both of these objects are clearly radio galaxies (see Figure 5) and were noted by Fich (1986) as being overresolved in his VLA images. KR 2 extends for about 10-arcmin in its longest direction. Optical spectroscopy of this source places it at a redshift of z=0.02 (Masetti et al., 2004). KR 226 extends for about 5-arcmin and no studies of this object beyond cataloging have been made.
| KR | Fν (1420) | (1420) | Fν (408) | (408) | Diameter | Notes | |
|---|---|---|---|---|---|---|---|
| (mJy) | (mJy) | (mJy) | (mJy) | ′ | |||
| 2 | 6 | RRF 862 | |||||
| 5 | 1 | NVSS J213646+495318 | |||||
| 8 | 1 | NVSS J213701+510136 | |||||
| 9 | 1 | NVSS J213158+521415 | |||||
| 10 | 1 | NVSS J213340+521951 | |||||
| 11 | 1 | NVSS J213833+513550 |
Table 4 is presented in its entirety in the electronic edition of the journal.
There are 14 flat spectrum sources of which three (KR 23, 208, and 212) are associated with optical H ii regions (Sh 2-148, Sh 2-211 and Sh 2-212 respectively). The remaining 11 sources have no associated infrared emission and thus inferred to be extragalactic sources. We examined the four flat spectrum sources with positive spectral indices in more detail. CGPS data were combined with data from Vollmer et al. (2005) and Fich (1986) to obtain the spectra shown in Figure 6.
The radio spectrum of KR 24 is very flat over a wide frequency range, and certainly flatter than expected just from 408 and 1420 MHz data. A least absolute deviation fit to the data gives an overall spectral index of . KR 178 is another very flat spectrum source with least absolute deviation spectral index of over the entire range of observations. KR 30 shows a slightly rising spectrum with . The highest frequency point suggests that the spectrum may be flattening above 10 GHz. Finally the KR 234 radio spectrum has a shallow negative slope spectrum of . The low frequency data points for KR 234 are in good agreement but there is increased scatter at the higher frequencies. The large scatter observed in the spectra of KR 24, 178 and 234 at particular wavelengths suggests that these sources are variable. This is the likely reason that the overall spectral index for these three sources is shallower than the spectral index determined by the simultaneous CGPS observations.

There are also eight inverted spectrum point sources. Three of the sources (KR 61, 67 and 72) are associated with optical H ii regions (Sh 2-146, Sh 2-152 and Sh 2-156 respectively) and KR 138 is the compact H ii region IRAS 02044+6031. Molecular line emission at V km s-1 has been detected towards this IRAS source placing it at a kinematic distance of kpc. Unfortunately the velocity field model of Brand & Blitz (1993) is quite uncertain around this longitude () for this velocity making corrections for streaming motions problematic. Given its small angular size it it quite possible that KR 138 lies beyond the Perseus Arm. The remaining four sources have no infrared counterpart and are most likely extragalactic.
Such extragalactic radio sources with inverted spectra are interesting because of the possibility that they are Gigahertz Peaked Spectrum (GPS) sources. Astronomically these objects are of interest because they may represent an early stage in the evolution of radio galaxies (Ortega, 2006; O’Dea, 1998). Observationally these objects are defined as having a convex radio spectrum that peaks between 500 MHz and 10 GHz. The shape of the spectrum is most likely due to synchrotron self-absorption (Ortega, 2006). Below the peak frequency the average spectral index is and above the peak it is (de Vries et al., 1997).
For each of the extragalactic inverted spectrum sources we combined flux density measurements at other wavelengths from Vollmer et al. (2005) and Fich (1986) with the CGPS measurements. The spectra are shown in Figure 7. Following Marecki et al. (1999) we fit a second order polynomial of the form . This curve is not physically motivated, rather it simply allows us to easily identify sources with sufficiently high spectral curvature. Sources with have sufficient spectral curvature to be considered GPS sources.


KR 8 does appear to have a convex spectra but the data above the peak has a large amount of scatter and the curvature is not as high as one would expect for a true GPS source (). KR 125 has a very low curvature spectrum () with the curvature arising almost entirely from the highest frequency data point. Except for this point the spectrum is consistent with a rising spectrum with from 300 to 4800 MHz. KR 135 has a very steep low frequency spectral index and the cuvature of the spectrum is quite high (). Unfortunately the data above the apparent peak in the spectrum are quite scattered and its status as a GPS source is very uncertain. Finally, KR 182 shows a rising spectrum with with no signs of any spectral curvature. There is a large amount of scatter in the spectrum at both low and high frequency.

5 Flat and Inverted-spectrum point sources
The presence of extragalactic sources with both flat and inverted spectra within the KR sample led us to examine all of the CGPS second quadrant data for similar sources. To rapidly search for other point sources with flat or inverted spectra the 1420 MHz images were first convolved to the 408 MHz resolution. The brightness of the convolved 1420 MHz images were then scaled to the expected brightness at 408 MHz assuming an optically thin thermal spectrum between 408 and 1420 MHz. The true 408 images were then subtracted from the scaled images resulting in a series of difference images. Point sources with steep negative spectral indices show up as distinct negative-valued sources on the difference images thus allowing the rapid identification of flat and inverted-spectrum sources. After candidate sources were identified in this manner, flux densities were measured at 1420 and 408 MHz. Sources in the final sample had both measurable 408 flux densities (complete to mJy at 408 MHz) and no visible infrared emission in the ancillary CGPS infrared images.
Table 5 shows the resulting sample of flat-spectrum and inverted-spectrum sources. Column 1 gives the NVSS catalogue designation, columns 2-5 give the flux density and error estimates at 1420 and 408 MHz, and column 6 gives the spectral index.
| NVSS | Fν (1420) | (1420) | Fν (408) | (408) | |
|---|---|---|---|---|---|
| (mJy) | (mJy) | (mJy) | (mJy) | ||
| J054044+391612 | |||||
| J054052+372847 | |||||
| J050905+352817 | |||||
| J050920+385046 | |||||
| J051346+400618 | |||||
| J050948+395154 |
Table 5 is presented in its entirety in the electronic edition of the journal.
In order to identify potential GPS sources we examined in more detail 43 of the sources which had . As before, radio data from the compilation of Vollmer et al. (2005) were used to construct spectra over as wide a range of frequencies as possible. Of these objects eight of them were found to have a curvature of . The radio spectra of these objects are shown in Figure 8.
We also found four other objects in the sample that had rising spectra ( over the entire spectral range) combined with little scatter (see Figure 9). These sources may be examples of, relatively rare, GPS sources with a peak above 5 GHz similar to the point source 71P 52 (NVSS 213551+471022) examined by Higgs, Kerton & Knee (2001).
6 Conclusions
The KR catalogue is very useful for Galactic studies as it contains information on both compact and extended radio sources in the outer Galaxy. Unfortunately the relatively low resolution of the survey means that it overestimates the number of extended sources in the outer Galaxy. This paper updates this catalogue based primarily on new higher resolution images of the outer Galaxy at 1420 MHz obtained as part of the CGPS. We have clearly identified sources that were misclassified as extended objects and have determined which sources remain unresolved at 1-arcmin scale resolution. The simultaneous 408 MHz CGPS observations, combined with ancillary infrared data, also have allowed the nature of all of the observed KR sources to be determined with some confidence. Attention has been drawn particularly to a large number of unstudied Perseus Arm H ii regions (including the extremely large KR 1 complex), objects previously considered to be SNR candidates (e.g., KR 171), and a sample of large radio galaxies (e.g., KR 144).
In addition, through the examination of the 408 and 1420 MHz CGPS images, this study has identified a sample of flat-spectrum and inverted-spectrum extragalactic radio sources based upon their 408 and 1420 MHz flux densities. A subset of these objects was examined in more detail and a new sample of GPS sources has been compiled.
Acknowledgments
I would like to thank ISU undergraduate students Jason Murphy and Jon Patterson for their assistance on this project. The Dominion Radio Astrophysical Observatory is operated by the National Research Council of Canada. The Canadian Galactic Plane Survey is supported by a grant from Natural Science and Engineering Research Council of Canada.
References
- Brand & Blitz (1993) Brand, J., Blitz, L.,1993, A&A, 275, 67
- Cao et al. (1997) Cao, Y., Terebey, S., Prince, T. A., Beichman, C., 1997, ApJS, 111, 387
- Condon et al. (1998) Condon, J. J., Cotton, W. D., Greisen, E. W., Yin, Q. F., Perley, R. A., Taylor, G. B.,Broderick, J. J., 1998, AJ, 115, 1693
- de Vries et al. (1997) de Vries, W. H., Barthel, P. D., O’Dea, C. P., 1997, A&A, 321, 105
- Fich (1986) Fich, M., 1986, AJ, 92, 787
- Foster & Routledge (2001) Foster, T., Routledge, D., 2001, A&A, 367, 635
- Higgs, Kerton & Knee (2001) Higgs, L. A., Kerton, C. R., Knee, L. B. G., 2001, AJ, 122, 3155
- Kallas & Reich (1980) Kallas, E., Reich, W. 1980, A&AS, 42, 227
- Kerton & Martin (2000) Kerton, C. R., Martin, P. G., 2000, ApJS, 126, 85
- Landecker et al. (2000) Landecker, T. L. et al. 2000, A&AS, 145, 509
- Marecki et al. (1999) Marecki, A., Falcke, H., Niezgoda, J., Garrington, S. T., Patnaik, A. R., 1999, A&AS, 135, 273
- Masetti et al. (2004) Masetti, N. Palazzi, E. Bassani, L, Malizia, A. and Stephen, J. B. 2004, A&A, 426, 41L
- O’Dea (1998) O’Dea, C. P., 1998, PASP, 110, 493
- Ortega (2006) Ortega, A. L., 2006, PhD Thesis, Groningen
- Reich et al. (1997) Reich, P., Reich, W., Fürst, E., 1997, A&AS, 126, 413
- Röttgering et al. (1996) Röttgering, H. J. A. et al., 1996, MNRAS, 282, 1033
- Taylor et al. (2003) Taylor, A. R. et al., 2003, AJ, 125, 3145
- Trushkin (1990) Trushkin, S. A., 1990, AISAO, 32, 132
- Vollmer et al. (2005) Vollmer, B., Davoust, E., Dubois, P., Genova, F., Ochsenbein, F., van Driel, W., 2005, A&A, 431, 1187