The IC1396N proto-cluster at a scale of 250 AU ††thanks: Based on observations obtained at the IRAM Plateau de Bure Interferometer (PdBI). IRAM is funded by the Centre Nationale de la Recherche Scientifique (France), the Max-Planck Gesellschaft (Germany), and the Instituto Geográfico Nacional (Spain).
Abstract
Aims. We investigate the mm-morphology of IC 1396 N with unprecedented spatial resolution to analyze its dust and molecular gas properties, and draw comparisons with objects of similar mass.
Methods. We have carried out sensitive observations in the most extended configurations of the IRAM Plateau de Bure interferometer, to map the thermal dust emission at 3.3 and 1.3mm, and the emission from the =1312k hyperfine transitions of methyl cyanide (CH3CN).
Results. We unveil the existence of a sub-cluster of hot cores in IC 1396 N, distributed in a direction perpendicular to the emanating outflow. The cores are embedded in a common envelope of extended and diffuse dust emission. We find striking differences in the dust properties of the cores ( 0) and the surrounding envelope ( 1), very likely testifying to differences in the formation and processing of dust material. The CH3CN emission peaks towards the most massive hot core and is marginally extended in the outflow direction.
Key Words.:
ISM: individual objects: IC 1396 N – ISM: stars: formation1 Introduction
Intermediate-mass young stellar objects (IMs) (protostars and Herbig Ae/Be stars with M⋆ 210 M⊙) are crucial to star formation studies because they provide the link between evolutionary scenarios of low- and high-mass stars. These objects share many similarities with high-mass stars (clustering, PDRs). However, to study them presents decided advantages, compared to massive star forming regions, as many of them are located close to the Sun (1 kpc) and in regions of reduced complexity.
The lack of spatial resolution is always a potential source of confusion in the identification of isolated stellar structures. This issue becomes increasingly important in the case of low-mass and intermediate-mass stars, which are predisposed to form in clusters. While much is now known about isolated star formation, the onset of cluster formation remains less clear and systematic surveys are needed to gain a deeper understanding (Testi et al. 2000). Aperture synthesis in the millimeter range provides excellent means to investigate and characterize the earliest stellar clustering.
In this Letter, we present interferometric continuum and molecular line observations of the IM protostar IC 1396 N at the highest spatial resolution of the PdBI (Karastergiou et al. 2006). IC 1396 N is a 440 L⊙ (Sugitani et al. 2000) protostar located at a distance of 750 pc (Matthews 1979). Classified as a Class 0 / I borderline source, this young protostar is associated with a very energetic bipolar outflow (Codella et al. 2001). In addition, near-infrared images by Nisini et al. (2001) have revealed the presence of a collimated jet. Thus far, it is one of the best studied Class 0 / I intermediate-mass sources.
2 Observations
We used the six-element IRAM Plateau de Bure Interferometer to observe IC 1396 N simultaneously in three hyperfine transitions of CH3CN (=1312) at 239.064 GHz, in the A- and E-state transitions of CH3OCHO (=76) and (=87) at 90.188 GHz, and in the continuum at 1.3mm and 3.3mm. Observations were made in configuration A (January 27, 2005), new A (February 12, 2006) and in a non-standard configuration (March 22, 2006) in conditions of excellent atmospheric seeing (0.30.5′′ FWHM) and good atmospheric transparency (pwv = 14 mm). The spectral correlator was adjusted to observe the line transitions with a velocity resolution of 0.3 km s-1 and to cover the entire RF passbands (580 MHz) for highest continuum sensitivity. The overall flux density scales for each epoch and for each frequency band were set by comparison to the known flux densities of MWC349 and 3C273 and estimated to be accurate to 10% at 3.3mm and 20% at 1.3mm. The resulting line and continuum point source sensitivities were estimated to 8.4 mJy (2.5 MHz) and 0.43 mJy at 237.571 GHz, and to 2.5 mJy (2.5 MHz) and 0.12 mJy at 90.250 GHz. The corresponding synthesized beams adopting uniform weighting were 0.45 at PA=° and 1.2 at PA=°. The data were calibrated, mapped and analyzed in the GILDAS software package.
| 3.3mm (90.3 GHz) | BIMA 3 | ————————– BIMA 2 ————————– | |||
|---|---|---|---|---|---|
| Cocoon | 41.86+11.9 | 41.73+12.8 | 41.73+14.3 | ||
| (J2000) | 21h40m4284 | 21h40m4186 | 21h40m4185 | 21h40m4173 | 21h40m4172 |
| (J2000) | 58°16′014 | 58°16′132 | 58°16′119 | 58°16′128 | 58°16′143 |
| Size () | |||||
| S (mJy) | 8 | 16 | 5.9 | 1.5 | 2.7 |
| 1.3mm (237.6 GHz) | BIMA 3 | ————————– BIMA 2 ————————– | |||
| Cocoon | 41.86+11.9 | 41.73+12.8 | 41.73+14.3 | ||
| (J2000) | 21h40m4284 | 21h40m4185 | 21h40m4186 | 21h40m4173 | 21h40m4173 |
| (J2000) | 58°16′014 | 58°16′131 | 58°16′119 | 58°16′128 | 58°16′143 |
| Size () | |||||
| S (mJy) | 30 | 245 | 35 | 6 | 10 |
| BIMA 3 | ————————– BIMA 2 ————————– | ||||
| Cocoon | 41.86+11.9 | 41.73+12.8 | 41.73+14.3 | ||
| Mean Spec.Index | 1.4 | 1.9 | |||
| Spec.Index () | 1.4 | 2.8 | 1.9 | 1.5 | 1.4 |
| Mass (M⊙)a | 0.05 | 0.4 | 0.06 | 0.01 | 0.01 |
| 0.8 | |||||
a masses have to be scaled up by a factor of 6 for a dust temperature of 20 K.
3 Continuum data
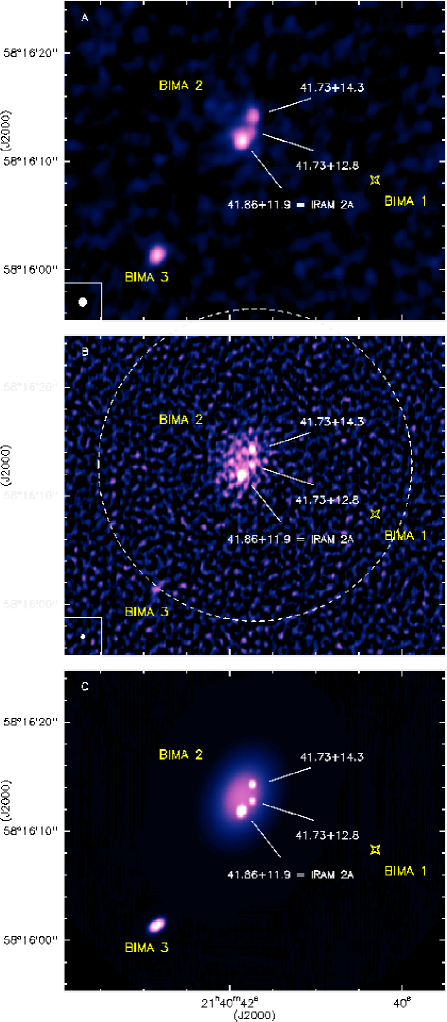
Figures 1a and 1b show the continuum images obtained from the visibility data in the two frequency bands. The high sensitivity and the striking similarity of the many morphological features in the two figures, clearly testify to the presence of at least three bright continuum emission cores in the center of IC 1396 N, all three very likely associated with the centrally peaked dust emission source identified as BIMA 2 by Beltrán et al. (2002). While the two weaker cores were not resolved by the interferometer, the primary core IRAM 2A is resolved in the 1.3mm emission to an elliptical region of 300 AU AU. This corresponds to the size of the solar-system, and may be an accretion disk surrounding the powering source of the bipolar outflows mapped by Beltrán et al. (2004) in various molecular transitions. The bulk of the mm-emission, however, is emerging from a much larger region centered on the triple system and oriented almost perpendicular to the molecular outflows (see Beltrán et al. 2002). This oval-shaped region whose extent (2800 AU) is very much the same at both observing frequencies, provides about 50% of the 1.3mm flux density detected at the JCMT (Saraceno et al. 1996).
According to these results, we consider two different models for the continuum emission: a large volume of cold dust (resolved out by the PdBI) that surrounds (a) an envelope with sharp boundaries in which the three compact cores are embedded, (b) a confined region harboring multiple lower brightness cores from which we have detected the three most intense. Though the lack of sensitivity to large scale emission and emission distributed over a large number of cores makes it difficult to argue against one or the other model, we favor the former, more simple model of the dusty ‘cocoon’ at the border of which the three intense cores are embedded. We obtain excellent results by fitting such a model at 3.3mm and 1.3mm, which strengthens the ‘cocoon+cores’ interpretation for the protostellar region associated with BIMA 2. The fitted parameters of our model and the corresponding model image are shown in Table 1 and Figure 1 (bottom). We cannot, however, totally discard the possibility of the existence of a relatively homogeneous cluster of lower mass cores surrounding the three bright cores detected.
In addition to the intense clump BIMA 2, Beltrán et al. (2002) detected two clumps in continuum emission, BIMA 1 and BIMA 3. In spite of the much higher sensitivity of the observations presented here, BIMA 1, the clump in the south-west of BIMA 2, was not detected in the 3.3mm continuum image. It is likely that the interferometer resolved out extended () low brightness continuum emission from this source. BIMA 3, the radio-bright source in the south-east of BIMA 2, is detected at the edge of our continuum images. The continuum emission towards BIMA 3 can be interpreted as compact emission emerging from a region 450 AU in size, embedded in a larger cloud of warm and dense dust and resolved out by the interferometer, accounting for about 70% of the continuum emission losses at 1.3mm.
3.1 Spectral Indices and Masses
In Table 1 we present the primary beam corrected flux densities, sizes and spectral indices derived by fitting our model to the visibilities in the uv-plane. The spectral indices range from 2.8 for the cocoon to 1.4–1.9 for the compact cores. While the spectral index for the cocoon is consistent with optically thin dust emission with , the value measured towards any of the compact cores is very low ().
Different explanations may account for the low spectral index measured towards the compact cores. One possibility is that the flux densities are a mix of dust and free-free emission. Beltrán et al. (2002) reported VLA continuum flux densities at 3.6cm and upper limits at 12cm for BIMA 2 and BIMA 3. Since BIMA 2 presents a complex structure at the high angular resolution of our observations, we compare the flux densities at centimeter and millimeter wavelengths in BIMA 3 only. We have extrapolated the emission at 3.6cm to millimeter wavelengths assuming the spectral index of an isotropic ionized wind () and subtracted it from the PdBI flux densities. The resulting values were then fitted assuming optically thin dust emission. The ratio between the 1.3mm and 3.3mm emission can then only be fitted if we assume a spectral index of for the dust opacity. One possibility is that the dust emission is optically thick, which is, however, not consistent with the measured flux densities. With cm-2g-1, a gas and dust mass of 1.1 M⊙ is needed to yield opacities 1 in BIMA 3. A moderately warm core (Tdust50 K) of 1.1 M⊙ would emit a flux density of 300 mJy at 1.3mm, i.e. a factor of 10 more than observed. Although our observations are not consistent with an optically thick core of 450 AU, and despite a relatively low surface brightness temperature (4 K) at 1.3mm, we cannot discard the possibility that part of the core is optically thick. Clearly, an optically thick region would contribute to a lower value of the spectral index.
Another possibility is to assume a different distribution of grain type in the compact cores and in the surrounding cocoon. Low values of (0-0.5) are found in circumstellar disks around Herbig Ae and Be stars (Natta et al. 2004, 2007; Fuente et al. 2003, 2006) and have been interpreted as evidence of grain growth. According to this interpretation, the differences in the spectral index we measure in the cocoon and in the compact sources could hint at differences in the grain properties at different spatial scales. These call for a scenario in which the compact components are circumstellar disks embedded in a dust-enshrouded enviroment. Similar differences in the spectral index between the envelope and the compact components of Class 0 sources were reported by Jørgensen et al. (2007).
To derive mass estimates for the different components (see Table 1), we have assumed a dust temperature of 100 K for the cocoon and the cores. Although the dust grain properties are very likely to be different, we have based our mass estimates on a uniform dust emissivity index cm-2g-1. All the compact cores have masses much lower than one solar mass, possibly suggesting that the PdBI has resolved out a large fraction of the envelope. We can compare the mass of the cores with those derived towards hot corinos and intermediate mass hot cores. After correcting for the distance, the 1.3mm flux density towards IRAM 2A is a factor of 34 larger than the one measured towards the hot corinos IRAS 16293–2422 A/B (Bottinelli et al. 2004a) and testifies to the presence of a more massive star. However, IRAM 2A is 10 weaker than the intermediate mass hot core NGC 7129–FIRS 2 suggesting that IRAM 2A is less massive, although both protostars are located at about the same distance. Despite the fact that IC 1396 N has a luminosity similar to NGC 7129–FIRS 2, the envelopes surrounding these stars very likely correspond to very different star formation regimes. While NGC 7129–FIRS 2 at prima facie hosts a single massive core (pending higher resolution observations), IC 1396 N definitely hosts a cluster of lower mass stars. We argue that the most massive component of the IC 1396 N cluster is very likely the precursor of a Herbig Ae star.
4 Molecular line data: CH3CN
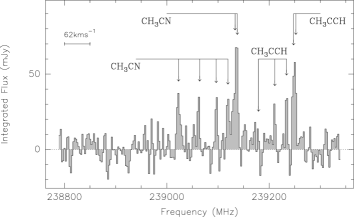
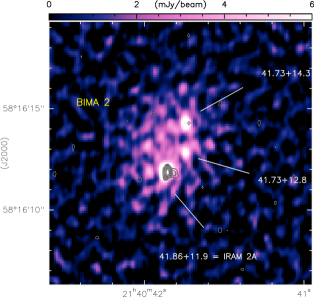
CH3CN (13k12k) line emission has only been detected towards IRAM 2A, the most massive core in the IC 1396 N proto-cluster. In addition to the CH3CN lines, several CH3C2H lines appear in the spectrum testifying to the presence of a core, rich in complex molecules (see Fig. 2). The integrated intensity map of the CH3CN (13k12k) transition shows that the emission arises in a region of radius 0.8′′ (600 AU) around the massive hot core IRAM 2A and with a good positional coincidence between line and 1.3mm continuum emission.
Comparing the integrated emission with the peak flux density, we estimate that 50% of the emission is coming from a compact region (radius 150 AU) around the hot core while the remaining 50% arises from a more extended and cooler component in the immediate vicinity. Bottinelli et al. (2007) report about a similar case in NGC1333 IRAS 4A. Although the attained sensitivity is not deep enough to draw firm conclusions on the small-scale spatial distribution of the CH3CN emission, the shape of the emission suggests that CH3CN is tracing the signature of gas and dust in the hot core and possibly arises from a narrow boundary layer at the outflow-core interface. The marginal or non-detection of CH3CN towards the weaker cores is possibly subject to the same sensitivity limitation.
We have tried to fit the rotational diagram of the CH3CN (13k12k) transition towards the emission peak. The K-ladder cannot be fitted with a single rotational temperature suggesting that the CH3CN emission is optically thick in the hot core. Also, we cannot exclude that some K-components are blended with other lines. Given all the uncertainties, we derive a CH3CN abundance using the temperature inferred from the rotational diagram. We obtain a rotational temperature of 240150 K and (CH3CN) cm-2 towards the peak, which implies a CH3CN abundance of 2 10-10. This abundance is similar to the ones determined by Bottinelli et al. (2004b) in the hot corinos NGC1333 IRAS 4A and IRAS 16293–2422 but a factor of 10 lower than the one measured by Fuente et al. (2005) towards NGC 7129–FIRS 2. This low abundance of CH3CN also argues in favor of IC 1396 N being a cluster of low / intermediate mass stars.
5 Summary
We report on interferometric 3mm and 1.3mm continuum and CH3CN (13k12k) line observations of the intermediate-mass protostar IC 1396 N in the most extended configuration of the PdBI. Our observations provide a spatial resolution of 250 AU at the distance of IC 1396 N and reveal the existence of a cluster of cores in this IM protostar with unprecedented detail and quality. The cluster in the interior of IC 1396 N comprises at least three cores, the very likely precursors of two low-mass and an IM star. Because of sensitivity limitations, we cannot exclude the presence of further low brightness cores in the BIMA 2 region. Our continuum observations also show that the spectral index at millimeter wavelenghts changes with the spatial scales traced by the interferometer. The variations in the spectral index are very likely driven by grain properties changing with gas density and by the existence of compact regions in the hot cores with optically thick emission.
CH3CN (1312) line emission has only been detected towards the most massive core IRAM 2A, but our sensitivity limit is not low enough to infer a different abundance in the other cores. The CH3CN emission is slightly more extended than the associated dust emission and possibly arises from a region heated up by the molecular outflow.
Acknowledgements.
We would like to thank the referee for her/his constructive remarks. A.F. is grateful for support from the Spanish Ministerio de Educación y Ciencia (MEC) and FEDER funds under grant ESP 2003-04957, and from the Secretaría de Estado de Política Científica y Tecnológica/MEC under grant AYA 2003-07584.References
- Beltrán et al. (2002) Beltrán, M. T., Girart, J. M., Estalella, R. et al. 2002, ApJ, 573, 246
- Bottinelli et al. (2004a) Bottinelli, S., Ceccarelli, C., Lefloch B. et al. 2004a, ApJ, 615, 354
- Bottinelli et al. (2004b) Bottinelli, S., Ceccarelli., C., Neri R. et al. 2004b, ApJ, 617, L69
- Bottinelli et al. (2007) Bottinelli, S., Ceccarelli, C., Neri, R., Williams J. 2007, submitted to ApJ
- Cazaux et al. (2003) Cazaux, S., Tielens, A. G. G. M., Ceccarelli C. et al. 2003, ApJ, 593, L51
- Codella et al. (2001) Codella, C., Bachiller, R., Nisini, B. et al. 2001, A&A, 376, 271
- Fuente et al. (2003) Fuente, A., Rodríguez-Franco, A., Testi, L. et al. 2003, ApJ, 598, L39
- Fuente et al. (2005) Fuente, A., Neri, R., Caselli, P. 2005, A&A, 444, 481
- Fuente et al. (2006) Fuente, A., Alonso-Albi, T., Bachiller, R. et al. 2006, ApJ, 649, L119
- Joergensen (2007) Jørgensen, J.K., Bourke, T.L., Myers, P.C. et al. 2007, ApJ, 659, 479
- Karastergiou (2006) Karastergiou, A., Neri, R., Gurwell, M.A. 2006, ApJS, 164, 552
- (12) Matthews, H. I. 1979, A&A, 75, 345
- Natta et al. (2004) Natta, A., Testi, L., Neri, R., Shepherd, D.S., Wilner, D. 2004, A&A, 416, 179
- Natta et al. (2007) Natta, A., Testi, L., Calvet, N. et al. 2007, Protostars and Planets V, 767
- Nisini et al. (2001) Nisini, B., Massi, F., Vitali, F. et al. 2001, A&A, 376, 553
- Saraceno et al. (1996) Saraceno, P., Ceccarelli, C.; Clegg, P. et al. 1996, A&A, 315, L293
- Sugitani et al. (2000) Sugitani, K., Matsuo, H., Nakano, M. et al. 2000, AJ, 119, 323
- Testi et al. (2000) Testi, L., Palla, F., Natta, A. 2000, Proceedings from ASP Conference, 198, 211