Electronic band structure and optical properties of zinc monochalcogenides with zinc-blende- and wurtzite-type structures were studied using the ab initio density functional method within the LDA, GGA, and LDA+ approaches. Calculations of the optical spectra have been performed for the energy range 0–20 eV, with and without including spin-orbit coupling. Reflectivity, absorption and extinction coefficients, and refractive index have been computed from the imaginary part of the dielectric function using the Kramers–Kronig transformations. A rigid shift of the calculated optical spectra is found to provide a good first approximation to reproduce experimental observations for almost all the zinc monochalcogenide phases considered. By inspection of the calculated and experimentally determined band-gap values for the zinc monochalcogenide series, the band gap of ZnO with zinc-blende structure has been estimated.
Electronic structure and optical properties of Zn (=O, S, Se, Te)
pacs:
71.15.-m; 71.22.+iI Introduction
The zinc monochalcogenides (Zn; = O, S, Se, and Te) are the prototype II–VI semiconductors. These compounds are reported to crystallize in the zinc-blende(-z) and wurtzite (w) type structures. The Zn-z phases are optically isotropic, while the Zn-w phases are anisotropic with as the polar axis. Zn phases are primary candidate for optical device technology such as visual displays, high-density optical memories, transparent conductors, solid-state laser devices, photodetectors, solar cells etc. So, knowledge about optical properties of these materials is especially important in the design and analysis of Zn-based optoelectronic devices.
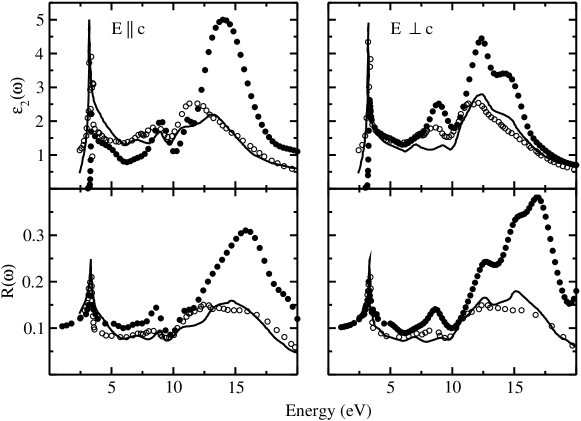
Optical parameters for some of the Zn phases have widely been studied experimentally in the past. Detailed information on this subject is available for ZnO-w,Yoshikawa and Adachi (1997); Postava et al. (2000, 2001); Washington et al. (2000); Muth et al. (1999); Srikant and Clarke (1998); Hengehold et al. (1970); Klucker et al. (1971); Freeouf (1973) ZnS-w,Freeouf (1973) ZnS-z,Freeouf (1973); Cardona and Haensel (1970); Cardona and Harbeke (1965) ZnSe-z,Freeouf (1973); Cardona and Haensel (1970) and ZnTe-z,Freeouf (1973); Cardona and Haensel (1970); Merad et al. (2005); Cardona and Greenaway (1963) see the systematized survey in Ref. Adachi, 1999. However, there are no experimental data on optical properties of ZnSe-w, ZnTe-w, and ZnO-z. Furthermore, there is lack of consistency between some of the experimental values for the optical spectra. This is demonstrated in Fig. 1, which displays reflectivity spectra for ZnO-w measured at T=300 K by three different groups. Dielectric response functions were calculated using the Kramers-Kronig relation. As is seen in Fig. 1, intensity of the imaginary part of the dielectric function () and reflectivity () corresponding to the fundamental absorption edge of ZnO-w are higherKlucker et al. (1971) than those at the energy range 10–15 eV, while in Ref. Adachi, 1999 it is vice verse. The optical spectra in Fig. 1 measured using the linearly polarized incident light for electric field () parallel and perpendicular to the -axes are somehow close to those of Ref. Hengehold et al., 1970 using non-polarized incident light.
Using the experimental reflectivity data, a full set of optical spectra for ZnO have been calculatedSobolev and Sobolev (2003) for the wide energy range 0–26 eV. Density-functional theory (DFT)Hohenberg and Kohn (1964) in the local-density approximation (LDA)Kohn and Sham (1965) has also been used to calculate optical spectra for ZnO-wXu and Ching (1993) and ZnS-wXu and Ching (1993) by linear combination of atomic orbitals, and for ZnS-zWang and Klein (1981) and ZnSe-zWang and Klein (1981) by self-consistent linear combination of Gaussian orbitals. The optical spectra of ZnO (including excitons) has been investigatedLaskowski and Christensen (2006) by solving the Bethe–Salpeter equation. Band-structure studies have been performed by linearized augmented plane-wave method plus local orbitals (LAPW+LO) within the generalized gradient and LDA with the multiorbital mean-field Hubbard potential (LDA+) approximations. The latter approximation is found to correct not only the energy location of the Zn-3 electrons and associated band parameters (see also Refs. Karazhanov et al., 2006a and Karazhanov et al., 2006b), but also to improve the optical response. Despite the shortcoming of DFT in relation to underestimation of band gaps, the locations of the major peaks in the calculated energy dependence of the optical spectra are found to be in good agreement with experimental data.
It should be noted that the error in calculation of the band gap by DFT within LDA and generalized-gradient approximation (GGA) is more severe in semiconductors with strong Coulomb correlation effects than in other solids.Anisimov et al. (1993); Dudarev et al. (1998); Bengone et al. (2000); Karazhanov et al. (2006a, b) This is due to the mean-field character of the Kohn–Sham equations and the poor description of the strong Coulomb correlation and exchange interaction between electrons in narrow bands (viz. the potential ). Not only the band gap (), but also the crystal-field (CF) and spin-orbit (SO) splitting energies ( and ), the order of states at the top of the valence band (VB), the location of the Zn-3 band and its width, and the band dispersion are foundLambrecht et al. (2002); Voon et al. (1996a); Karazhanov et al. (2006a, b) to be incorrect for ZnO-w by the ab initio full potential (FP) and atomic-sphere-approximation (ASA) linear muffin-tin orbital (LMTO) methods within the pure LDA,Lambrecht et al. (2002); Voon et al. (1996a) and by the projector–augmented wave (PAW) method within LDA and GGA.Karazhanov et al. (2006a, b) These findings were ascribedKarazhanov et al. (2006a, b) to strong Coulomb correlation effects. DFT calculations within LDA plus self-interaction correction (LDA+) and LDA+ are foundLambrecht et al. (2002); Karazhanov et al. (2006a, b) to rectify the errors related to and , order of states at the top VB, width and location of the Zn 3 band, as well as effective masses. In other semiconductors, in which the Coulomb correlation is not sufficiently strong, the and values derived from DFT calculations within LDA are found to be quite accurate. This was demonstrated for diamond-like group IV, z-type group III–V, II–VI, and I–VII semiconductors,Carrier and Wei (2004) w-type AlN, GaN, and InN Wei and Zunger (1996) using the LAPW and VASP-PAW, the w-type CdS and CdSe, Voon et al. (1996a) z-type ZnSe, CdTe, HgTe,Willatzen et al. (1995) using the ab initio LMTO-ASA, z- and w-type ZnSe and ZnTeKarazhanov et al. (2006a, b) as well as z-type CdTe Lalitha et al. (2006) using the VASP-PAW and FP LMTO methods. Although the SO splitting at the top of VB is known to play an important role in electronic structure, and chemical bonding of semiconductors Carrier and Wei (2004); Bader (1990); Wei and Zunger (1996); Willatzen et al. (1995); Cardona et al. (1995); Lambrecht et al. (2002); Karazhanov et al. (2006a, b) there is no systematic study of the role of the SO coupling in optical properties of these materials.
Several attempts have been undertaken to resolve the DFT eigenvalue problem. One such approach is utilization of the GW approximation (“G” stands for one-particle Green’s function as derived from many-body perturbation theory and “W” for Coulomb screened interactions). Although GW removes most of the problems of LDA with regard to excited state properties, it fails to describe the semiconductors with strong Coulomb correlation effects. For example, two studies of the band gap of ZnO calculated using the GW correction underestimated Eg by Usuda et al. (2002) and overestimated it by .Oshikiri and Aryasetiawan (2000) Calculations for Zn, Cd, and Hg monochalcogenides by the GW approach showedFleszar and Hanke (2005) that the band-gap underestimation is in the range 0.3–0.6 eV. Combination of exact-exchange (EXX) DFT calculations and the optimized-effective GW potential approach is foundRinke et al. (2005) to improve the agreement with the experimental band gaps and Zn-3 energy levels. Band gaps calculated within the EXX treatment are found to be in good agreement with experiment for the - semiconductors.Städele et al. (1999); Sharma et al. (2005) Excellent agreement with experimental data was obtainedSharma et al. (2005) also for locations of energy levels of the bands of a number of semiconductors and insulators such as Ge, GaAs, CdS, Si, ZnS, C, BN, Ne, Ar, Kr, and Xe.
Another means to correct the DFT eigenvalue error is to use the screened-exchange LDA.Asahi et al. (1999) Compared to LDA and GW, this approximation is found to be computationally much less demanding, permitting self-consistent determination of the ground-state properties, and giving more correct band gaps and optical properties. Other considered approaches for ab initio computations of optical properties involve electron–hole interaction,Benedict et al. (1998) partial inclusion of dynamical vertex corrections that neglect excitons,Bechsted et al. (1997) and empirical energy-dependent self-energy correction according to the Kohn–Sham local density theory of excitation.Wang and Klein (1981) However, the simplest method is to apply the scissor operator,Baraff and Schlüter (1984) which displaces the LDA eigenvalues for the unoccupied states by a rigid energy shift. Using the latter method excellent agreement with experiments has been demonstrated for lead monochalcogenidesDelin et al. (1998) and ferroelectric NaNO2.Ravindran et al. (1999a) However, the question as to whether the rigid energy shift is generally applicable to semiconductors with strong Coulomb correlation effects is open.
In this work electronic structure and optical properties of the Zn-w and -z phases have been studied in the energy range from 0 to 20 eV based on first-principles band structures calculations derived from DFT within the LDA, GGA, and LDA+.
II Computational details
Experimentally determined lattice parameters have been used in the present ab initio calculations (Table 1). The ideal positional parameter for Zn-w is calculated on the assumption of equal nearest-neighbor bond lengths:Voon et al. (1996a)
| (1) |
The values of for the ideal case agree well with the experimental values (see Table 1). Self-consistent calculations were performed using a mesh according to the Monkhorst–Pack scheme for the Zn-z phases, and the -centered grid for the Zn-w phases.
| Phase | a, (Å) | (Å) | (Å3) | (eV) | (eV) | ||
|---|---|---|---|---|---|---|---|
| ZnO-w111Ref. ICS, 2001 | 3.244(3.250) | 5.027(5.207) | =45.82(47.62) | 0.383 | 0.380 | 9 | 1 |
| ZnS-w222Ref. Weber, 1986; Xu and Ching, 1993 | 3.854(3.811) | 6.305(6.234) | =81.11(78.41) | 0.375 | 0.375 | 6 | 1 |
| ZnSe-w333Ref. ICS, 2001; Zakharov et al., 1994 | 4.043(3.996) | 6.703(6.626) | =94.88(91.63) | 0.375 | 0.371 | 8 | 1 |
| ZnTe-w444Ref. Lakshmi et al., 2003; Tomashik et al., 1978 | 4.366(4.320) | 7.176(7.100) | =118.47(114.75) | 0.375 | 0.373 | 7 | 1 |
| ZnO-z555Ref. Bragg and Darbyshire, 1954 | 4.633(4.620) | =99.45(98.61) | 8 | 1 | |||
| ZnS-z666Ref. Hellwege and Madelung, 1982; Weast et al., 1990 | 5.451(5.409) | =161.99(158.25) | 9 | 1 | |||
| ZnSe-z777Ref. ICS, 2001 | 5.743(5.662) | =189.45(181.51) | 8 | 1 | |||
| ZnTe-z888Ref. Agrawal et al., 1994; Weast et al., 1990 | 6.187(6.101) | =236.79(227.09) | 8 | 1 |
II.1 Calculations by VASP package
Optical spectra have been studied based on the band-structure data obtained from the VASP-PAW package,Kresse and Furthmüller (1996) which solves the Kohn–Sham eigenvalues in the framework of the DFTHohenberg and Kohn (1964) within LDA,Kohn and Sham (1965) GGA,Perdew et al. (1996) and the simplified rotationally invariant LDA+.Anisimov et al. (1993); Dudarev et al. (1998) The exchange and correlation energy per electron have been described by the Perdew and Zunger parametrizationPerdew and Zunger (1981) of the quantum Monte Carlo results of Ceperley and Alder.Ceperley and Alder (1980) The interaction between electrons and atomic cores is described by means of non-norm-conserving pseudopotentials implemented in the VASP package.Kresse and Furthmüller (1996) The pseudopotentials are generated in accordance with the projector-augmented wave (PAW)Blöchl (1994); Kresse and Joubert (1999) method. The use of the PAW pseudopotentials addresses the problem of inadequate description of the wave functions in the core region (common to other pseudopotential approachesAdolph et al. (2001)) and its application allows us to construct orthonormalized all-electron-like wave functions for Zn 3 and 4, and and valence electrons of the atoms under consideration. LDA and GGA pseudopotentials have been used and the completely filled semicore Zn-3 shell has been considered as valence states.
It is well known that DFT calculations within LDA and GGA locate the Zn-3 band inappropriately close to the topmost VB, hybridizing with the O- band, falsifies the band dispersion, and reduces the band gap. Nowadays the problem is known to be solved by using the LDA+ and LDA+.Lambrecht et al. (2002); Vogel et al. (1995); Dong et al. (2004); Janotti and Van de Walle (2006); Karazhanov et al. (2006a, b) For the DFT calculations within LDA+ explicit values of the parameters and are required as input. In previous papersKarazhanov et al. (2006a, b) we have estimated the values of the and parameters within the constrained DFT theoryPickett et al. (1998) and in a semiempirical way by performing the calculations for different values of and forcing match to the experimentally establishedRuckh et al. (1994) location of the Zn-3 bands. Based on the resultsKarazhanov et al. (2006a, b) the values of the parameters and listed in Table 1 are chosen to study optical spectra.
II.2 Calculations by MindLab package
For investigation of the role of the SO coupling in electronic structure and optical properties of Zn, DFT calculations have been performed using the MindLab package,Savrasov (1996) which uses the full potential linear muffin-tin orbital (FP LMTO) method. For the core charge density, the frozen core approximation is used. The calculations are based on LDA with the exchange-correlation potential parametrized according to Gunnarsson–LundquistGunnarsson and Lundqvist (1976) and Vosko-Wilk-Nussair.Vosko et al. (1980) The base geometry in this computational method consists of a muffin-tin part and an interstitial part. The basis set is comprised of linear muffin-tin orbitals. Inside the muffin-tin spheres the basis functions, charge density, and potential are expanded in symmetry-adapted spherical harmonic functions together with a radial function and a Fourier series in the interstitial.
II.3 Calculation of optical properties
From the DFT calculations the imaginary part of the dielectric function has been derived by summing transitions from occupied to unoccupied states for energies much larger than those of the phonons:
| (2) | |||||
Here is the momentum operator, the Fermi distribution, and the crystal wave function corresponding to the energy with momentum . Since the Zn-w phases are optically anisotropic, components of the dielectric function corresponding to the electric field parallel () and perpendicular () to the crystallographic axis have been considered. The Zn-z phases are isotropic, consequently, only one component of the dielectric function has to be analyzed.
The real part of the dielectric function is calculated using the Kramer–Kronig transformation. The knowledge of both the real and imaginary parts of the dielectric tensor allows one to calculate other important optical spectra. In this paper we present and analyze the reflectivity , the absorption coefficient , the refractive index , and the extinction coefficient :
| (3) | |||||
| (4) | |||||
| (5) | |||||
| (6) |
Here is the complex dielectric function. The calculated optical spectra yield unbroadened functions, and consequently have more structure than the experimental ones.Ravindran et al. (1997); Ravindran et al. (1999b, a); Delin et al. (1998) To facilitate a comparison with the experimental findings, the calculated imaginary part of the dielectric function has been broadened. The exact form of the broadening function is unknown. However, analysis of the available experimentally measured optical spectra of Zn shows that the broadening usually increases with increasing excitation energy. Also, the instrumental resolution smears out many fine features. These features have been modelled using the lifetime broadening technique by convoluting the imaginary part of the dielectric function with a Lorentzian with a full width at half maximum of 0.002 eV and increasing quadratically with the photon energy. The experimental resolution was simulated by broadening the final spectra with a Gaussian, where the FWHM is equal to 0.08 eV.
III Results and discussion
III.1 Band structure
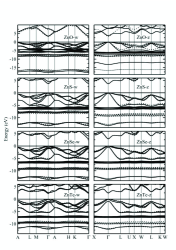
The optical spectra are related to band dispersion and probabilities of interband optical transitions. So, it is of interest to analyze the electronic structure in detail. Band dispersions for Zn-w and Zn-z calculated by DFT within LDA and LDA+ are presented in Fig. 2. The general features of the band dispersions are in agrement with previous studies (see, e.g., Refs. Lambrecht et al., 2002; Vogel et al., 1995, and Vogel et al., 1996). It is seen from Fig. 2 that the CB minimum for Zn-w and Zn-z are much more dispersive than the VB maximum, which shows that the holes are much heavier than the CB electrons in agreement with experimental dataMadelung (1992); Hümmer (1973) for the effective masses and calculated with FP LMTO,Lambrecht et al. (2002) LCAO,Xu and Ching (1993) as well as our findings.Karazhanov et al. (2006a, a) Consequently, mobility of electrons is higher than that of holes. Furthermore, these features indicate that electrons of (that form the topmost VB states) are tightly bound to their atoms, and make the VB holes less mobile. Hence, the contribution of the holes to the conductivity is expected to be smaller than that of CB electrons even though the concentration of the latter is smaller than that of the former. These features emphasize the predominant ionic nature of the chemical bonding. Another interesting feature of the band structures is that the VB maximum becomes more dispersive with increasing atomic number of from O to Te.
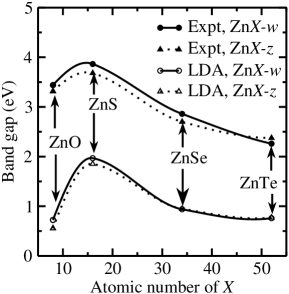
As noted in our previous contributions,Karazhanov et al. (2006a, b) the band gaps of Zn calculated by DFT within LDA, GGA, and LDA+ are underestimated and the question as to whether it is possible to shift the CB states rigidly was kept open. As found from the optical spectra discussed on the following sections, rigid shifts of the CB states up to the experimentally determined locations can provide a good first approximation for the stipulation of the band gap. So, for the band dispersions in Fig. 2, we have made use of this simple way for correcting the band gaps calculated by DFT. The only problem in this respect was the lack of an experimental band-gap value for ZnO-z. To solve this problem, the experimentally and calculated (by DFT within LDA) band gaps () of the Zn series were plotted as a function of the atomic number of . As seen from Fig. 3, for the Zn-w phases are very close to the corresponding values for the Zn-z phases and the shape of the experimental and calculated functional dependencies are in conformity. On this basis the band gap of ZnO-z is estimated by extrapolating the findings for Zn-z from ZnS-z to ZnO-z. This procedure gave eV for ZnO-z.
It is well-known that not only band gaps are underestimated within LDA and GGA, but also band dispersions come out incorrectly, whereas location of energy levels of the Zn-3 electrons are overestimated (see, e.g., Refs. Laskowski and Christensen, 2006; Karazhanov et al., 2006a, b, and Dong et al., 2004). As also seen from Fig. 2, calculations within the LDA+ approach somewhat correct the location of the energy levels of the Zn-3 electrons. The elucidation of the eigenvalue problem and the order of states at the topmost VB from LDA, GGA, and LDA+ calculations are discussed in Refs. Laskowski and Christensen, 2006; Karazhanov et al., 2006a, b and Lambrecht et al., 2002 will not be repeated here.
Examination of Fig. 2 shows that the VB comprises three regions of bands: first a lower region consists of bands of Zn and , a higher lying region where well localized Zn-3 bands, and on top of this a broader band dispersion originating from - states hybridized with Zn-3 states. The latter sub-band is more pronounced in ZnO than in the other Zn phases considered. The hybridization is most severe according to the LDA and GGA calculations, whereas the LDA+ calculations somehow suppress this and improve the band gap underestimation. A more detailed discussion of these aspects is found in Refs. Karazhanov et al., 2006a and Karazhanov et al., 2006b.
The SO splitting at the topmost VB is known to play an important role for the electronic structure and chemical bonding of solids.Carrier and Wei (2004); Bader (1990); Wei and Zunger (1996) In semiconductors with z-type structure the SO splitting energy is determined as the difference between energies of the topmost VB states with symmetry and .Carrier and Wei (2004); Bader (1990); Wei and Zunger (1996) In the w-type compounds the topmost VB is split not only by SO interaction, but also by CF giving rise to three states at the Brillouin-zone center. To calculate the SO splitting energy for w-type phases quasi-cubic model of Hopfield Hopfield (1960) is commonly used.
It is well known that the SO splitting energy derived from ab initio calculations agree well with experimental data only for some of the semiconductors. This is demonstrated, for example, for all diamond-like group IV and z-type group III–V, II–VI, and I–VII semiconductors,Carrier and Wei (2004) w-type AlN, GaN, and InN,Wei and Zunger (1996) Zn-w and -z (=S, Se, and Te),Karazhanov et al. (2006a, b) and CdTe.Lalitha et al. (2006) However, the errors in estimated SO and CF splitting energies by LDA calculations are significant for semiconductors with strong Coulomb correlation effects, as demonstrated, e.g., for ZnO.Lambrecht et al. (2002); Karazhanov et al. (2006a, b) For such systems DFT calculations within LDA+Karazhanov et al. (2006a, b); Lambrecht et al. (2002) are shown to provide quite accurate values for and . Overestimation of the - hybridization in various variants of the DFT can also lead to the wrong spin-orbit coupling of the valence bands.Wei and Zunger (1989, 1988)
Systematic study of the SO coupling parameters was performed for zinc-blende II-VI semiconductors (Ref. Willatzen et al., 1995) using the TB and LMTO methods, as well as for all diamondlike and zinc-blende semiconductors (Ref. Carrier and Wei, 2004) using the FLAPW method with and without the local orbitals, and the frozen-core PAW method implemented into VASP. The corrections coming out from inclusion of the local orbitals are found to be negligible for the compounds with light atoms. Analysis of these results shows that the So splitting energy coming out from calculations using the VASP-PAW shows good agreement with the experimental data. This result was also obtainedKarazhanov et al. (2006a) recently for Zn of wurtzite and zinc-blende structures. As demonstrated in Refs. Karazhanov et al., 2006a, b the SO splitting energy () increases when one moves from ZnO-z to ZnTe-z in agreement with earlier findings of Ref. Carrier and Wei, 2004.
To study the role of the SO coupling in band dispersion the present ab initio calculations have been performed by VASP and MindLab packages and spin orbit splitting energy is found. The results are presented in Table 2. Analysis of the Table 2 shows that () calculated by MindLab is quite accurate.
| ZnO-z | ZnS-z | ZnSe-z | ZnTe-z |
|---|---|---|---|
| 31 | 66 | 432 | 914 |
| 31 | 66 | 432 | 914 |
| -34111LAPW, Ref. Carrier and Wei, 2004. | 66111LAPW, Ref. Carrier and Wei, 2004. | 393111LAPW, Ref. Carrier and Wei, 2004. | 889111LAPW, Ref. Carrier and Wei, 2004. |
| -34222LAPW+, Ref. Carrier and Wei, 2004. | 66222LAPW+, Ref. Carrier and Wei, 2004. | 398222LAPW+, Ref. Carrier and Wei, 2004. | 916222LAPW+, Ref. Carrier and Wei, 2004. |
| -37333VASP-PAW, Ref. Carrier and Wei, 2004. | 64333VASP-PAW, Ref. Carrier and Wei, 2004. | 392333VASP-PAW, Ref. Carrier and Wei, 2004. | 898333VASP-PAW, Ref. Carrier and Wei, 2004. |
| -33444VASP-PAW, Ref. Karazhanov et al., 2006a. | 64444VASP-PAW, Ref. Karazhanov et al., 2006a. | 393444VASP-PAW, Ref. Karazhanov et al., 2006a. | 897444VASP-PAW, Ref. Karazhanov et al., 2006a. |
| 65555Experiment, Ref. Madelung et al., 1982. | 420666Experiment, Ref. Madelung, 1996. | 910666Experiment, Ref. Madelung, 1996. |
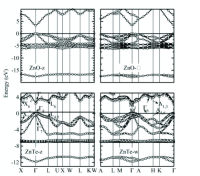
As expected, band dispersions calculated with and without the SO coupling differ little when the SO splitting energy is small. However, the difference increases, when one moves from ZnO to ZnTe. This feature is demonstrated in Table 2 and Fig. 4 for band dispersions of ZnO-z, ZnO-w, ZnTe-z, and ZnTe-w calculated by VASP with and without including the SO coupling. As is well known (see e.g. Ref. Voon et al., 1996a; Lambrecht et al., 2002; Karazhanov et al., 2006a), without the SO coupling top of the VB of Zn-w is split into a doublet and a singlet states. In the band structure, Fermi level is located at the topmost one [Fig. 4], which is the zero energy. Upon inclusion of the SO coupling into calculations, the doublet and singlet states are split into three twofold degenerate states called , and states with energies and , respectively,Mang et al. (1995) located in order of decreasing energy, i.e. . The center of gravity of the , and states, located at below the topmost state, remains to be nearly the same as the topmost VB corresponding to the case without the SO coupling.Voon et al. (1996a); Lambrecht et al. (2002) Consequently, to compare band structures calculated with and without the SO coupling, one should plot the band structure with Fermi energy at the center of gravity of the , and states for the former and at the topmost VB for the latter. Hence, when the SO coupling is applied, then the and states as well as the bottommost CB move upwards to in energy, whereas the state moves downwards to compared to the center of gravity. Then, positions of the lowest VB region calculated with and without the SO coupling remains nearly identical.
III.2 General features of optical spectra of Zn
Since optical properties of solids are based on the band structure, the nature of the basic peaks in the optical spectra can be interpreted in terms of the interband transitions responsible for the peaks. Such an interpretation is available for semiconductors with z- and w-type structures.Cardona and Harbeke (1965); Adachi (1999); Cohen and Chelikowsky (1988) In order to simplify the presentation of the findings of this work, the labels , and of Ref. Cardona and Harbeke, 1965 (from the reflectivity spectra) were retained in Table 3 and Fig. 4. The subscript 0 is ascribed to transitions occurring at , the subscript 1 to transitions at points in the direction, and the subscript 2 to transitions at points in the direction (referring to the k space for the z-type structure). Assignment of the , and peaks to optical transitions at high symmetry points is presented in Table 3 and Fig. 4.
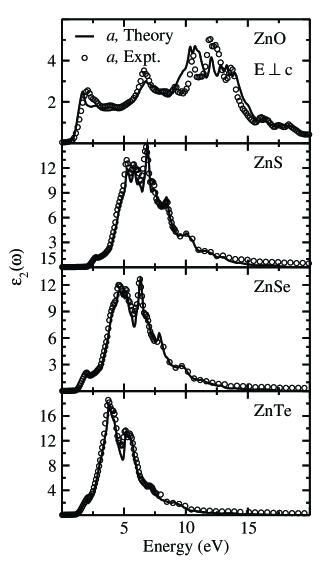
The optical spectra , and calculated by DFT within LDA, GGA, and LDA+ are displayed in Figs. 5–8 and compared with available experimental findings.Adachi (1999) The spectral profiles are indeed very similar to each other. Therefore, we shall only give a brief account, mainly focusing on the location of the interband optical transitions. The peak structures in Figs. 5–8 can be explained from the band structure discussed above.
| Peak | z-type | w-type, | w-type, |
|---|---|---|---|
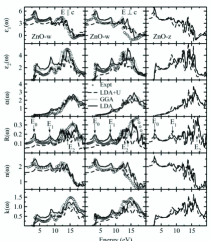
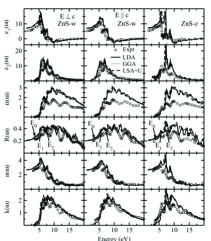
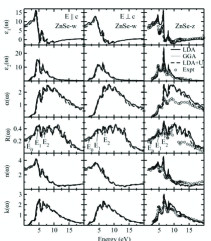
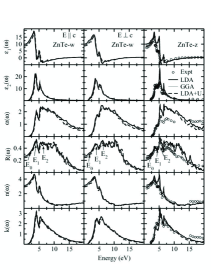
All peaks observed by experiments (see, e.g., Refs. Cardona and Harbeke, 1965 and Adachi, 1999) are reproduced by the theoretical calculations. Because of the underestimation of the optical band gaps in the DFT calculations the locations of all the peaks in the spectral profiles are consistently shifted toward lower energies as compared with the experimentally determined spectra. Rigid shift (by the scissor operator) of the optical spectra has been applied, which somewhat removed the discrepancy between the theoretical and experimental results. In general, the calculated optical spectra qualitatively agree with the experimental data. In our theoretical calculations the intensity of the major peaks are underestimated, while the intensity of some of the shoulders are overestimated. This result is in good agreement with previous theoretical findings (see, e.g., Ref. Wang and Klein, 1981). The discrepancies are probably originating from the neglect of the Coulomb interaction between free electrons and holes (excitons), overestimation of the optical matrix elements, and local-field and finite-lifetime effects. Furthermore, for calculations of the imaginary part of the dielectric response function, only the optical transitions from occupied to unoccupied states with fixed vector are considered. Moreover, the experimental resolution smears out many fine features and, as demonstrated in Fig. 1, there is inconsistency between the experimental data measured by the same method and temperature. However, as noted in Introduction, by accounting for the excitons and Coulomb correlation effects in ab initio calculationsLaskowski and Christensen (2006) by the linearized-augmented plane-wave method plus local orbitals (LAPW+LO) within LDA+ not only corrected energy position of the Zn-3 electrons and eigenvalues, but also optical response. Consequently, accounts for the excitons play an important role in the optical spectra.
The optical spectra calculated within LDA, GGA, and LDA+ do not differ significantly from each other for the Zn-w and -z phases except for ZnO-w and -z, for which the optical spectra calculated within LDA+ are significantly different from those obtained by LDA and GGA. The difference between the optical spectra calculated by LDA and GGA and those calculated by LDA+ decreases, when one moves from ZnO to ZnTe. For ZnTe the difference can be said to be very small. This feature shows that in ZnO-w and -z Coulomb correlation effects are strong compared to the other Zn-w and -z phases in agreement with recent LAPW+LO calculationsLaskowski and Christensen (2006) including electron–hole correlations.
Comparison of the optical spectra for and for each of the Zn-w phases with the isotropic spectra of the corresponding Zn-z phases shows that the locations of the peaks almost coincide. This similarity reflects that there is only small differences in the local arrangement of the atoms in the Zn-w and corresponding -z phases.
III.3 ZnO-w and ZnO-z
The optical spectra of ZnO-w and -z calculated by DFT within LDA, GGA and LDA+, together with measured data are displayed in Fig. 5. One clearly sees three major peaks in the experimental spectra located in the energy ranges 3.1–3.3 (), 7.5–8.5 () and 10–15 eV (). In the peak , and are seen to take larger values than those in the and peaks. This is one of the major features, which distinguishes ZnO-w and -z from the other Zn phases.
It should be noted that with increasing value for the parameter in the LDA+ calculations, the intensity of the and peaks of ZnO-w decreases compared with the LDA and GGA findings as well as with the experimental data. However, the intensity of the peak of ZnO-z from the LDA+ calculations has increased and has become even larger than those derived from the LDA and GGA calculations as well as the experimental data. The intensity of peak from the LDA+ calculations oscillates significantly, showing disagreement with the LDA and GGA calculations as well as the experimental measurements. Hence, although LDA+ calculationsKarazhanov et al. (2006a) were good to increase the LDA-derived band gap and the SO splitting energy as well as to decrease the crystal-field splitting energy and improving the band dispersion, it was poorer than LDA and GGA to describe the optical properties of the ZnO phases. Probably, this discrepancy comes about because in our ab initio calculations electron–hole interactions and SO coupling are not included.Laskowski and Christensen (2006) The strong variation of the optical properties with increasing the values of indicates appreciable Coulomb correlation effects in ZnO-w and -z in agreement with our previous band structure findingsKarazhanov et al. (2006a, b) and LAPW+LO calculationsLaskowski and Christensen (2006) including excitonic effect. This feature is not present in the spectra for the other Zn-w and -z phases considered.
For convenience of analysis the profile was analyzed by adjusting the peak location to the experimental data of Ref. Adachi, 1999 by rigid shift. On comparing this result with that of Ref. Klucker et al., 1971, it is concluded that the peaks at 3.40 eV for and that at 3.33 eV for of and can be ascribed to transitions at the fundamental absorption edge. As shown in Ref. Klucker et al., 1971, the energy difference (0.07 eV) between these two peaks gives the separation between the so-called A, B (for ), and C (for ) states forming the topmost VB of w-type semiconductors in agreement with 0.083 eV according to the band-structure analyses in Refs. Karazhanov et al., 2006a and Karazhanov et al., 2006b.
There are two broad shoulders of the peak located at 4.44 and 5.90 eV for , and 3.90 and 5.29 eV for . Similar shoulders are found at lower energies in the experimental spectra of Refs. Klucker et al., 1971 and Liang and Yoffe, 1968 observed at 3.35 and 3.41 eV for and 3.39 and 3.45 eV for , and the origin of these shoulders have been ascribed to exciton–phonon coupling. However, in our ab initio studies excitons and lattice vibrations are not taken into consideration.
III.4 ZnS-w and ZnS-z
The experimentalAdachi (1999) optical spectra for the ZnS-w and -z phases are displayed in Fig. 6 together with those calculated according to the LDA, GGA, and LDA+. It is seen that the magnitudes of the experimentallyCardona and Harbeke (1965) observed shoulders around the peak in the reflectivity spectra of ZnS-w are overestimated in the DFT calculations. As a result, the intensities of the shoulders are almost the same as intensities of the peaks and for and even exceeds them for .
The calculated optical spectra for ZnS-w by LDA, GGA, and LDA+ turned out to be almost identical at energies below 10 eV. However, at higher energies the LDA- and GGA-derived peaks differ from those obtained by LDA+. This difference can be associated with Zn-3 electrons, which were shifted toward lower energies in the LDA+ calculations. Hence, in ZnS-w and -z the Coulomb correlation effects appear to play a significant role in optical properties at energies higher than 10 eV.
Compared to ZnO-w, the calculated optical spectra of ZnS-w and -z show larger disagreement with the experimental data. The discrepancy is quite pronounced in the absorption and reflectivity spectra of ZnS-w and -z, especially at energies exceeding 7 eV. The magnitude of the peaks located at higher energies are overestimated significantly compared to the experimental data. The overestimation is more severe in ZnS-z than in ZnS-w as judged from the intensity of the peak.
III.5 ZnSe-w, ZnTe-w, ZnSe-z, and ZnSe-z
The optical spectra for ZnSe-w, ZnSe-z, ZnTe-w, and ZnTe-z calculated by DFT within LDA, GGA, and LDA+ are displayed in Figs. 7 and 8 together with corresponding experimental spectra. Since experimental optical spectra for ZnSe-w and ZnTe-w are not available, rigid shift of the parameters toward higher energies have been performed on the basis of the reflectivity spectra for ZnSe-z and ZnTe-z (Figs. 7 and 8). A closer inspection of Figs. 7 and 8 shows that the optical spectra calculated within LDA, GGA, and LDA+ are almost the same for all selenide and telluride phases. The small differences noted in the absorption and reflectivity spectra appear to originate from the Zn-3 electrons.
The location and magnitude of the experimentally measured peak in the reflectivity spectra of ZnSe-z and ZnTe-z have been assignedAdachi (1999); Cardona and Harbeke (1965) to fundamental absorption and transitions at the point of the Brillouin zone. These assignments agree well with theoretical calculations. However, the theoretical calculations did not locate the peak on the high-energy side of the peak, which was observed experimentally for both ZnSe-z and ZnTe-z. The reason is certainly that SO coupling was not included in the calculations.
The experimental Cardona and Greenaway (1963) peak in the reflectivity spectra, corresponding to transitions at [viz. from the highest state of VB () to the lowest state of CB ()] is well reproduced by the theoretical calculations. One also sees the peak in the theoretical spectra, which previouslyCardona and Greenaway (1963) was ascribed to SO splitting. Since SO coupling was neglected in the theoretical calculations, the origin of the peak is not likely to be related to SO coupling.
Similar to the findings for ZnS-z, theoretically calculated optical spectra for the lower energy regions of ZnSe-z and ZnTe-z agree with experimental findings. However, the intensity of the peaks located at higher energies are overestimated in the DFT calculations. Anyway, this discrepancy is not as severe as that for ZnS-z. The calculated reflectivity spectra agree well with experimental data in the energy range eV. At higher energies (6–15 eV) LDA, GGA, and LDA+ all overestimate the intensity of the reflectivity. Fairly good agreement with the experimental data is achieved in the energy range 15–20 eV for the real and imaginary parts of the dielectric function for ZnSe-z and ZnTe-z. For the other optical spectra of ZnSe-z and ZnTe-z the agreement between theory and experiment is poorer.
III.6 Influence of spin-orbit splitting on the optical spectra of Zn
It is well-known that SO splitting at the top of the VB of a semiconductor is very important for optical transitions and one should expect large difference in the optical spectra calculated with and without the SO coupling. In this section we shall analyze how the SO coupling influences the optical spectra of Zn. For this analysis, ab initio band structure calculations have been performed using the MindLab software with and without SO coupling. Based on the band structure studies, dielectric response function has been calculated. The results for Zn-z are presented in Fig. 9 and compared with experimental data, where it is seen that calculated for ZnO-z without SO coupling is slightly higher than that with the SO coupling, the main deviations occurring at 3.44–6.00 eV and 10.00–12.00 eV. The reason for the small distinctions in in this case is the small SO splitting energy.
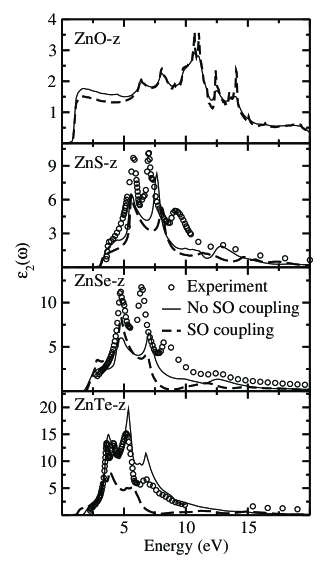
Our findings show that the SO splitting influence the calculated optical spectra and in particular it most pronounced at energies lower than eV. At higher energies, the difference between the optical spectra calculated with and without SO coupling is fairly small and agree reasonable well with the experimental data.Adachi (1999) This statement applies to all Zn phases studied. It should be noted that intensities of the peaks calculated with the SO coupling are generally lower than those obtained without SO coupling and the latter set agrees better with experimental data than the former. Furthermore, in the experimental spectra there are low intensity peaks located at 9.4 eV in ZnS-z, 8.4 eV in ZnSe-z, and 7.0 eV in ZnTe-z. However, these peaks are not seen in the calculated spectra with the SO coupling. As noted, this discrepancy can be related to neglect of many above factors like Coulomb interaction between electrons and holes, local-field effects, and indirect transitions etc.
III.7 Role of the ground state structure in the optical spectra of Zn
In this section we shall analyze optical spectra of Zn calculated using the experimentally and theoretically determined lattice parameters. To find the lattice parameters from the calculations, the structural optimization has been performed, which includes the following steps: (i) atoms are relaxed keeping the volume and shape of the lattice. After convergence is reached, the resulting lattice and positional parameters have been used as input to optimize atomic positions, shape and volume of the unit cell altogether. Then dependence of the total energy on volume is studied. Minimum of the dependence was accepted as the equilibrium state. Lattice and positional parameters corresponding to the minimum is referred to as the theoretically determined lattice parameters. The thus determined theoretical lattice parameters do not deviate much from experimental ones. The parameters along with the experimentally determined ones were used for subsequent computations of the electronic structure and optical spectra. The results are presented in Fig. 10 for Zn-w for . Analysis shows that the optical spectra of ZnO-w for deviate each from other at lower energies corresponding to the fundamental absorption and at higher energies in the range 8–13 eV. The reason of the difference can be related to changes of the - coupling because of the changes of the Zn-O bond lengths coming out from structural optimization. Optical spectra of ZnO-w for and those of other Zn-w and -z calculated using the theoretical and experimental lattice parameters do not differ each from other significantly.
IV Conclusion
The band structures of the Zn-w and -z phases (=O, S, Se, and Te) are calculated by DFT within LDA, GGA, and LDA+. The topmost VB states are found to be more dispersive than the bottommost CB states. Spin-orbit coupling is found to play an important role for band dispersion, location and width of the Zn-3 band, and the lowest band. By analyzing the dependence of the band gaps on the atomic number of for Zn, the band gap of ZnO-z is estimated to be eV. Using the electronic band structures as references, the optical spectra of Zn-w and -z are analyzed in the energy range 0–20 eV. The locations of the peaks corresponding to transitions at the fundamental absorption edge calculated by DFT are shifted to lower energies relative to the experimental peaks. This deficiency originates from the well-known errors in band gaps calculated according to DFT. In order to correct the underestimation of band gaps calculated by DFT, the location of the calculated peaks of the optical spectra have been rigidly shifted toward higher energies to match with the experimentally determined locations. In the thus obtained spectra the locations of the peaks in the lower energy region agree well with the experimental data. However, the peaks in the higher energy region agree only tolerably well with the experimental findings. The overall conclusion is that the -independent scissors operator provides a good first approximation for correlation of the underestimated band gaps for the Zn-w and -z phases. Based on this result, “corrected” band structures of the Zn phases are arranged by adjusting the band gap up to experimentally measured value (viz. rigidly lifting the lowest CB). Not only the locations, but also the intensities of some of the calculated low-energy peaks agree with available experimental data for all Zn phases. However, the intensities of some peaks located at higher energies and shoulders have been overestimated. The GGA approach slightly improved the band-gap values. Also, the optical spectra of ZnO-w for calculated within the GGA agree better with the experimental data than those calculated within the LDA and LDA+ approaches. The value for the corresponding transition at the fundamental absorption edge is decreased and becomes sharper with the use of the GGA thus providing better agreement with experimental data than LDA. For inhomogeneity in the electron gas plays an important role, while it is not so important for . The optical spectra for ZnO-w and -z calculated within LDA+ for the energy range 0–20 eV is found to depend significantly on the location of energy levels of the Zn-3 electrons. For the other Zn-w and -z phases such changes are not so pronounced, in fact, only noticeable at energies above 10 eV. Strong Coulomb correlation effects are established for ZnO-w and -z. According to the present LDA+ calculations the probability for the optical transitions at the fundamental absorption edge of ZnO-w and -z decrease with increasing . Optical spectra for ZnO-z, ZnSe-w, and ZnTe-w have been predicted. The influence of the spin-orbit coupling is found to increase with increasing the atomic number of the component of Zn.
Acknowledgments
This work has received financial and supercomputing support from the Research Council of Norway and Academy of Sciences of Uzbekistan (Project N31-36,24-06). The authors are thankful to R. Vidya for critical reading of the manuscript and comments. Also we thank Dr. P. Vajeeston, A. Klaveness, and Dr. K. Knizek for computation-practical help.
References
- Yoshikawa and Adachi (1997) H. Yoshikawa and S. Adachi, Jpn. J. Appl. Phys. 36, 6237 (1997).
- Postava et al. (2000) K. Postava, H. Sueki, M. Aoyama, T. Yamaguchi, C. Ino, Y. Igasaki, and M. Horie, J. Appl. Phys. 87, 7820 (2000).
- Postava et al. (2001) K. Postava, H. Sueki, M. Aoyama, T. Yamaguchi, K. Murakami, and Y. Igasaki, Appl. Surf. Sci. 175–176, 543 (2001).
- Washington et al. (2000) P. L. Washington, H. C. Ong, J. Y. Dai, and R. Chang, Appl. Phys. Lett. 72, 3261 (2000).
- Muth et al. (1999) J. F. Muth, R. M. Kolbas, A. K. Sharma, S. Oktyabrsky, and J. Narayan, J. Appl. Phys. 85, 7884 (1999).
- Srikant and Clarke (1998) V. Srikant and D. R. Clarke, J. Appl. Phys. 83, 5447 (1998).
- Hengehold et al. (1970) R. L. Hengehold, R. J. Almassy, and F. L. Pedrotti, Phys. Rev. B 1, 4784 (1970).
- Klucker et al. (1971) R. Klucker, H. Nelkowski, Y. S. Park, M. Skibowski, and T. S. Wagner, Phys. Status Solidi B 45, 265 (1971).
- Freeouf (1973) J. L. Freeouf, Phys. Rev. B 7, 3810 (1973).
- Cardona and Haensel (1970) M. Cardona and R. Haensel, Phys. Rev. B 1, 2605 (1970).
- Cardona and Harbeke (1965) M. Cardona and G. Harbeke, Phys. Rev. 137, A1467 (1965).
- Merad et al. (2005) A. E. Merad, M. B. Kanoun, G. Merad, J. Cibert, and H. Aourag, Mater. Chem. Phys. 92, 333 (2005).
- Cardona and Greenaway (1963) M. Cardona and D. L. Greenaway, Phys. Rev. 131, 98 (1963).
- Adachi (1999) Optical Constants of Crystalline and Amorphous Semiconductors. Numerical Data and Graphical Information, edited by S. Adachi (Kluwer Academic Publishers. Boston/Dordrecht/London, 1999).
- Sobolev and Sobolev (2003) V. V. Sobolev and V. V. Sobolev, Phys. Low-Dim. Struct. 9/10, 113 (2003).
- Hohenberg and Kohn (1964) P. Hohenberg and W. Kohn, Phys. Rev. 136, B864 (1964).
- Kohn and Sham (1965) W. Kohn and L. J. Sham, Phys. Rev. 140, A1133 (1965).
- Xu and Ching (1993) Y.-N. Xu and W. Y. Ching, Phys. Rev. B 48, 4335 (1993).
- Wang and Klein (1981) C. S. Wang and B. M. Klein, Phys. Rev. B 24, 3417 (1981).
- Laskowski and Christensen (2006) R. Laskowski and N. E. Christensen, Phys. Rev. B 73, 045201 (2006).
- Karazhanov et al. (2006a) S. Z. Karazhanov, P. Ravindran, U. Grossner, A. Kjekshus, H. Fjellvåg, and B. G. Svensson, J. Appl. Phys. 100, 04 3709 (2006a).
- Karazhanov et al. (2006b) S. Z. Karazhanov, P. Ravindran, U. Grossner, A. Kjekshus, H. Fjellvåg, and B. G. Svensson, J. Cryst. Growth 287, 162 (2006b).
- Anisimov et al. (1993) V. I. Anisimov, I. V. Solovyev, M. A. Korotin, M. T. Czyzyk, and G. A. Sawatzky, Phys. Rev. B 48, 16 929 (1993).
- Dudarev et al. (1998) S. L. Dudarev, G. A. Botton, S. Y. Savrasov, C. J. Humphreys, and A. P. Sutton, Phys. Rev. B 57, 1505 (1998).
- Bengone et al. (2000) O. Bengone, M. Alouani, P. Blöchl, and J. Hugel, Phys. Rev. B 62, 16 392 (2000).
- Lambrecht et al. (2002) W. R. L. Lambrecht, A. V. Rodina, S. Limpijumnong, B. Segall, and B. K. Meyer, Phys. Rev. B 65, 07 5207 (2002).
- Voon et al. (1996a) L. C. Lew Yan Voon, M. Willatzen, M. Cardona, and N. E. Christensen, Phys. Rev. B 53, 10 703 (1996a).
- Carrier and Wei (2004) P. Carrier and S.-H. Wei, Phys. Rev. B 70, 03 5212 (2004).
- Wei and Zunger (1996) S.-H. Wei and A. Zunger, Appl. Phys. Lett. 69, 2719 (1996).
- Willatzen et al. (1995) M. Willatzen, M. Cardona, and N. E. Christensen, Phys. Rev. B 51, 17 992 (1995).
- Lalitha et al. (2006) S. Lalitha, S. Z. Karazhanov, P. Ravindran, S. Senthilarasu, R. Sathyamoorthy, and J. Janabergenov, Phys. B 387, 227 (2006).
- Bader (1990) R. F. W. Bader, Atoms in molecules: A Quantum Theory (Oxford University Press, New York, 1990).
- Cardona et al. (1995) M. Cardona, N. E. Christensen, and G. Fasol, Phys. Rev. B 38, 1806 (1995).
- Usuda et al. (2002) M. Usuda, N. Hamada, T. Kotani, and M. van Schilfgaarde, Phys. Rev. B 66, 12 5101 (2002).
- Oshikiri and Aryasetiawan (2000) M. Oshikiri and F. Aryasetiawan, J. Phys. Soc. Jpn. 69, 2113 (2000).
- Fleszar and Hanke (2005) A. Fleszar and W. Hanke, Phys. Rev. B 71, 045207 (2005).
- Rinke et al. (2005) P. Rinke, A. Qteish, J. Neugebauer, C. Freysoldt, and M. Scheffler, New J. Phys. 7, 126 (2005).
- Städele et al. (1999) M. Städele, M. Moukara, J. A. Majewski, P. Vogl, and A. Görling, Phys. Rev. B 59, 10 031 (1999).
- Sharma et al. (2005) S. Sharma, J. K. Dewhurst, and C. Ambrosch-Draxl, Phys. Rev. Lett. 95, 136402 (2005).
- Asahi et al. (1999) R. Asahi, W. Mannstadt, and A. J. Freeman, Phys. Rev. B 59, 7486 (1999).
- Benedict et al. (1998) L. X. Benedict, E. L. Shirley, and R. B. Bohn, Phys. Rev. B 57, R9385 (1998).
- Bechsted et al. (1997) F. Bechstedt, K. Tenelsen, B. Adolph, and R. Del Sole, Phys. Rev. Lett. 78, 1528 (1997).
- Baraff and Schlüter (1984) G. A. Baraff and M. Schlüter, Phys. Rev. B 30, 3460 (1984).
- Delin et al. (1998) A. Delin, P. Ravindran, O. Eriksson, and J. M. Wills, Int. J. Quantum Chem. 69, 349 (1998).
- Ravindran et al. (1999a) P. Ravindran, A. Delin, B. Johansson, O. Eriksson, and J. M. Wills, Phys. Rev. B 59, 1776 (1999a).
- ICS (2001) Inorganic Crystal Structure Database (Gmelin Institut, Karlsruhe, 2001).
- Weber (1986) Handbook of Laser Science and Technology, vol. III, edited by M. J. Weber (CRC, Cleveland, 1986).
- Zakharov et al. (1994) O. Zakharov, A. Rubio, X. Blase, M. L. Cohen, and S. G. Louie, Phys. Rev. B 50, 10 780 (1994).
- Lakshmi et al. (2003) N. Lakshmi, N. M. Rao, R. Venugopal, D. R. Reddy, and B. K. Reddy, Mater. Chem. Phys. 82, 764 (2003).
- Tomashik et al. (1978) V. N. Tomashik, G. S. Oleinik, and I. B. Mizetskaya, Inorg. Mater. 14, 1119 (1978).
- Bragg and Darbyshire (1954) W. H. Bragg and J. A. Darbyshire, J. Met. 6, 238 (1954).
- Hellwege and Madelung (1982) Numerical Data and Functional Relationships in Science and Technology, vol. 17a and 22a of Landolt-Börnstein, New series. Group III, edited by K.-H. Hellwege and O. Madelung (Springer, New York, 1982).
- Weast et al. (1990) CRC Handbook of Chemistry and Physics, 70th ed., edited by R. C. Weast, D. R. Lide, M. J. Astle, and W. H. Beyer (Chemical Rubber, Boca Raton, 1990).
- Agrawal et al. (1994) B. K. Agrawal, P. S. Yadav, and S. Agrawal, Phys. Rev. B 50, 14 881 (1994).
- Kresse and Furthmüller (1996) G. Kresse and J. Furthmüller, Phys. Rev. B 54, 11 169 (1996).
- Perdew et al. (1996) J. P. Perdew, K. Burke, and M. Ernzerhof, Phys. Rev. Lett. 77, 3865 (1996).
- Perdew and Zunger (1981) J. P. Perdew and A. Zunger, Phys. Rev. B 23, 5048 (1981).
- Ceperley and Alder (1980) D. M. Ceperley and B. J. Alder, Phys. Rev. Lett. 45, 566 (1980).
- Blöchl (1994) P. E. Blöchl, Phys. Rev. B 50, 17 953 (1994).
- Kresse and Joubert (1999) G. Kresse and D. Joubert, Phys. Rev. B 59, 1758 (1999).
- Adolph et al. (2001) B. Adolph, J. Furthmüller, and F. Bechstedt, Phys. Rev. B 63, 12 5108 (2001).
- Vogel et al. (1995) D. Vogel, P. Krüger, and J. Pollmann, Phys. Rev. B 52, R14 316 (1995).
- Dong et al. (2004) C. L. Dong, C. Persson, L. Vayssieres, A. Augustsson, T. Schmitt, M. Mattesini, R. Ahuja, C. L. Chang, and J.-H. Guo, Phys. Rev. B 70, 19 5325 (2004).
- Janotti and Van de Walle (2006) A. Janotti and C. G. Van de Walle, J. Cryst. Growth 287, 58 (2006).
- Pickett et al. (1998) W. E. Pickett, S. C. Erwin, and E. C. Ethridge, Phys. Rev. B 58, 1201 (1998).
- Ruckh et al. (1994) M. Ruckh, D. Schmid, and H. W. Schock, J. Appl. Phys. 76, 5945 (1994).
- Savrasov (1996) S. Y. Savrasov, Phys. Rev. B 54, 16470 (1996).
- Gunnarsson and Lundqvist (1976) O. Gunnarsson and B. I. Lundqvist, Phys. Rev. B 13, 4274 (1976).
- Vosko et al. (1980) S. H. Vosko, L. Wilk, and M. Nusair, Can. J. Phys. 58, 1200 (1980).
- Ravindran et al. (1997) P. Ravindran, A. Delin, R. Ahuja, B. Johansson, S. Auluck, J. M. Wills, and O. Eriksson, Phys. Rev. B 56, 6851 (1997).
- Ravindran et al. (1999b) P. Ravindran, A. Delin, P. James, B. Johansson, J. M. Wills, R. Ahuja, and O. Eriksson, Phys. Rev. B 59, 15 680 (1999b).
- Vogel et al. (1996) D. Vogel, P. Krüger, and J. Pollmann, Phys. Rev. B 54, 5495 (1996).
- Madelung (1992) Data in Science and Technology. Semiconductors: Other than Group IV Elements and III-V Compounds, edited by O. Madelung (Springer, Berlin, 1992).
- Hümmer (1973) K. Hümmer, Phys. Status Solidi B 56, 249 (1973).
- Hopfield (1960) J. J. Hopfield, J. Phys. Chem. Solids 15, 97 (1960).
- Wei and Zunger (1989) S.-H. Wei and A. Zunger, Phys. Rev. B 39, 3279 (1989).
- Wei and Zunger (1988) S.-H. Wei and A. Zunger, Phys. Rev. B 37, 8958 (1988).
- Madelung et al. (1982) Numerical Data and Functional Relationships in Science and Technology. New Series. Group III: Crystal and Solid State Physics. Semiconductors. Physics of Group IV Elements and III-V Compounds, edited by O. Madelung, M. Schulz, and H. Weiss (Springer, Berlin, vol. 17, 1982).
- Madelung (1996) Semiconductors: Basic Data, 2nd ed., edited by O. Madelung (Springer, Berlin, 1996).
- Mang et al. (1995) A. Mang, K. Reimann, and S. Rübenacke, Solid State Commun. 94, 251 (1995).
- Cohen and Chelikowsky (1988) M. L. Cohen and J. R. Chelikowsky, Electronic Structure and Optical Properties of Semiconductors (Springer, Berlin, 1988).
- Liang and Yoffe (1968) W. Y. Liang and A. D. Yoffe, Phys. Rev. Lett. 20, 59 (1968).