The Millennium Galaxy Catalogue: The connection between close pairs and asymmetry; implications for the galaxy merger rate
Abstract
We compare the use of galaxy asymmetry and pair proximity
for measuring galaxy merger fractions and rates for a volume limited
sample of galaxies with mag. and
drawn from the Millennium Galaxy Catalogue.
Our findings are that:
(i) Galaxies in close pairs are generally more asymmetric than isolated
galaxies and the degree of asymmetry increases for closer pairs. At least
35 of close pairs (with projected separation of less than 20
kpc and velocity difference of less than 500 km ) show significant
asymmetry and are therefore likely to be physically bound.
(ii) Among asymmetric galaxies, we find that at least are either
interacting systems or merger remnants. However, a significant fraction
of galaxies initially identified as asymmetric are contaminated by nearby
stars or are fragmented by the source extraction algorithm. Merger rates
calculated via asymmetry indices need careful attention in order to remove
the above sources of contamination, but are very reliable once this is
carried out.
(iii) Close pairs and asymmetries represent two complementary methods of
measuring the merger rate. Galaxies in close pairs identify future mergers,
occurring within the dynamical friction timescale, while asymmetries are
sensitive to the immediate pre-merger phase and identify remnants.
(iv) The merger fraction derived via the close pair fraction and asymmetries
is about for a merger rate of
Mpc-3 Gyr-1.
These results are marginally consistent with theoretical simulations (depending
on the merger time-scale), but imply a flat evolution of the merger rate with
redshift up to .
Subject headings:
galaxies: interactions – galaxies: structure1. Introduction
In the -dominated Cold Dark Matter (CDM) model, galaxies form via a process of hierarchical merging, in which more massive objects are assembled gradually via mergers of increasingly more massive subunits at progressively lower redshifts (see Baugh 2006 for an introduction). Observations of the merger rate of galaxies and its evolution with redshift provide important benchmarks for comparison with theoretical predictions, according to which massive galaxies have undergone several mergers between and the present epoch, doubling their mass over the last half of the Hubble time (Murali et al., 2002; Maller et al., 2006).
Unfortunately, it is generally difficult to ascertain observationally if two galaxies are going to merge in the near future, or if and when a galaxy last experienced a merger. Galaxies undergoing mergers or interactions may exhibit peculiar morphological disturbances, such as tidal tails (Arp, 1966; Toomre & Toomre, 1972; Toomre, 1977), while merger remnants may also show relic structures from their previous interactions, such as shells or ripples (Malin & Carter, 1980, 1983). A more quantitative version of this approach measures the asymmetry of a galaxy’s light distribution to identify interacting systems and merger remnants and estimate the galaxy merger rate, e.g. using the CAS system (Bershady, Jangren & Conselice 2000, Conselice 2003; Conselice et al. 2003 and references therein).
Before galaxies merge they will be distinct systems with some radial velocity difference and projected separation on the sky from which a merger time-scale can be calculated based on dynamical friction arguments. Galaxy pair statistics therefore could, in principle, provide a powerful probe of mergers and their frequency. With modern imaging and spectroscopic surveys it is now possible to select pairs of galaxies which are not only close on the sky, but also at very similar redshifts, and are therefore more likely to be gravitationally bound. Such objects are referred to as ‘dynamically close pairs’. The mathematical formalism to measure the close pair fraction and to derive the merger rate from it was developed by Patton et al. (2000) for the Second Southern Sky Redshift Survey and Patton et al. (2002) for the Canadian Network for Observational Cosmology 2 (CNOC2) survey and later applied to DEEP2 (Lin et al., 2004) and the MGC (De Propris et al., 2005). Both of these latter studies found a low local merger rate, suggesting that only a small fraction of massive galaxies are formed by major mergers at .
There are therefore two methods for observationally measuring the merger history – finding galaxies in pairs that will eventually merge, and locating highly asymmetric galaxies. Neither of these two approaches is free from ambiguity however. For example, not all close galaxy pairs will be dynamically bound and result in mergers. The observational problem is that it is impossible to constrain the projected relative motion of the two members of a close pair or to precisely determine the radial distance between them. Patton et al. (2000) estimate that close pair samples may suffer from contamination by as many as % unphysical pairs (superpositions).
On the other hand, not all asymmetric galaxies are imminent or recent major mergers, as it is possible to induce significant asymmetries by other means (e.g., interactions, star formation, minor mergers, etc. – see, e.g., Conselice, Bershady & Jangren 2000a). Care must therefore be taken when selecting mergers based on asymmetry (Conselice, 2003).
The two techniques – asymmetry and close pairs – are also likely to probe different stages of a merger: Hernández-Toledo et al. (2005) suggest that galaxy morphology is very robust, and that significant asymmetries are induced only by a close interaction. Furthermore, N-body simulations indicate that a merger remnant may remain significantly asymmetric for an extended period after the merger event (Conselice, 2006). Hence asymmetry is likely to probe the immediate pre-merger and an extended post-merger phase. In contrast, galaxy pairs will select all stages of the pre-merger phase except the very last, where the two galaxies can no longer be identified unambiguously as individual objects in the imaging data.
It is important to understand how galaxy pairs and asymmetric galaxies measure the merger process because, for observational reasons, the two methods are preferentially employed in different redshift regimes. At high redshift, highly complete spectroscopic samples are difficult to obtain whereas relatively high resolution imaging is available from HST. Hence selection by asymmetry is often the method of choice in this regime (e.g. Conselice et al., 2003). At low redshift, the situation is essentially reversed so that the pair method is preferred (e.g. Patton et al., 2002). We clearly require a cross-calibration of the two methods on the same dataset before drawing reliable conclusions regarding the evolution of the merger rate at high and low redshifts.
In this paper we attempt to deliver this cross-calibration by searching for dynamically close pairs of galaxies and measuring the structural asymmetries on the same sample of objects. We then determine if paired galaxies are asymmetric, and also how the merger fractions and rates derived from both methods compare. A few questions we address include: are galaxies in close pairs more asymmetric than isolated galaxies? Does the degree of disturbance correlate with pair separation? Are more asymmetric galaxies more likely to lie in pairs, with the most asymmetric ones in closer systems? What is the distribution of galaxy asymmetries for the local universe? Are there isolated galaxies with high asymmetry, and are these merger remnants?
Patton et al. (2005) carried out a similar study by comparing the asymmetries of isolated galaxies and those in close pairs, taken from the CNOC2 redshift survey, using Hubble Space Telescope snapshots of close pair candidates and a small sample of isolated CNOC2 galaxies falling within the HST field of view. For these galaxies, they measure asymmetries using the index of Schade et al. (1995). Galaxies in CNOC2 pairs are more asymmetric than isolated ones, but over only a limited range of pair separations (up to kpc in projection) set by the original pair selection by Patton et al. (2002). Hernández-Toledo et al. (2005) have compared asymmetries in spiral-spiral pairs, ultraluminous infrared galaxies (commonly regarded as interacting and/or merging systems; Lonsdale, Farrah & Smith 2006) and a local sample of objects from Frei et al. (1996), showing that asymmetry increases with decreasing pair separation, although the samples were somewhat heterogeneous.
To measure the merger rate from asymmetry and dynamically close pairs requires a dataset with both high-quality imaging and very complete redshift information. The Millennium Galaxy Catalogue (MGC; Liske et al. 2003) is particularly well-suited to this task. The MGC consists of deep CCD imaging of a long, thin () equatorial strip, reaching to mag and mag arcsec-2, and coinciding with both the 2dF Galaxy Redshift Survey northern strip (2dFGRS; Colless et al. 2001) and with the Sloan Digital Sky Survey data release 1 region (SDSS; Abazajian et al. 2003). The MGC also includes a parallel redshift survey, reaching % completeness at mag and % at mag (Driver et al., 2005).
Because of its homogeneous high-quality imaging, its large, contiguous field of view, and high redshift completeness, the MGC enables one to compute the merger rate from the statistics of dynamically close pairs (De Propris et al., 2005) and galaxy asymmetries. The main purpose of this paper is to carry out a comparison of these two approaches using the same, homogeneous, sample of galaxies. As in previous MGC papers, we adopt a cosmology with , and calculate all distances with reference to km s-1 Mpc-1.
2. Methodology
2.1. Sample
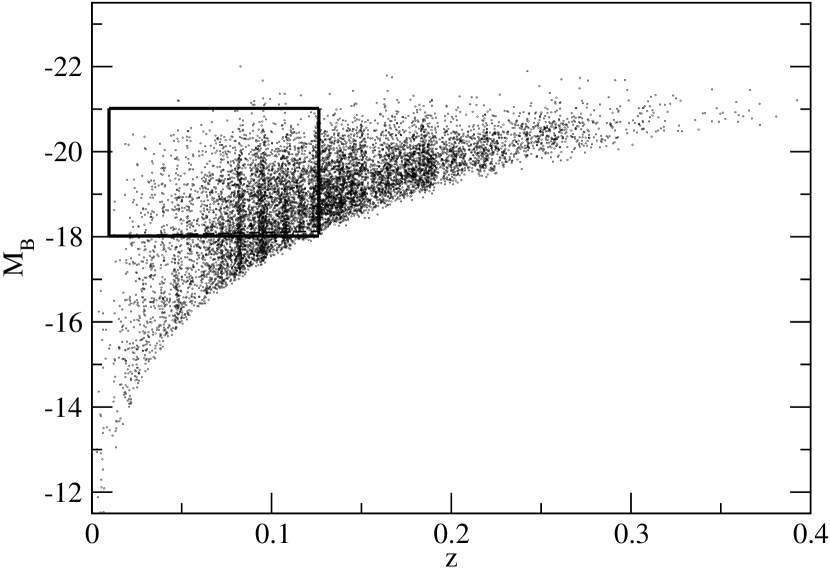
In order to compare asymmetries and close pairs as indicators of the merger rate, we first select a volume-limited sample of galaxies from the MGC. This sample includes galaxies with mag, mag and . These limits are shown in Figure 1. From this sample we extract close pairs with projected separations of up to kpc and isolated galaxies (i.e., with no companion within the specified magnitude and redshift limits and projected separation criteria). We also compute asymmetries for all galaxies in the volume-limited sample. Because of the absolute magnitude range considered, we can identify mergers with a luminosity ratio of up to for the brighter galaxies ( mag.), with the sample becoming more incomplete for fainter galaxies. The range in luminosity ratios that can be explored biases the sample towards pairs with nearly equal luminosities.
2.2. Galaxy Pairs
We identify dynamically close pairs using the above sample in the same way as Patton et al. (2000, 2002) and Patton et al. (2005). However, we consider a wider range of projected separations than Patton et al. (2005) because of our wider angular coverage and more complete spectroscopy. Two galaxies in our sample form a dynamically close pair if their projected separation is less than kpc, and their velocity difference is less than km s-1. We consider only the closest companion (multiplets are ignored) and galaxies with no such companion are regarded as isolated for our purposes.
The above criteria for position and velocity separation were chosen as follows. The pairwise velocity dispersion of 2dF galaxies is km s-1 (Hawkins et al, 2003); therefore objects with larger velocity separations are unlikely to be bound (see also Figure 4 in Patton et al. 2000). In addition, simulations show that pairs with larger velocity separations are unlikely to merge (Carlberg, Pritchet & Infante 1994), while a velocity separation of km s-1 is generally larger than the internal velocity dispersion of the galaxies under study, which decreases the likelihood of a significant interaction (Makino & Hut, 1997).
Simulations also show that galaxies with similar masses, and with a projected separation of less than kpc are likely to merge within Gyr (Barnes, 1988; Carlberg et al., 1994; Conselice, 2006). The upper limit on the projected separation we adopt in this paper ( kpc) is arbitrary, but it should isolate all objects likely to merge in the near future, as well as those where the interaction has induced significant asymmetry (cf. Hernández-Toledo et al. 2005).
It is of course possible that we miss some companions due to our incomplete redshift coverage. There are mag galaxies (4% of all systems) in the MGC for which we have not obtained a redshift. We use the projected separation criterion to calculate whether any of these galaxies could be the closest companion to a galaxy in the volume-limited sample. If so, we assume that the galaxy without redshift has the same redshift and -correction as its putative companion, and require that it obeys the absolute magnitude cuts to be part of the volume-limited sample. Objects in the sample for which the closest companion may be one of the galaxies without redshifts are however not included in our analysis. This decreases our sample to galaxies from the original . This contains galaxies in pairs with projected separation of less than kpc, and isolated galaxies. While all pairs within the specified luminosity and redshift limits are included, the sample is incomplete towards pairs with large luminosity differences and tends to be more complete for pairs of nearly equal luminosities. The median magnitude difference for the above 112 pairs is mag., equivalent to a typical 1:2 luminosity ratio (i.e., we primarily measure major mergers).
2.3. Galaxy Asymmetries
Asymmetries for galaxies within the volume-limited sample are calculated using both the index of Schade et al. (1995) and the more recent CAS indices of Conselice et al. (2000a), which have been calibrated on local galaxy samples to identify merger remnants. The details on how to calculate the asymmetries used in this paper are given in Simard et al. (2002) and Allen et al. (2006), for the method, and Conselice et al. (2000a); Bershady et al. (2000); Conselice (2003); Conselice et al. (2004) for the revised CAS indices. The CAS (concentration, asymmetry, clumpiness) parameters are a non-parametric method for measuring the structures of galaxies resolved on CCD images. One particular feature of this system is that galaxies with extremely high asymmetries, usually , are likely to be in a major (post-)merger phase. This has been calibrated with asymmetry measurements of nearby and distant normal and merging galaxies (Conselice et al., 2000a; Conselice, 2003; Conselice et al., 2005; Bridge et al., 2007), and of ‘galaxies’ seen in N-body merger simulations (Conselice, 2006). Furthermore, Conselice, Bershady & Gallagher (2000b) have shown that galaxy mergers have both high asymmetries and high HI line width asymmetries.
Our method for computing the CAS parameters is slightly different from that in previous works. Because we are examining nearby bright galaxies in a general field survey, our sample was not specifically selected to be clean of foreground and background contamination. Our sample therefore represents a more generalised case for measuring asymmetries in field surveys of nearby galaxies. For each galaxy we use a SExtractor (Bertin & Arnouts, 1996) segmentation map to replace all nearby objects with the sky, using the same noise properties as measured directly from the background. In this way we eliminate the possible contamination of the asymmetry measurement by these objects. This method is however not always perfect when there are very nearby bright stars or large galaxies. We must therefore keep in mind that any sample of highly asymmetric galaxies may be contaminated by galaxies that have an intrinsically low asymmetry, but whose asymmetry measurement was corrupted by a nearby object.
3. Results
3.1. The Asymmetry Distribution
Figure 2 shows the distribution of asymmetries for both the Schade et al. (1995) and CAS methods: we plot the fraction on the ordinate logarithmically, in order to emphasise the small number of more asymmetric galaxies.
For the index we find that the asymmetry distribution peaks at , with a long tail of more asymmetric objects. Following the definitions of Patton et al. (2005), ()% of galaxies are ‘asymmetric’ () and ()% are ‘highly asymmetric’ (). However, unlike the CAS indices, has not been calibrated to specifically identify merging systems or merger remnants. Visual examination of the % most asymmetric objects (by the criterion) shows that about 1/3 are in close pairs, 1/3 seem to be merger remnants and the rest appear to be edge-on galaxies or classical irregulars and late-type spirals (see also section below).
Among the close pairs with projected separation of less than kpc we find that ()% are ‘asymmetric’ and ()% are ‘highly asymmetric’. The pair fractions and merging pair fractions (assuming that 50% of the pairs actually merge) are in good agreement with the values derived by Patton et al. (2005), but we find a much larger fraction of asymmetric or highly asymmetric isolated galaxies. This is likely due to the relatively small sample of isolated galaxies in Patton et al. (2005), the lower physical resolution of the comparatively shallow HST imaging used (leading to a smoothing of the low surface brightness brightness asymmetric features), different isolation criteria used and treatment of segmentation maps.
The CAS method defines galaxies with as unusually asymmetric: Conselice et al. (2000a) suggest that such objects may be interpreted as merger remnants. The distribution of CAS values in Figure 2 peaks at , suggesting that is sensitive to relatively minor deviations from symmetry. We find that ()% of our sample have with this blind selection. At face value, and assuming that % of the close pairs (with separation less than kpc) merge, this is about a factor of two larger than the ‘merging pair’ fraction. However, before we draw any conclusions regarding possible discrepancies between the two methods we will need to evaluate more carefully what types of objects have been selected by the cut.
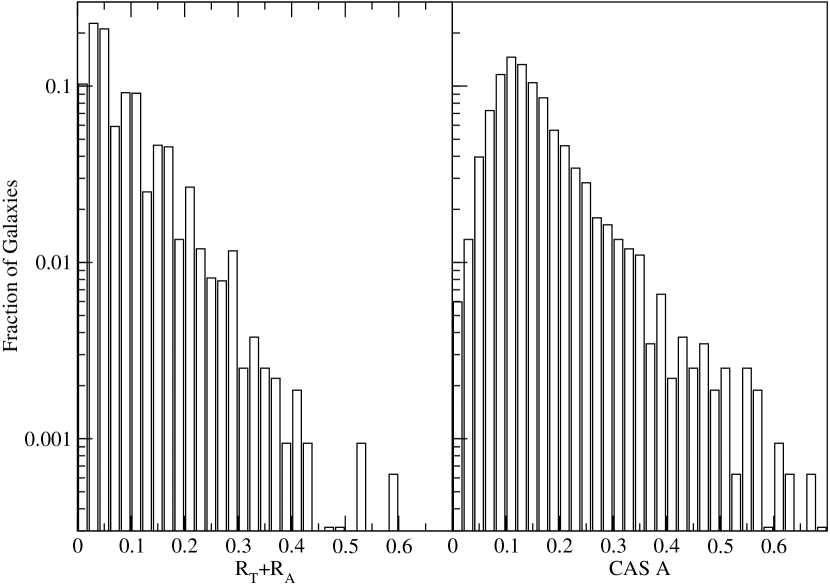
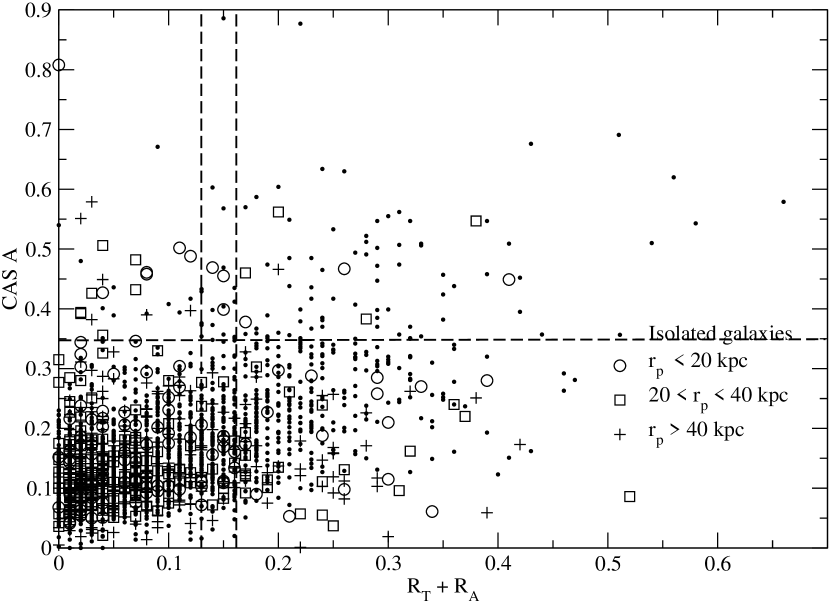
Figure 3 compares asymmetry measurements for galaxies in various isolation classes (from close pairs to galaxies we regard as being isolated) for both CAS and and shows the limits used to distinguish asymmetric or highly asymmetric galaxies for both methods. Not surprisingly, thresholds appears to be considerably less stringent than CAS , although there is a broad relation between the two indices. One can see that there are several galaxies in close pairs with separations less than kpc above the line, as well as numerous isolated galaxies, while only a few pairs with larger separation have high CAS asymmetry. There are numerous objects deemed as highly asymmetric by the index, but with . In most cases, these are edge-on or late-type spirals which have not been decontaminated from the sample as we do for the high systems.
3.2. The Nature of Asymmetric Galaxies
A blind study such as this requires that we examine by eye those systems which are asymmetric. There are two reasons why one should not simply assume that all MGC galaxies with are imminent mergers or merger remnants. First of all, as pointed out in Section 2.3, the sample may contain objects whose asymmetry measurements have been corrupted by nearby bright/large objects. Secondly, the value of (Conselice, 2003) was established using the sample of normal nearby galaxies of Frei et al. (1996) and a collection of starburst galaxies, which were selected to span a large range of morphological types. In contrast, here we are using a volume-limited sample. Also, although the CAS is reasonably robust, it does depend on the physical resolution of the data (Conselice et al., 2000a; Conselice, 2003). Therefore we have visually examined all galaxies with in our sample and classified them into the following categories:
-
•
Likely merger remnants: although this is a somewhat subjective classification, these objects appear to be relatively obvious ‘trainwrecks’ or very disturbed disks with multiple, similarly bright light components. We find objects in this category, and we show MGC postage stamp images of these galaxies in Figure 4.
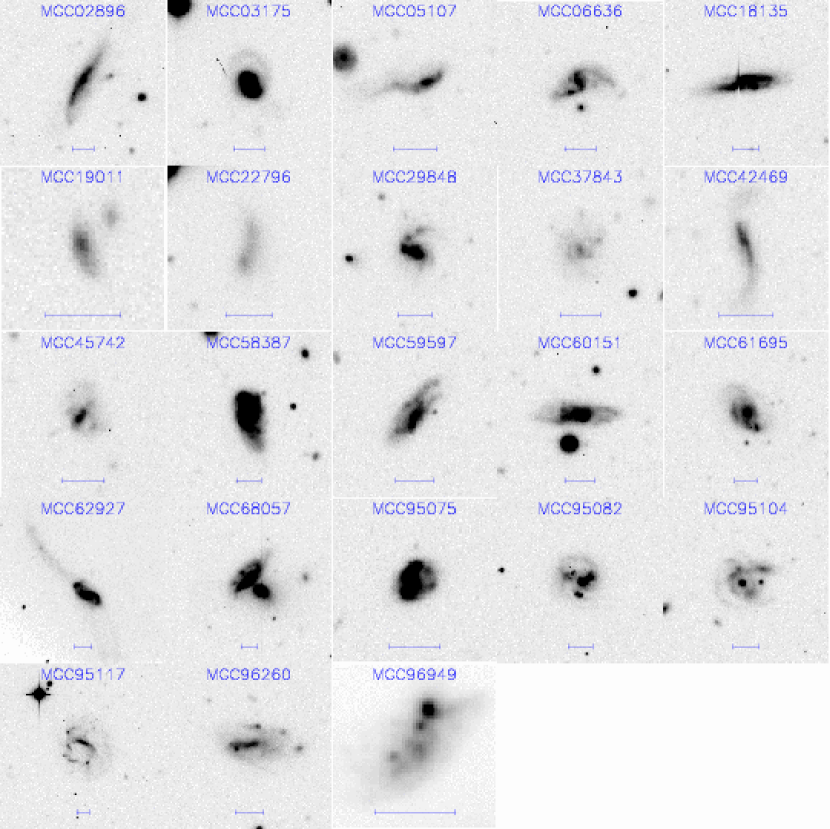
Figure 4.— Postage stamp MGC images of galaxies with which are regarded as merger remnants. The scale of each image is indicated by the horizontal bar which is arcsec. -
•
Likely imminent mergers: these are disturbed galaxies similar in appearance to the above, but satisfying two additional requirements: (i) they are a member of a close pair as identified above, i.e. have a ‘major’ companion; (ii) they show evidence of interaction with their companion. We find such objects and show their images in Figure 5. The projected separation to the companion, , in this sample ranges from to kpc.
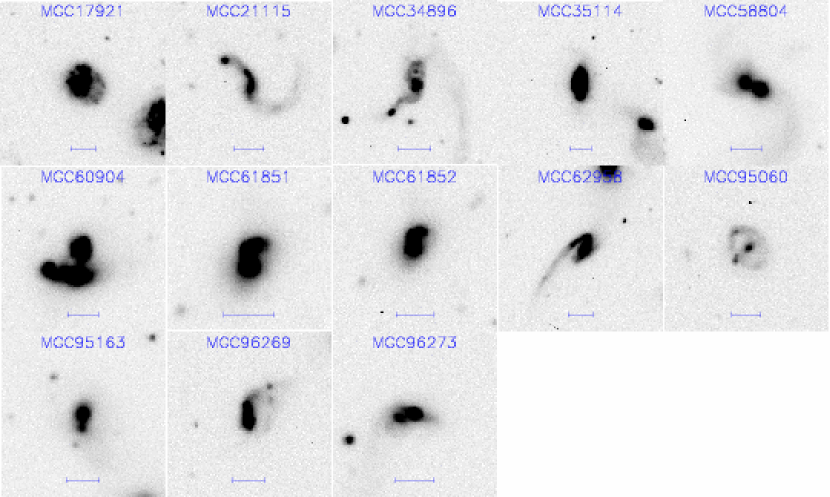
Figure 5.— As Figure 4 but for galaxies with regarded as imminent mergers. -
•
Other: there are 8 galaxies that are not imminent mergers and whose asymmetry measurements are not contaminated (see below). However, 4 of these galaxies are faint and/or low surface brightness objects which we cannot reliably classify, and all of these look unusual and could be merger remnants. In contrast, the other 4 galaxies in this category are most likely not recent merger remnants: one is a face-on disk, one is a spheroidal galaxy (with some low-level debris nearby), and the other two are minor mergers (as determined from the full MGC catalogue).
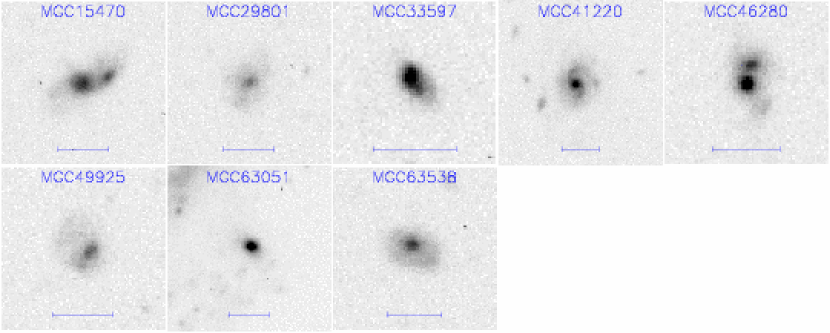
Figure 6.— As Figure 4 but for galaxies with which cannot be reliably classified. -
•
Contaminated: galaxies where the asymmetry appears to be due to the presence of a bright star in the vicinity. galaxies are thus affected. Furthermore, for 57 galaxies SExtractctor did not construct correct segmentation maps, which led to erroneously high CAS values. If these objects are (wrongly) included in the sample of highly asymmetric galaxies they account for 50% of the sample. Hence, without paying particular attention to the construction of the segmentation maps, and/or visual vetting of the sample, a large fraction of galaxies turn out to be false positive mergers.
If we exclude objects with contaminated measurements and with bad segmentation maps, we find that % of the asymmetric galaxies in our sample are obvious imminent or recent mergers. The status of the remainder is more uncertain. However of the remaining 8 systems, four are possible merger remnants.
We note that over half of all systems initially found with were contaminated by stars, or were over-segmented. This demonstrates that vetting of asymmetry selected merger samples is advisable (see also Conselice 2003). Although contamination by stars is less of a problem at high redshifts, where, presumably, the asymmetry index will be applied in future surveys, contamination by neighbouring unrelated galaxies may be an issue (e.g. Kampczyk et al., 2007).
As noted above, we found from our visual inspections that of our initial sample of galaxies were asymmetric due to Sextractor having produced bad segmentation maps for these objects. Most of these were late-type, face-on or edge-on spirals with prominent star-forming regions and/or spiral arms, and SExtractor falsely separated these into multiple sources. As noted in Section 2.3, the CAS code attempts to avoid the corruption of a galaxy’s CAS parameters through nearby objects by replacing these with blank sky. In the case of the shredded galaxies this procedure created ‘holes’ in their light distribution and hence artificially high asymmetries. To deal with this we re-ran the CAS code on all galaxies without using any segmentation maps at all. Each galaxy was then assigned the smaller value from the two runs, and galaxies went from to .
Hence, in order to avoid significant contamination of high-asymmetry samples with late-type disks in future large surveys (where visual inspection will be unfeasible), care must be taken when constructing the segmentation maps and/or when masking neighbouring objects.
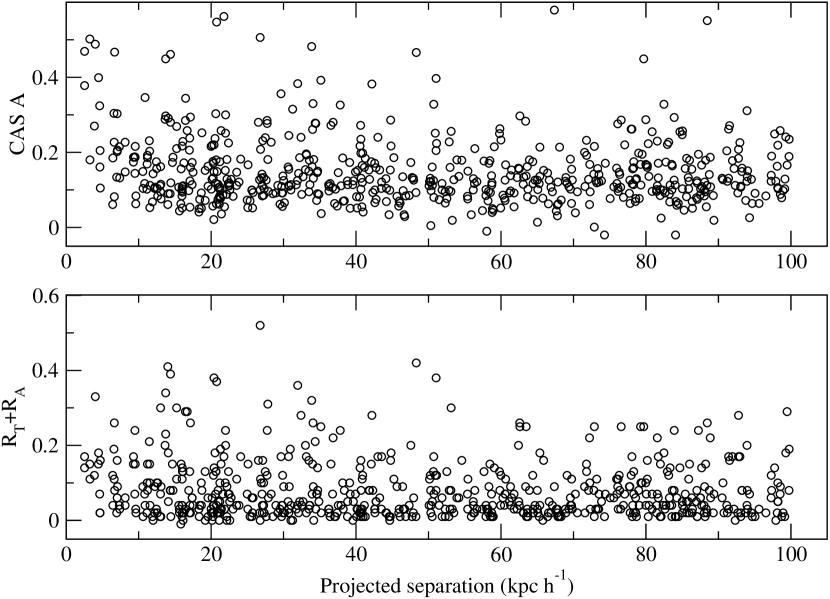
3.3. Asymmetry and Pair Separation
Figure 7 shows the values of and CAS for galaxies in pairs, plotted against the projected separation of the pair members. Galaxies in pairs with kpc clearly show an excess asymmetry over galaxies in pairs with wider separations. This appears to confirm the findings of Hernández-Toledo et al. (2005) and Patton et al. (2005) that being in a close pair induces asymmetries (via tidal stresses and star formation). Hence there is no doubt that at least a fraction of the close pairs consist of physically bound objects undergoing an interaction.
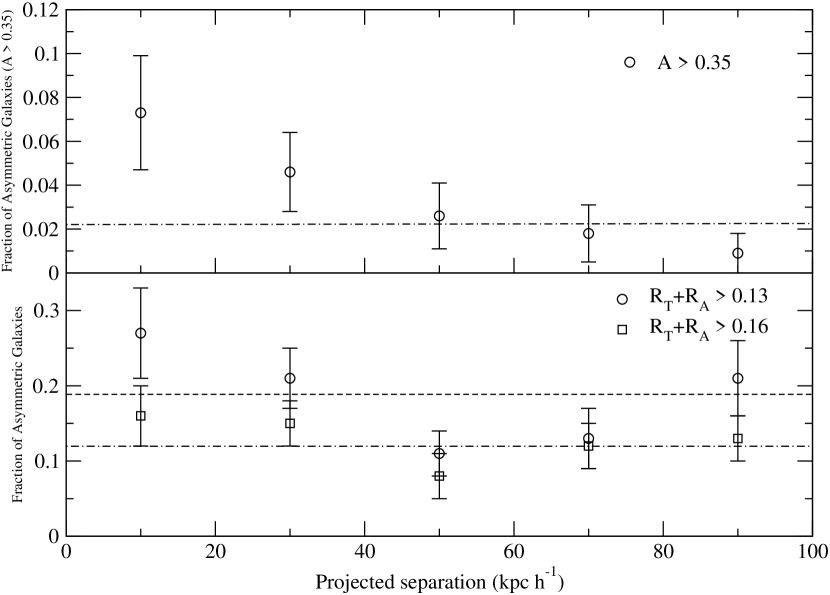
In order to show this more clearly we plot the fraction of ‘asymmetric’ galaxies vs. pair separation for five kpc wide bins of projected separation in Figure 8. We also indicate the fraction of asymmetric galaxies (according to both methods) among the isolated galaxies. The fraction of asymmetric galaxies increases with decreasing pair separation, consistent with the interpretation that closer pairs result in a progressively stronger interaction.
We also compare the cumulative distribution of asymmetries for the five projected separation bins used above, and for isolated galaxies in Figure 9. As implied by Figures 7 and 8, we see an excess of asymmetric galaxies over the distribution for isolated galaxies only in the two lowest separation bins. However, in the smallest separation bin, there is an excess fraction of asymmetric galaxies even at the highest asymmetries. This implies that, at least in the closer pairs, we are witnessing a significant degree of morphological disturbance.
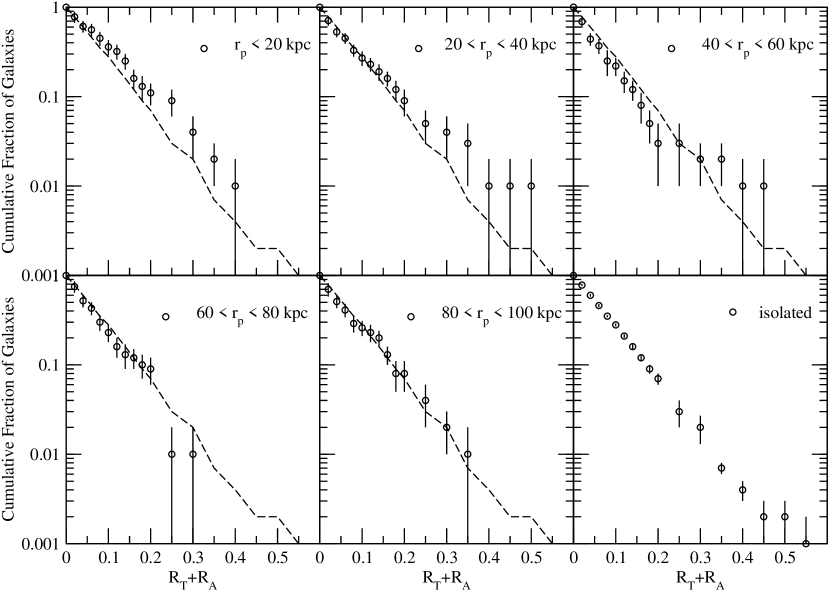
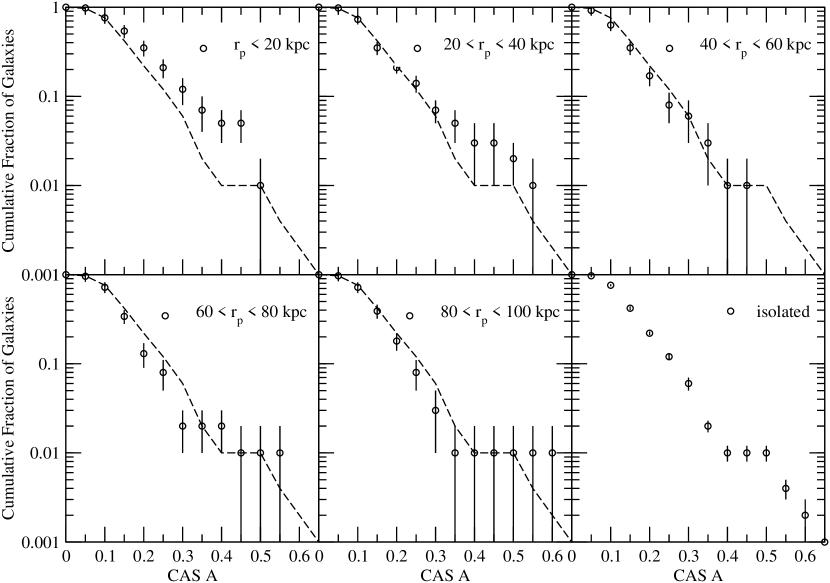
While these figures show that is also capable of identifying mergers and merger remnants, this index has not been calibrated with the same thoroughness as the CAS index, where extensive work has been carried out by Conselice and collaborators. For this reason, from now on, we use the CAS index exclusively to derive the merger rate and compare to the pair fractions.
By comparing the differential CAS distribution of isolated galaxies with that of galaxies in close pairs with kpc we can derive a limit on the fraction, , of unphysical pairs in this sample. For our purposes, we assume (or define) galaxies in ‘unphysical’ pairs to be those that have the same distribution as isolated galaxies. This calculation will give us therefore a lower limit on the fraction of paired galaxies that are in interacting systems. We denote the normalised differential distribution of isolated galaxies by , and the unknown distribution of galaxies in true, physical pairs as . Hence the normalised distribution of all apparent galaxy pairs with kpc can be written as: . Since must lie in the range and since for all , we find that must hold for all . By comparing the observed distributions and we find that the maximum value of for which this condition still holds is , where this constraint is driven by the low- end of the distributions () as expected. In other words, of all galaxies in dynamically close pairs with kpc at least % lie in physical pairs. This compares well with the fraction of % estimated by Patton et al. (2000), and we will use this number in the following calculations.
4. Pair and Asymmetry Merger Time-scales: Implications for the Merger Fraction and Galaxy Evolution
We are now in a position to calculate the merger time-scale and fraction for close pairs and asymmetry-selected galaxies, and compare the lifetime of the merger remnant to the merger time-scale for the progenitor pair.
In Section 3.3 we found that only pairs with small separation ( kpc) are likely to merge within a short time interval, and that among these the majority of likely mergers are found among pairs with kpc (based on the presence of asymmetries as an indicator of an on-going interaction). To a first approximation the close pair fraction for these latter objects can give a measure of the merger rate. We find that the pair fraction is ()%. In order to correct for pairs which are missed because of redshift incompleteness we adopt the incompleteness correction calculated by De Propris et al. (2005) for MGC close pairs with kpc, yielding a close pair fraction of ()%. Assuming that % of these close pairs are likely to be physical pairs and hence future mergers, we derive a merger fraction of ()% for our volume-limited sample.
In Section 3.2 we found that high asymmetry identifies both merger remnants and to a lesser extent future mergers. To derive a merger fraction that is directly comparable to the one derived from the close pairs above (which is essentially a ‘progenitor galaxy’ fraction), we must take into account that each merger remnant was produced by (at least) two progenitor galaxies and hence count it twice. In addition we apply the above incompleteness correction to the objects in pairs with kpc. This yields a galaxy merger fraction of ()%.
The similarity between the merger fractions derived by these two methods suggests that the total time-scale for asymmetry (i.e. including the pre-merger phase) is similar to the merger time-scale of a kpc pair. We can determine the pre- and post-merger fraction of the total asymmetry time by comparing the number of imminent mergers (corrected for redshift incompleteness) with the number of merger remnants () identified by asymmetry. We deduce that the pre-merger phase takes up % of the total asymmetry time, consistent with results derived from N-body simulations (Conselice 2006). We notice, however, that there are several galaxies in pairs with that have large separations (some as large as 34 kpc). It is likely that these objects are on parabolic or hyperbolic orbits or may not merge until after several more passages.
The general picture that emerges from these results is the following: close pair selection (with kpc) is sensitive to most stages of the ‘pre-merger’. From dynamical friction considerations (see equation 7 in Conselice 2006) we find that the merger time-scale for a ‘typical’ close pair in our sample, with average separation of kpc and average velocity separation of km s-1 is about Gyr. Being in a close (physical) pair enhances asymmetry and during the last % (or Myr) of this pre-merger phase the asymmetry has become so significant that the imminent merger is selected by the cut. The total asymmetry time is much longer than this because the remnant remains asymmetric for Gyr after the two systems merge, and the new system dynamically relaxes (Conselice, 2006). Hence, as implied by N-body simulations, asymmetry identifies the immediate pre-merger stage as well as an extended post-merger phase. While the absolute time-scales above are quite uncertain their ratios are not, but are fixed by our results, i.e., if the merger time-scale is revised to Gyr then the asymmetry time-scales must also change accordingly.
A comparison with theoretical predictions is somewhat difficult, as there may not be a one-to-one correspondence between galaxies and their host dark haloes (see, e.g., Berrier et al. 2006). With this caveat, Maller et al. (2006) predict a merger rate of mergers per Gyr for massive galaxies with mass ratio 1:1 to 1:3. From our data we find that % of the MGC pairs consist of galaxies within this mass ratio, yielding a pair fraction of . The merger rate we derive is marginally consistent with the above prediction for a merger time-scale of Gyr or too low by a factor of for a time-scale of Gyr, similar to the comparison shown by Bell et al. (2006 – their figure 2) from theoretical models.
The merger rate we derive, following equation 3 of Lin et al. (2004), is Mpc-3 Gyr-1. Strictly speaking this is a lower limit, as some pairs are certainly missed, but it should be a fair estimate of the major merger rate for nearly equal luminosity pairs, which are less incomplete. For comparison, Lin et al. (2004) derive an average merger rate of at for galaxies with , which is about one order of magnitude lower than that derived by Conselice (2003), but in good agreement with our value. It is much larger, by almost two order of magnitude, than the merger rate between luminous red galaxies at measured by Masjedi et al. (2006), suggesting that the majority of mergers between galaxies in the universe are not ‘dry’ (c.f. Blanton, 2006). Our results are consistent with a flat evolution of the merger rate, i.e., as (Lin et al., 2004) rather than the dependence expected from CDM models (Gottlöber, Klypin & Kravtsov 2001, but see discussion by Berrier et al. 2006). If the merger rate evolution is flat out to only a small fraction of massive galaxies can have formed via major mergers in the last 1/2 of the Hubble time.
5. Summary
In this paper we have compared the close pair fraction and the fraction of asymmetric galaxies in a volume-limited sample of galaxies drawn from the MGC. Our sample consists of galaxies between mag and . The main conclusions of this work are:
-
•
The CAS selection for mergers, , after correction for contamination, is highly successful at locating galaxies in major mergers with a corrected fraction of %. The use of a blind selection however can result in many false positives. To create a clean merger sample selected with the asymmetry index it is necessary to either visually examine all high- galaxies, or use other automated methods, such as a high clumpiness (Conselice, 2003), and axis ratios to remove contamination.
-
•
We find a connection between pairs and asymmetry. Galaxies in pairs tend to be more asymmetric and the asymmetry tends to increase with decreasing pair separation, implying that these galaxies are actually interacting. We estimate that at the very least % of galaxies in close pairs with projected separation of less than kpc are actually physically bound based on their excess distortion compared to isolated galaxies.
-
•
The overlap between our close pair and asymmetry-selected merger samples is small. Of all galaxies in pairs with projected separation less than kpc only % were identified as likely merger events by the asymmetry method. Hence it is likely that the pair and asymmetry methods are tracing somewhat different phases and perhaps mass ratios of merging galaxies, while some objects in pairs are not asymmetric enough to be tagged by the CAS indices.
-
•
We find that after correcting the close pair sample for chance superpositions and the asymmetry sample for contamination (by stars, and most importantly bad segmentation maps) that the merger fraction and rate for the two methods are very similar. This suggest that both methods are tracing the same underlying merger process, although at somewhat different phases of the merger process.
-
•
Once we have accounted for contamination and incompleteness in both methods we derive a consistent merger fraction of per Gyr and a merger rate of Mpc-3 Gyr-1.
Acknowledgements
The Millennium Galaxy Catalogue consists of imaging data from the Isaac Newton Telescope obtained through the ING Wide Field Camera Survey programme. The INT is operated on the island of La Palma by the Isaac Newton Group in the Spanish Observatorio del Roque de los Muchachos of the Instituto de Astrofísica de Canarias. Spectroscopic data come from the Anglo-Australian Telescope, the ANU 2.3m, the ESO New Technology Telescope, the Telescopio Nazionale Galileo and the Gemini North Telescope. The survey has been supported through grants from Particle Physics and Astronomy Research Council (UK) and the Australian Research Council. RDeP and CJC also acknowledge grants from PPARC at the University of Bristol and at the University of Nottingham. DRP gratefully acknowledges support from the Natural Sciences and Engineering Research Council of Canada. The data and data products are available from http://www.eso.org/jliske/mgc or on request from JL or SPD.
References
- (1)
- Abazajian et al. (2003) Abazajian, K., et al. 2003, AJ, 126, 2081
- Allen et al. (2006) Allen, P. D., Driver, S. P., Graham, A. W., Cameron, E., Liske, J., De Propris, R. 2006, MNRAS, 371, 2
- Arp (1966) Arp, H. 1966, ApJS, 14, 1
- Barnes (1988) Barnes, J. 1988, ApJ, 331, 699
- Baugh (2006) Baugh, C. M. 2006, Reports on Progress in Physics, 69, 3101
- Bell et al. (2006) Bell, E. F., Phleps, S., Somerville, R. S., Wolf, C., Borch, A., Meisenheimer, K. 2006, ApJ, 652, 270
- Berrier et al. (2006) Berrier, J. C., Bullock, J. S., Barton, E. J., Guenther, H. D., Zentner, A. R., Wechsler, R. H. 2006, ApJ, 652, 56
- Bershady et al. (2000) Bershady, M., Jangren, A., Conselice, C. J. 2000, AJ, 119, 2695
- Bertin & Arnouts (1996) Bertin, E., & Arnouts, S. 1996, A&AS, 117, 393
- Blanton (2006) Blanton, M. 2006, ApJ, 648, 268
- Bridge et al. (2007) Bridge, C. R., et al. 2007, astro-ph/0701040
- Carlberg et al. (1994) Carlberg, R. G., Pritchet, C. J., Infante, L. 1994, ApJ, 435, 540
- Colless et al. (2001) Colless, M. M., et al. 2001, MNRAS, 328, 1039
- Conselice et al. (2000a) Conselice, C. J., Bershady, M., Jangren, A. 2000a, ApJ, 529, 886
- Conselice et al. (2000b) Conselice, C. J., Bershady, M., Gallagher, J. 2000b, A&A, 354, 21L
- Conselice (2003) Conselice, C. J. 2003, ApJS, 147, 1
- Conselice et al. (2003) Conselice, C. J., Bershady, M. A., Dickinson, M., Papovich, C. 2003, AJ, 126, 1183
- Conselice et al. (2004) Conselice, C. J., et al. 2004, ApJ, 600, L139
- Conselice et al. (2005) Conselice, C. J., Blackburne, J.A., Papovich, C. 2005, ApJ, 620, 564
- Conselice (2006) Conselice, C. J. 2006, ApJ, 638, 686
- De Propris et al. (2005) De Propris, R., Liske, J., Driver, S. P., Allen, P. D., Cross, N. J. G. 2005, AJ, 130, 1516
- Driver et al. (2005) Driver, S. P., Liske, J., Cross, N. J. G., De Propris, R., Allen, P. D. 2005, MNRAS, 360, 81
- Frei et al. (1996) Frei, Z., Guhathakurta, P., Gunn, J. E., Tyson, J. A. 1996, AJ, 111, 174
- Gottlöber, Klypin & Kravtsov (2001) Gottlöber, S., Klypin, A. A. & Kravtsov, A. V. 2001, ApJ, 546, 223
- Hawkins et al (2003) Hawkins, E., et al. 2003, MNRAS, 346, 78
- Hernández-Toledo et al. (2005) Hernández-Toledo, H. M., Avila-Reese, V., Conselice, C. J., Puerari, I. 2005, AJ, 129, 682
- Kampczyk et al. (2007) Kapmczyk, P. et al. 2007, ApJS, in press (astro-ph/0611187)
- Lin et al. (2004) Lin, L., et al. 2004, ApJ, 617, L9
- Liske et al. (2003) Liske, J., Lemon, D. J., Driver, S. P., Cross, N. J. G., Couch, W. J. 2003, MNRAS, 344, 307
- Lonsdale, Farrah & Smith (2006) Lonsdale, C., Farrah, D., Smith, H. 2006, in Astrophysics update 2 ed. J. W. Mason (Springer/Praxis Books)
- Makino & Hut (1997) Makino, J., & Hut, P. 1997, ApJ, 481, 83
- Malin & Carter (1980) Malin, D. F., & Carter, D. 1980, Nature, 285, 643
- Malin & Carter (1983) Malin, D. F., & Carter, D. 1983, ApJ, 274, 543
- Maller et al. (2006) Maller, A., Katz, N, Keres, D., Davé, R., Weinberg, D. H. 2006, ApJ, 647, 763
- Masjedi et al. (2006) Masjedi, M. et al. 2006, ApJ, 644, 54
- Murali et al. (2002) Murali, C., Katz, N., Hernquist, L., Weinberg, D. H., Davé, R. 2002, ApJ, 571, 1
- Patton et al. (2000) Patton, D. R., Carlberg, R. G., Marzke, R. O., Pritchet, C. J., Da Costa, L. N., Pellegrini, P. S. 2000, ApJ, 536, 153
- Patton et al. (2002) Patton, D. R., et al. 2002, ApJ, 565, 208
- Patton et al. (2005) Patton, D. R., Grant, J. K., Simard, L., Pritchet, C. J., Carlberg, R. G., Borne, K. D. 2005, AJ, 130, 2043
- Schade et al. (1995) Schade, D., Lilly, S. J., Crampton, D., Hammer, F., Le Fevre, O., Tresse, L. 1995, ApJ, 451, L1
- Simard et al. (2002) Simard, L. et al. 2002, ApJS, 142, 1
- Toomre & Toomre (1972) Toomre, A., & Toomre, J. 1972, ApJ, 178, 623
- Toomre (1977) Toomre, A. 1977 in Evolution of Galaxies and Stellar Populations, ed. B. M. Tinsley and R. B. Larson, p. 401 (New Haven: Yale University Observatory)