Analysis of Spitzer Spectra of Irradiated Planets: Evidence for Water Vapor?
Abstract
Published mid infrared spectra of transiting planets HD 209458b and HD 189733b, obtained during secondary eclipse by the InfraRed Spectrograph (IRS) aboard the Spitzer Space Telescope, are predominantly featureless. In particular these flux ratio spectra do not exhibit an expected feature arising from water vapor absorption short-ward of . Here we suggest that, in the absence of flux variability, the spectral data for HD 189733b are inconsistent with m-photometry obtained with Spitzer’s InfraRed Array Camera (IRAC), perhaps an indication of problems with the challenging reduction of the IRS spectra. The IRAC point, along with previously published secondary eclipse photometry for HD 189733b, are in good agreement with a one-dimensional model of HD 189733b that clearly shows absorption due to water vapor in the emergent spectrum. We are not able to draw firm conclusions regarding the IRS data for HD 209458b, but spectra predicted by 1D and 3D atmosphere models fit the data adequately, without adjustment of the water abundance or reliance on cloud opacity. We argue that the generally good agreement between model spectra and IRS spectra of brown dwarfs with atmospheric temperatures similar to these highly irradiated planets lends confidence in the modeling procedure.
Subject headings:
stars: planetary systems, individual (HD 189733, HD 209458), radiative transfer1. Introduction
Since the detection of the first extrasolar giant planet (EGP), 51 Peg b (Mayor & Queloz, 1995), considerable effort has gone into both observing and modeling properties of the atmospheres of the close-in “hot Jupiter” planets. The Spitzer Space Telescope now provides us a unique probe into the mid-infrared emission from these exotic atmospheres.
In this Letter we examine mid infrared spectra of transiting planets HD 209458b and HD 189733b, which were recently observed with Spitzer’s InfraRed Spectrograph (IRS) by Richardson et al. (2007) and Grillmair et al. (2007), respectively. The spectra were obtained from 7.5 to 14 m around the time of secondary eclipse. The most prominent conclusion of these works is that strong absorption arising from H2O, expected short-ward of 10 m, was not seen for either planet. Possible explanations put forward for the relatively featureless spectra included a lack of H2O in these atmospheres, masking by a continuum of opaque clouds, or an isothermal temperature structure.
Recently Knutson et al. (2007a) published an 8 m light curve for HD 189733b that includes an observation of the secondary eclipse. These observations used Spitzer’s InfraRed Array Camera (IRAC). We suggest that this data point is inconsistent with the IRS spectrum, that water vapor is present and absorbs from 6.5-10 m, and that the published, low S/N spectrum of HD 189733b may not reflect the true planet spectrum. We have computed model atmospheres and spectra of HD 189733b and HD 209458b in an effort to shed additional light on these exciting observations. We will also briefly discuss L- and T-type brown dwarfs, whose atmospheres span the same temperature range as hot Jupiters. We suggest that the generally very good fits of our models to these high signal-to-noise IRAC and IRS datasets supports the veracity of the underlying physics and chemistry of our planet models.
2. Spitzer Spectra of Planets
Two teams employed the IRS instrument in “Short-Low” configuration to obtain low resolution spectra of parent stars HD 209458 and HD 189733 around the time of planetary secondary eclipse. Each group compared the spectrum of the system when the planet’s day side was still visible (before and after the secondary eclipse) to the stellar spectrum when the planet was behind the star. The observed enhancement in flux seen when the planet was visible was attributed to the planet, thus providing a measurement of the planet-to-star flux ratio. These exciting and difficult observations are at the leading edge of spectral characterization of exoplanets.
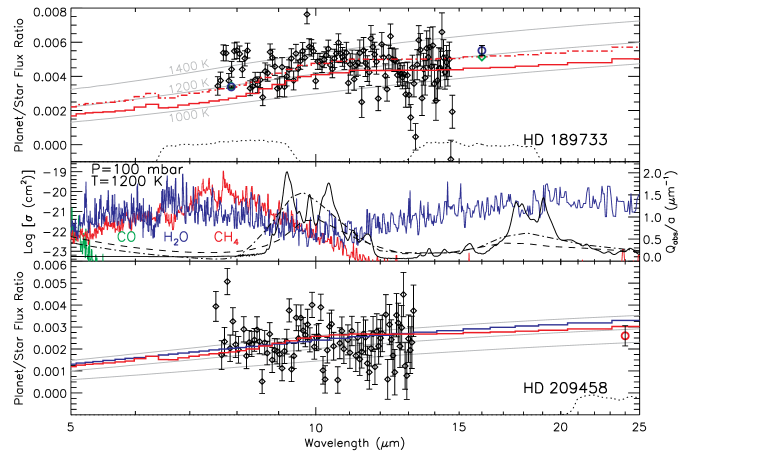
Grillmair et al. (2007) observed two secondary eclipse events of planet HD 189733b and from these observations published a planet-to-star flux ratio from 7.57 to 14.71 m. They found a flux ratio spectrum that is essentially flat across these wavelengths with a mean eclipse depth of . The subset of their data with the highest signal-to-noise is shown in Figure 1a. Richardson et al. (2007) observed two secondary eclipses of planet HD 209458b and published a flux ratio spectrum from 7.5 to 13.2 m. The derived average ratio is shown in Figure 1c. These authors also find a spectrum that could be characterized as mostly flat. However, they also detect increases in the flux ratio from 9.3-10 m, as well as a narrow emission feature at 7.7 m, which they attribute to emission from a stratosphere.
In addition to spectra, we plot Spitzer secondary eclipse photometric data. These points include the IRS blue peak-up at 16 m (Deming et al., 2006) and the IRAC 8 m point (Knutson et al., 2007a) for HD 189733b, and the Multiband Imaging Photometer for Spitzer (MIPS) point at 24 m for HD 209458b (Deming et al., 2005). We note that in Figure 1a the IRAC 8 m point clearly plots below the IRS data, which we’ll discuss in detail in §2.2.
2.1. Model Atmospheres and Spectra
In order to further the study of these observations and their constraints on the character of each planet’s atmosphere we have computed model atmospheres and generated low resolution spectra. We employ a 1D model atmosphere code that has been used for a variety of planetary and substellar objects. Recently it has been used for brown dwarfs (Marley et al., 2002; Saumon et al., 2006) and EGPs (Fortney et al., 2005, 2006b; Marley et al., 2007). It explicitly includes both incident radiation from the parent star (if present) and thermal radiation from the planet’s atmosphere. The radiative transfer solving scheme was developed by Toon et al. (1989) and was first applied to irradiated giant planet atmospheres by Marley et al. (1999). We use the elemental abundance data of Lodders (2003) and compute chemical equilibrium compositions following Lodders & Fegley (2002, 2006). Our opacity database is described in Freedman et al. (2007). The stellar models are from Kurucz (1993) and the system parameters are from Winn et al. (2007) for HD 189733b and Knutson et al. (2007b) for HD 209458b. The planet models presented here are cloud-free.
We plot model planet-to-star flux ratios in Figure 1. For HD 189733b we show two one-dimensional models. The solid red curve is for a day-side model that assumes all incident flux is efficiently redistributed over the entire planet, meaning that the incident flux is multiplied by a factor of 1/4 (Appleby & Hogan, 1984). Following conventions adopted in solar system atmosphere modeling (e.g. McKay et al., 1989), here and in our previous papers (Fortney et al., 2005, 2006b) the incident flux is decreased by incorporating a multiplicative factor of 1/2 due to the day-night average, and another factor of 1/2 arises from the mean 60∘ stellar zenith angle (, the cosine of this angle, is 0.5) that is correct for global average insolation conditions (McKay et al., 1989; Marley & McKay, 1999). With this prescription more stellar flux is absorbed at low pressures, leading to a warmer upper atmosphere and shallower temperature gradient, compared to a model where incident flux is directly multiplied by 1/4 with =1.0. The greater absorption of incident flux at lower pressure is due to the twice longer path length for incident photons to reach a given pressure. In reality, these differences in 1D models could be swamped by a more complex day-side temperature structure for these planets. Here, for models with a warmer day side, the incident flux is multiplied by a factor between 1/2 and 1, while remains 0.5. The dash-dot curve in Figure 1c is for a warmer model, where , meaning that only 20% of the absorbed incident flux is assumed to be advected to the night side. Both models predict an absorption feature due to H2O short-ward of 10 m. Figure 1b shows absorption cross sections for H2O, CO, and CH4. At these temperatures (1200 K), CO is strongly favored at the expense of CH4. The dashed model in Figure 1a is a good (1) fit to the band-averaged 8 m (Knutson et al., 2007a) and 16 m (Deming et al., 2006) secondary eclipse observations. We note that although Grillmair et al. (2007) claim their flat ratio spectrum is consistent with a blackbody, Figure 1a shows that it is actually bluer than a blackbody.
Figure 1c shows the mean Richardson et al. (2007) data set. In solid red we plot the 1D model spectrum from Fortney et al. (2005). Note that the predicted “downturn” in the ratio spectrum short-ward of 10 m is actually quite small in this 1D model, less than that predicted by other modelers (e.g., Seager et al., 2005; Burrows et al., 2006), for reasons that are not yet clear, but could be related to the angle of incident radiation. Given the S/N of this dataset and the relatively small predicted depth of the model H2O absorption feature, it is not clear that absorption due to H2O can be dismissed.
Dynamical processes can act to produce isothermal profiles in the upper atmosphere which would also suppress the depths of absorption features. In solid blue we plot the spectrum of the day side of the Cooper & Showman (2006) 3D dynamical model of HD 209458b, as computed in Fortney et al. (2006a). The isothermal atmosphere is due to a super-rotating west-to-east equatorial jet; as cool night side gas is blown around the planet’s limb this gas is more readily warmed at lower pressures where the radiative time constant is shorter (Iro et al., 2005), leading to day side P-T profiles that are more isothermal than one would predict for a radiative equilibrium model (Showman & Cooper, 2006).
Neither the 1D nor 3D model has the increase in flux ratio seen from m, as neither model has the strong temperature inversion that would be necessary to create emission features. In Figure 1b we plot the Mie absorption efficiency of 1 m silicate particles of forsterite (Mg2SiO4) and enstatite (MgSiO3). Larger particles have a grayer spectrum and do not exhibit the canonical silicate feature (Hanner et al., 1994). The location of this possible emission feature in the HD 209458b spectrum is suggestive, but it will take higher signal-to-noise observations to determine if silicates have indeed been detected. HD 209458b is a better candidate than HD 189733b for having silicate clouds in its visible atmosphere, due to the higher stellar insolation and hotter atmosphere.
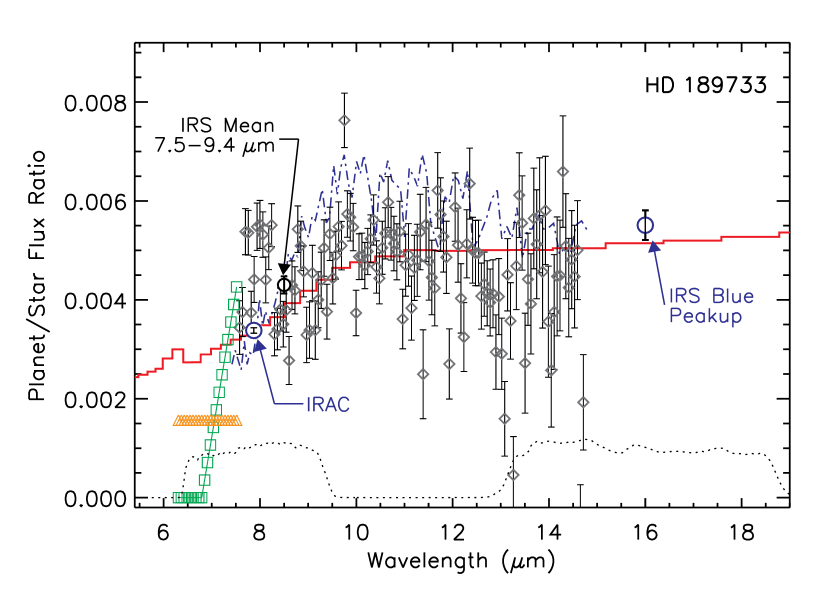
2.2. A Closer Look at HD 189733b
As was noted above and shown in Figure 1a, the IRAC observation at 8 m by Knutson et al. (2007a) indicates a downturn that is in fact consistent with H2O vapor absorption. We now take a closer look in Figure 2. Our model (red) is a good fit to the data, while in blue we show a Burrows et al. (2006) model, as taken from Grillmair et al. (2007), that appears to also be a good fit to the photometry, albeit with a much deeper water feature. Binning the 31 IRS data points from 7.57 to 9.39 m (which overlaps the IRAC band) into a single point, we find an eclipse depth of , 5.3 removed from the Knutson et al. IRAC point. If variation in planetary or stellar flux were to account for this difference (e.g. Menou et al., 2003; Rauscher et al., 2007), the variability would have to be 25% near 8 m. If there is no variability and both the IRS spectrum and IRAC data point are accurate as published, we can examine how small the flux ratio must be short-ward of the bluest IRS point at 7.57 m. We have created synthetic data with the same spectral resolution of the IRS data set. In triangles we show a constant flux ratio of 0.00156 between 6.3 m (the blue end of the IRAC filter) and 7.57 m. In boxes we show a synthetic ratio that decreases linearly from the 0.00430 binned value. The ratio must fall to zero by 6.79 m to give a band-average eclipse depth that agrees precisely with the IRAC data point.
In Figure 1b we showed that the only potential absorbers predicted from equilibrium chemistry from 6 to 10 m are H2O and CH4, neither of which possess a sharp increase in opacity short-ward of 7.7 m. With the assumption that the IRAC secondary eclipse depth is accurate, and given the severe absorption feature that would be needed just short of 7.57 m to fit this point given the IRS spectrum, we conclude that the published IRS spectrum short-ward of 10 m does not reflect the true spectrum at these wavelengths, where the IRAC data point suggests absorption by water vapor.
One possibility toward reconciling the data sets would be to shift the entire IRS spectrum downward. Indeed, for HD 209458b, Richardson et al. (2007) were unable to accurately determine the absolute depth of the secondary eclipse with the IRS, and therefore tied their spectrum to an unpublished IRAC 8 m observation of the secondary eclipse. Given this issue, the absolute depths of the Grillmair et al. (2007) data may also require a shift. However, the downward shift that would be required (25%) would lead to much poorer agreement between this data set and the Deming et al. (2006) point at 16 m. In addition, although both teams corrected for slit losses, this was only done in a gray manner. Since the point spread function is larger at longer wavelengths, it is possible that slit losses would be more pronounced at the red end of the spectrum. Greater flux at longer wavelengths, together with a downward scaling, may be able to bring the observed spectrum for HD 189733b into agreement with the photometric points. Future work on all of these data sets may be beneficial, as, for example, the relative photometry for these measurements is more than an order of magnitude more precise than IRAC’s initial specifications (Fazio et al., 2004).
3. Lessons from Brown Dwarfs
The P-T conditions encountered by the atmospheres of hot Jupiters is coincident with that found in the atmospheres of L- and T-type brown dwarfs. Although the actual P-T profiles of irradiated EGPs are of course different, the underlying atmospheric physics and chemistry are similar and indeed the actual computational models are in some cases virtually identical, such that a comparison of brown dwarf models to data can illuminate theoretical areas that are well understood.
Comparisons of our group’s models to near- and mid-infrared spectra of L- and T-dwarfs, including superb observations with the IRS, have generally found very good to excellent matches with data (Golimowski et al., 2004; Knapp et al., 2004; Cushing et al., 2006; Saumon et al., 2006; Mainzer et al., 2007; Leggett et al., 2007). Specifically our “cloudy” L-dwarf and “clear” T dwarf models (Marley et al., 2002, M. S. Marley et al. in prep.) fit the depths of the water bands lying between Y, J, H, and K bands as well as the water band (Cushing et al., 2006; Saumon et al., 2006; Mainzer et al., 2007; Cushing et al., 2007) expected in the IRS spectra of hot Jupiters. There are, however, departures from the data in regions where molecular opacities are poorly known as well as some systematic spectral shape differences in K and N bands.
Since the Marley et al. models have been demonstrated to fit the near and mid infrared data of the cloud-free T dwarfs we gain confidence in our radiative transfer (Toon et al., 1989), opacity database (Freedman et al., 2007), and chemistry calculations (Lodders & Fegley, 2002, 2006). This experience gives us confidence these areas are becoming well understood. Of course, since isolated brown dwarfs lack incident flux that drive atmospheric dynamics and photochemistry, these additional areas may remain challenging topics of hot Jupiter characterization for some time. It is in deviations from 1D or simple day/night models that these aspects will become apparent.
4. Discussion & Conclusions
The common conclusion of the Grillmair et al. (2007) and Richardson et al. (2007) secondary eclipse observations was the apparent lack of absorption due to water vapor. However, for HD 189733b we have shown that photometry indicates a planet-to-star flux ratio that is not as featureless as indicated by the published IRS data. If variability in planetary flux is to make up for this discrepancy, it must reach 25%. The apparent downturn in the flux ratio from 16 to 8 m implied by photometry is consisent with a model that predicts absorption due to water shortward of 10 m. As was shown in Figure 2, there is considerable diversity in feature depths among models, perhaps due to differences in chemistry, opacities, or treatment of incoming stellar flux.
For HD 189733b, here we have shown that our model is a good match to 8 and 16 m-band photometry. In addition, both our 1D and 3D models fit the HD 209458b observations reasonably well. Our conclusion that water vapor absorption is present in these atmospheres is supported by the recent analysis of the Knutson et al. (2007b) transit data set by Barman (2007), who concluded that water absorption in present in the atmosphere of HD 209458b in a band at nm. Of course the characterization of the atmospheres of these planets is just beginning. Both planets have been observed in all 4 IRAC bands, but this data has not yet been published. Additional IRS spectroscopic observations for HD 209458b (Deming and collaborators) and HD 189733b (Grillmair and collaborators) will be obtained this year. Importantly, these observations will go down to 5.5 m, fully overlapping the IRAC 8 m band, which will allow for more accurate normalization of the obtained spectra.
We thank J. Richardson, M. Cushing, D. Deming, C. Grillmair, D. Charbonneau, and the referee for useful discussions. J. J. F. acknowledges the support of a Spitzer Fellowship from NASA and M. S. M. from the NASA Origins and Planetary Atmospheres Programs.
References
- Appleby & Hogan (1984) Appleby, J. F. & Hogan, J. S. 1984, Icarus, 59, 336
- Barman (2007) Barman, T. 2007, ApJ, 661, L191
- Burrows et al. (2006) Burrows, A., Sudarsky, D., & Hubeny, I. 2006, ApJ, 650, 1140
- Cooper & Showman (2006) Cooper, C. S. & Showman, A. P. 2006, ApJ, 649, 1048
- Cushing et al. (2006) Cushing, M. C., et al. 2006, ApJ, 648, 614
- Cushing et al. (2007) Cushing, M. C., et al. 2007, ApJ, submitted
- Deming et al. (2006) Deming, D., Harrington, J., Seager, S., & Richardson, L. J. 2006, ApJ, 644, 560
- Deming et al. (2005) Deming, D., Seager, S., Richardson, L. J., & Harrington, J. 2005, Nature, 434, 740
- Fazio et al. (2004) Fazio, G. G., et al. 2004, ApJS, 154, 10
- Fortney et al. (2006a) Fortney, J. J., Cooper, C. S., Showman, A. P., Marley, M. S., & Freedman, R. S. 2006a, ApJ, 652, 746
- Fortney et al. (2005) Fortney, J. J., Marley, M. S., Lodders, K., Saumon, D., & Freedman, R. 2005, ApJ, 627, L69
- Fortney et al. (2006b) Fortney, J. J., Saumon, D., Marley, M. S., Lodders, K., & Freedman, R. S. 2006b, ApJ, 642, 495
- Freedman et al. (2007) Freedman, R. S., Marley, M. S., & Lodders, K. 2007, Submitted to ApJS
- Golimowski et al. (2004) Golimowski, D. A., et al. 2004, AJ, 127, 3516
- Grillmair et al. (2007) Grillmair, C. J., Charbonneau, D., Burrows, A., Armus, L., Stauffer, J., Meadows, V., Van Cleve, J., & Levine, D. 2007, ApJ, 658, L115
- Hanner et al. (1994) Hanner, M. S., Hackwell, J. A., Russell, R. W., & Lynch, D. K. 1994, Icarus, 112, 490
- Iro et al. (2005) Iro, N., Bezard, B., & Guillot, T. 2005, A&A, 436, 719
- Knapp et al. (2004) Knapp, G. R., et al. 2004, AJ, 127, 3553
- Knutson et al. (2007a) Knutson, H. A., et al. 2007a, Nature, 447, 183
- Knutson et al. (2007b) Knutson, H. A., Charbonneau, D., Noyes, R. W., Brown, T. M., & Gilliland, R. L. 2007b, ApJ, 655, 564
- Kurucz (1993) Kurucz, R. 1993, CD-ROM 13, ATLAS9 Stellar Atmosphere Programs and 2 km/s Grid (Cambridge:SAO)
- Leggett et al. (2007) Leggett, S. K., Saumon, D., Marley, M. S., Geballe, T. R., Golimowski, D. A., Stephens, D., & Fan, X. 2007, ApJ, 655, 1079
- Lodders (2003) Lodders, K. 2003, ApJ, 591, 1220
- Lodders & Fegley (2002) Lodders, K. & Fegley, B. 2002, Icarus, 155, 393
- Lodders & Fegley (2006) —. 2006, Astrophysics Update 2 (Springer Praxis Books, Berlin: Springer, 2006)
- Mainzer et al. (2007) Mainzer, A. K., et al. 2007, ApJ, 662, 1245
- Marley et al. (2007) Marley, M. S., Fortney, J., Seager, S., & Barman, T. 2007, in Protostars and Planets V, ed. B. Reipurth, D. Jewitt, & K. Keil, 733–747
- Marley et al. (1999) Marley, M. S., Gelino, C., Stephens, D., Lunine, J. I., & Freedman, R. 1999, ApJ, 513, 879
- Marley & McKay (1999) Marley, M. S. & McKay, C. P. 1999, Icarus, 138, 268
- Marley et al. (2002) Marley, M. S., Seager, S., Saumon, D., Lodders, K., Ackerman, A. S., Freedman, R. S., & Fan, X. 2002, ApJ, 568, 335
- Mayor & Queloz (1995) Mayor, M. & Queloz, D. 1995, Nature, 378, 355+
- McKay et al. (1989) McKay, C. P., Pollack, J. B., & Courtin, R. 1989, Icarus, 80, 23
- Menou et al. (2003) Menou, K., Cho, J. Y.-K., Seager, S., & Hansen, B. M. S. 2003, ApJ, 587, L113
- Rauscher et al. (2007) Rauscher, E., Menou, K., Cho, J. Y.-K., Seager, S., & Hansen, B. M. S. 2007, ApJ, 662, L115
- Richardson et al. (2007) Richardson, L. J., Deming, D., Horning, K., Seager, S., & Harrington, J. 2007, Nature, 445, 892
- Saumon et al. (2006) Saumon, D., Marley, M. S., Cushing, M. C., Leggett, S. K., Roellig, T. L., Lodders, K., & Freedman, R. S. 2006, ApJ, 647, 552
- Seager et al. (2005) Seager, S., Richardson, L. J., Hansen, B. M. S., Menou, K., Cho, J. Y.-K., & Deming, D. 2005, ApJ, 632, 1122
- Showman & Cooper (2006) Showman, A. P. & Cooper, C. S. 2006, in Tenth Anniversary of 51 Peg-b, ed. L. Arnold, F. Bouchy, & C. Moutou, 242–250
- Toon et al. (1989) Toon, O. B., McKay, C. P., Ackerman, T. P., & Santhanam, K. 1989, Journal of Geophysical Research, 94, 16287
- Winn et al. (2007) Winn, J. N., et al. 2007, AJ, 133, 1828