Charmonium at high temperature in two-flavor QCD
Abstract
We compute charmonium spectral functions in 2-flavor QCD on anisotropic lattices using the maximum entropy method. Our results suggest that the S-waves ( and ) survive up to temperatures close to , while the P-waves ( and ) melt away below .
pacs:
14.40Gx,12.38Gc,25.75NqI Introduction
The properties of hadrons or hadronic resonances above the deconfinement transition is a subject at the heart of the current experimental programme at RHIC. Questions of interest include the issue of which hadrons survive as bound states in the quark–gluon plasma, and up to which temperature; as well as the transport properties of light and heavy quarks in the plasma.
Of particular interest are charmonium states, following the suggestion Matsui:1986dk that suppression could be a probe of deconfinement. Potential model calculations using the heavy quark free energy have tended to support this picture. However, previous lattice simulations in the quenched approximation Umeda:2002vr ; Asakawa:2003re ; Datta:2003ww ; Jakovac:2006sf indicate that contrary to this, may survive up to temperatures as high as . Recently, potential model calculations using the internal energy of the heavy-quark pair have reached the same conclusion, and using the most recent lattice data Kaczmarek:2005gi these models indicate a qualitatively similar picture in the case of QCD Kaczmarek:2005gi ; Wong:2005be ; Alberico:2006vw . Support has also been provided by studies employing a real-time static potential Laine:2006ns ; Laine:2007gj and a T-matrix approach which includes scattering states Cabrera:2006wh . Note, however, that doubts have been expressed whether any potential model can satisfactorily describe the high-temperature behaviour of quarkonium correlators Mocsy:2005qw , while some recent potential model studies have questioned the survival of quarkonia Mocsy:2007yj .
There are now high-statistics data available for production at SPS Alessandro:2004ap ; Arnaldi:2007aa and RHIC Adare:2006ns , showing similar amounts of suppression at both experiments, despite the big difference in energy density. Two different scenarios have been developed to explain this result. The sequential suppression scenario Karsch:2005nk takes its cue from lattice results, suggesting that the entire observed suppression originates from feed-down from the excited 1P and 2S states, which melt shortly above , while the 1S state survives up to energy densities higher than those reached in current experiments. On the other hand, the regeneration scenario BraunMunzinger:2000px ; Thews:2000rj ; Thews:2005vj ; Grandchamp:2002wp suggests that additional charmonium is produced at RHIC energies from coalescence of and quarks originating from different pairs.
Lattice simulations with dynamical fermions (2 or 2+1 light flavors) will be one of the essential ingredients in resolving several of these issues. In the present paper, we present first results from such simulations. Preliminary results have appeared in Refs. Aarts:2006nr ; Morrin:2005zq .
Hadron properties are encoded in the spectral functions , which are related to the imaginary-time correlator according to
| (1) |
where the subscript corresponds to the different quantum numbers. The kernel is given by
| (2) |
From now on we consider zero momentum only and drop the dependence.
Spectral functions can be extracted from lattice correlators using the Maximum Entropy Method (MEM) Asakawa:2000tr . For this to work and give reliable results, it is necessary to have a sufficient number of points in the euclidean time direction: at least independent lattice points are needed. At , this implies a temporal lattice spacing fm. If the spatial lattice spacing were to be the same, a simulation with dynamical fermions on a reasonable volume would be far too expensive to carry out with current computing resources.
In order to make the simulation feasible, anisotropic lattices, with , are therefore required. However, dynamical anisotropic lattice simulations introduce additional complications not present in isotropic or quenched anisotropic simulations. The anisotropic formulation introduces two additional parameters, the bare quark and gluon anisotropies, which must be tuned so that the physical anisotropies are the same for gauge and fermion fields. In the presence of dynamical fermions, this requires a simultaneous two-dimensional tuning, which has been described and carried out in Ref. Morrin:2006tf .
In this study we attempt to determine charmonium spectral functions in 2-flavor QCD using anisotropic lattices and the Maximum Entropy Method. The MEM analysis has been performed using Bryan’s algorithm Bryan:1990 with the modified kernel recently introduced in Ref. Aarts:2007wj . We found that this greatly improved the stability and convergence properties of MEM. In Sec. II we describe our procedure and simulation parameters. In Sec. III we briefly discuss the spectrum at zero temperature, while Sec. IV contains the main body of our results above . A detailed discussion of dependence on the default model, time range, energy cutoff and statistics is given in Sec. V. Finally, in Sec. VI we discuss remaining uncertainties and give our conclusions and prospects for further work.
II Simulation details
We use the Two-plaquette Symanzik Improved gauge action Morningstar:1999dh and the fine-Wilson, coarse-Hamber-Wu fermion action Foley:2004jf with stout-link smearing Morningstar:2003gk . The process of tuning the action parameters, and the parameters used, are described in more detail in Ref. Morrin:2006tf . We have performed simulations with parameters corresponding to Run 6 in Ref. Morrin:2006tf as well as at the tuned point, which we denote Run 7. The parameters are given in Tables 1 and 2. They correspond to a spatial lattice spacing fm with a (renormalised) anisotropy . The sea quark mass corresponds to . The lattice spacing was determined from the 1P–1S splitting on the Run 7 lattice; the Run 6 lattice spacing was then determined using the 1P–1S splitting on the lattice corrected for finite volume effects.
The pseudocritical temperature was determined by measuring the Polyakov loop on lattices on Run 6. A jump in the value of was found between and 33, so we conclude that , or 205–210 MeV for both parameter sets. We have not been able to determine the pseudocritical temperature to greater precision on these lattices because of the finite lattice size. Partly for this reason, we have chosen to express our temperatures in units of MeV rather than as , as is often done in quenched studies. Since this analysis is carried out with 2 dynamical light quark flavors, there is also less need to rescale temperatures with to correct for the difference between the simulation and the real world with light quark flavors.
We have computed charmonium correlators in the pseudoscalar () and vector () channels, as well as the scalar () and axial-vector () channels. In the nonrelativistic quark model, the former two are S-waves and the latter two P-waves. In this study we have used local (unsmeared) operators,
| (3) |
where
| (4) |
and for the pseudoscalar, vector, scalar and axial-vector channel respectively. All-to-all propagators Foley:2005ac have been used to improve the signal and sample information from the entire lattice. The propagators were constructed with no eigenvectors and two noise vectors diluted in time, color and even/odd in space. On the lattices, for Run 6, we have computed correlators for two different bare quark masses, and 0.092, as the precise charm quark mass had not been determined on these lattices. Both masses are somewhat smaller than the physical charm quark mass. This may result in an underestimate of the melting temperatures for the P-waves. For Run 7 we used , tuned to reproduce the physical mass on the lattices. The bilinear operators have not been renormalised, so our results only concern the shapes of the resulting correlators and spectral functions, not their overall magnitude.
| Run | ||||||||
|---|---|---|---|---|---|---|---|---|
| 6 | 8.06 | 7.52 | 5.90 | 6.21 | 7.06GeV | 0.167fm | 5.9 | 0.08, 0.092 |
| 7 | 8.42 | 7.43 | 6.04 | 5.84 | 7.23GeV | 0.163fm | 5.9 | 0.117 |
| Run | (MeV) | ||||
| 6 | 8 | 80 | 88 | 0.42 | 250 |
| 12 | 33 | 214 | 1.02 | 80 | |
| 8 | 32 | 221 | 1.05 | 500 | |
| 12 | 32 | 221 | 1.05 | 400 | |
| 12 | 31 | 228 | 1.08 | 100 | |
| 12 | 30 | 235 | 1.12 | 100 | |
| 12 | 29 | 243 | 1.16 | 100 | |
| 12 | 28 | 252 | 1.20 | 125 | |
| 8 | 24 | 294 | 1.40 | 1000 | |
| 12 | 24 | 294 | 1.40 | 500 | |
| 8 | 20 | 353 | 1.68 | 1000 | |
| 12 | 20 | 353 | 1.68 | 1000 | |
| 8 | 18 | 392 | 1.86 | 1000 | |
| 8 | 16 | 441 | 2.09 | 1000 | |
| 12 | 16 | 441 | 2.09 | 500 | |
| 7 | 8 | 80 | 90 | 0.42 | 250 |
| 12 | 80 | 90 | 0.42 | 250 | |
| 8 | 32 | 226 | 1.05 | 1000 | |
| 8 | 24 | 301 | 1.40 | 1000 | |
| 8 | 16 | 451 | 2.09 | 1000 |
III Zero temperature
The charmonium spectrum at zero temperature () has been computed using standard spectroscopic methods, with a variational basis of smeared operators in S-, P- and D-wave channels. Preliminary results were presented in Refs. Juge:2006kk ; Juge:2005nr ; the full results will be reported elsewhere Juge:2007xx . Here we only report results for ground state S-wave (pseudoscalar, vector) and P-wave (axial, scalar) masses, which are given in Table 3.
| Run | |||||
|---|---|---|---|---|---|
| 6 | 0.080 | 2.643 | 2.689 | 3.118 | 3.018 |
| 0.092 | 2.800 | 2.835 | 3.233 | 3.209 | |
| 7 | 0.117 | 3.145 | 3.174 | 3.637 | 3.615 |

In Figure 1 we show the pseudoscalar spectral function for our lattice (, Run 7). Each spectral feature is fitted to a Gaussian with peak position , full width at half maximum . The “error” bars shown in the figure require careful interpretation. The horizontal bar’s centre and width represent and respectively, and its height represents the area of the Gaussian evaluated over the range to . The vertical error bar represents the error in this area as determined by the Bryan algorithm Bryan:1990 . The width of the horizontal bar does not correspond to the error in the peak’s position. We expect that this width is primarily determined by statistics, and will decrease as our correlators become better determined, see Sec. V.
The position of the primary peak can be seen to agree with the standard spectroscopy results within errors. The second peak at 4.1 GeV cannot be identified with the first radial excitation , which has a mass of 3.64 GeV; rather, it is most likely a combination of the 2S, 3S and 4S states, possibly with some contamination from lattice artefacts. With more statistics it should be possible to resolve these states further, as has been demonstrated in quenched QCD some time ago Yamazaki:2001er . The third bump in the spectral function is most likely a lattice artefact, corresponding to a cusp in the free lattice spectral function. As shown in the Appendix, the free spectral function has cusps at and 1.14, corresponding to 5 and 8 GeV respectively; these may merge or be pushed to higher energies in the interacting case.
We find the same picture in the vector channel. In the axial and scalar channels the spectral function is much less well determined; however, the position of the primary peak is found to agree within errors with the standard spectroscopy result also in these channels.
IV High temperature

Spectral functions just above ( MeV, ) are presented in Fig. 2. We show results in four channels, on the lattice (Run 7). To obtain these results, we used the continuum free spectral function as default model and discretised the energy integral (1) using and a cutoff ( GeV). Since the first two timeslices may contain short-distance lattice artefacts we have used at in Eq. (1). An extensive discussion on the dependence on these choices is given in Sec. V. In all channels we find a peak which is consistent with the zero-temperature ground state mass. There are indications that the vector, axial-vector and scalar masses have shifted slightly upwards, although this cannot be determined with any certainty given our current precision. The second peak at GeV is again most likely a lattice artefact, as discussed in the Appendix for the free theory. It should be noted that the proximity of this second peak may distort the shape of the primary peak. In order to fully disentangle the first peak from any lattice distortions, simulations with finer lattices are necessary. However, at this temperature the structure in the spectral functions is quite robust and, given the position of the first peaks, we are confident that they are separate features corresponding to the ground states in the respective channels.
IV.1 Reconstructed correlators

One way of determining whether or not medium modifications of hadron properties are present, is by studying reconstructed correlators Petreczky:2003js . These are correlators obtained by integrating up Eq. (1) with the spectral function obtained at some reference temperature , and the temperature-dependent kernel . If the spectral function is unchanged, the reconstructed correlator will be equal to the actual correlator , while, conversely, if this shows that the spectral function must be modified. In this procedure MEM is only used at the lowest temperature (with the largest value of ), making this analysis a robust tool for higher temperatures. As we will demonstrate shortly, we find that the conclusions drawn from the reconstructed correlators in our dynamical simulations are surprisingly close to those obtained in quenched lattice QCD studies Datta:2003ww ; Jakovac:2006sf .
Figure 3 shows the reconstructed correlator in the S-wave (vector and pseudoscalar) channels, using the spectral functions obtained at (Run 6) and 226 (Run 7) MeV (, see Fig. 2) as the reference point. In the pseudoscalar channel we see very little change: only at the highest temperature ( and 451 MeV for Run 6 and 7 respectively; ) does the reconstructed correlator differ from the actual one by more than 3% at large imaginary time. This suggests that survives relatively unscathed in the medium up to this temperature, although it cannot be ruled out that even a 2% change in the reconstructed correlator may correspond to substantial modifications in the spectral function Mocsy:2007yj . In the vector channel, somewhat larger modifications are seen, although still less than 10% at the highest temperatures. This may be related to the transport contribution which can be present in vector correlators, and is related to quark diffusion Aarts:2002cc ; Petreczky:2005nh ; Umeda:2007hy . We have also compared the pseudoscalar correlator at with the reconstructed correlator from the zero-temperature spectral function shown in Fig. 1. In that case we found no more than a 1.5% difference at large .

Figure 4 shows the reconstructed correlator in the P-wave (scalar and axial-vector) channels, again using MeV as reference temperature. Here we see much greater changes in a smaller temperature range: already at MeV () the long-distance correlator differs from the reconstructed one by 20%, while at MeV () the difference is up to 50%. If we instead use as reference temperature, we find that the MeV correlator differs from the reconstructed one by a factor 2.5 at large distances and by 20% at . We infer that there are considerable medium modifications in this channel for . Whether this corresponds to thermal broadening, a mass shift or melting of the state, will be investigated in the following.
IV.2 Temperature-dependent spectral functions
We now proceed to a discussion of temperature dependence of spectral functions in the range .
IV.2.1 Pseudoscalar channel


Figure 5 shows the pseudoscalar spectral function at various temperatures on the lattices. The peak can be seen to persist up to at least MeV (). At our highest temperature, MeV (), no peak survives for Run 7 or for the larger lattice on Run 6, while the smaller lattice on Run 6 shows a distorted peak structure with a very large uncertainty in the peak height. Since the correlators on the two volumes differ by less than 0.5%, this discrepancy is more a sign of a breakdown of MEM than a physical effect. At these high temperatures the small number of available points means that it can not be determined at present whether the disappearance of the peak signals the melting of the resonance or the failure of the maximum entropy method. Indeed, the spectral function obtained from Run 6 correlators using the same time range () and default model also exhibits no peak.
The possibility that at higher temperatures there is no bound state, but only a threshold enhancement, must also be considered. Because of the proximity of the second peak, our spectral functions are nonzero everywhere, and we are therefore not able to unambiguously distinguish the two possibilities. However, a threshold enhancement would be expected to become smaller as the temperature is increased, while we find a remarkably constant peak, consistent with a bound state. Because of these uncertainties, we are not in a position to conclude exactly when the melts. However, our results suggest that the state is bound up to MeV.
In general, we see very little volume dependence in this channel, with the data for the most part being completely compatible with the data. This is consistent with being a compact bound state with a diameter much smaller than our lattice size, and indicates that this remains the case in the plasma up to the point where it melts.
IV.2.2 Vector channel
The spectral function in the vector channel is shown in Fig. 6. We observe the same pattern as in the pseudoscalar channel. The ground state peak appears to melt around 350 MeV (, ), although it is again difficult to draw firmer conclusions, especially at higher temperature. At the highest temperature no peak is visible any more. Instead, we find nonzero spectral weight at all energies. This may be related to a transport contribution, signalling a nonzero charm diffusion coefficient. We hope to address this in the near future.

IV.2.3 Axial channel

Fig. 7 shows the temperature dependence of the axial-vector spectral function on the lattice (Run 6, ). Since the P-waves are much more sensitive to finite volume effects than the S-waves, we use the larger volume in this analysis. The ground state peak appears to survive up to MeV (, ), while at MeV (, ) there is no sign of any peak. We interpret this as a sign of the melting of somewhere in this temperature range. A more detailed study of the data reveals that by varying or it is, however, possible to reproduce a weak peak, indicating that the bound state may still not have completely disappeared at this point. Higher statistics and lattices closer to the continuum limit will be required to resolve this issue.
IV.2.4 Scalar channel

Finally, in Fig. 8 the scalar spectral function is shown for temperatures ranging from 219 MeV to 252 MeV. We see a similar pattern as in the axial channel, although the state appears to melt at somewhat lower temperature than the state: at MeV (, ) there is no sign of any surviving bound state. However, the scalar correlators are considerably noisier than the axial-vector correlators, so it is possible that we simply do not at present have sufficient statistics to obtain a signal in this channel. Indeed, given the slightly smaller change in the correlators shown in Fig. 4, a lower melting temperature seems surprising. Increased statistics will be required to resolve this issue.
V MEM systematics
In order to study the robustness of the spectral functions shown in the previous section, we now consider the dependence of the MEM output on the parameters that can be varied. This includes the default model dependence, dependence on the energy cutoff and discretisation, dependence on the time range used in the analysis and the role of finite statistics. We focus on the pseudoscalar and axial-vector spectral functions on lattices with a time extent of , since we find that the vector and scalar channels behave qualitatively similar to the pseudoscalar and axial channels respectively.
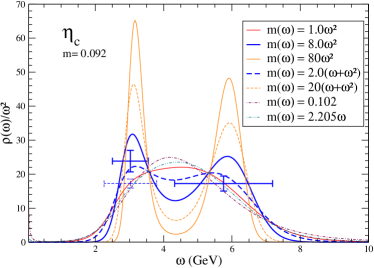
We start with a discussion of the choice of default model. Since we are primarily interested in the properties of the spectral functions in the GeV region, we have mostly used the continuum free spectral function as default model, rather than the default model proposed in Ref. Aarts:2007wj , which allows for nontrivial behaviour in the limit. At the intermediate energies considered here, we find that the two models result in the same spectral function if the same value for the model parameter is used, although the second one tends to yield lower values for , when is determined by a single parameter fit to the correlator, using Eq. (1). In addition, we have also used two other default models: and , which have very different high-energy behaviour. To assess the sensitivity of our results to the choice of default model, we have varied the parameter over a wide range. The output using these different models gives an indication of how tightly the data constrain the spectral function.


Fig. 9 (top) shows the pseudoscalar spectral function for a large class of default models. The first three default models vary in their normalisation over more than two orders of magnitude. Since the vertical axis of Fig. 9 is , these three default models could be plotted as horizontal lines, at 0.3, 8, and 80 respectively. The fourth and the fifth default model differ from the first three particularly at small . The final two default models ( and ) behave in a qualitatively different manner, as and respectively in this plot. In the absence of any input information from the euclidean correlators, the MEM output reproduces the default model. Since this is not happening here, we conclude that the MEM procedure is fairly robust against variations in the default model. In particular, we find that the leading edge of the spectral function is very robust, while also the height and position of the first peak are reasonably independent of the choice of default model.
For some choices of default models parameters (especially for larger values of ) there appears to be a middle peak just above 4 GeV, or a broadening of the primary peak. This second peak, when it appears, coincides more or less with the second peak in the zero-temperature spectral function. This is too high to correspond directly to the radial excitation, (3638MeV), but it might correspond to a radial excitation modified by medium effects and the nearby lattice doubler. However, since this peak is not reproduced for most of the parameters shown, we are cautious attaching too much physical value to it.
The energy integral (1) has been discretised with and a cutoff at . We have studied the sensitivity of the results to the cutoff by varying , while keeping fixed; in practice we find that varying does not change the results. In Fig. 9 (bottom) we show the dependence of the pseudoscalar spectral function on the energy cutoff . We find little sensitivity, provided that GeV, or .
We have performed the same analysis also on the Run 6 lattices, for both charm quark masses and both volumes, and find very little dependence on either energy cutoff or default model in this case.


In the axial-vector and scalar channel we expect finite volume effects to be significant. Therefore we will here analyse the larger lattice, .
In the top panel of Fig. 10 we show the effect of varying the default model on the axial-vector spectral functions. There is a great deal of variation, but in all cases we find either a ground state peak corresponding to the state and a second peak at GeV, or a broad structure encompassing the two, with a plateau in the middle. In this case, we cannot say with any confidence whether what we see is a bound state peak or a continuum threshold, but the presence of a structure near the mass may indicate that survives at this temperature, close to but just above , albeit possibly in a modified form. Generically, we find that the spectral function analysis is less robust for P-waves than for S-waves, which may be due to the local operators used in this study.
In the lower panel of Fig. 10 we show the effect of varying the energy cutoff on the axial-vector correlator. We see very little dependence on the cutoff, in the range shown here, but for lower energy cutoffs, GeV, the peaks become more “washed out”. We take this as evidence that although the maximum energy for free fermions is , in the interacting theory the spectral function reaches higher energies, which must be included in the integral.
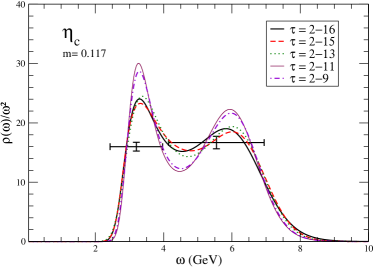


The effect of varying the time range used in the MEM analysis is shown in Fig. 11 for the pseudoscalar correlators. We find a reasonable stability in our results as long as at least 10 data points are included; for or 3 even fewer points are required to reproduce the spectral function.
We have carried out the same analysis at all temperatures, in order to try to clarify whether the presence or absence of a ground state peak is a physical effect or an artefact of the MEM. This is illustrated in Fig. 12 for the pseudoscalar channel at MeV () and MeV (). We see evidence of a surviving ground state () peak, but there is a quite strong dependence on both default model and energy cutoff, which becomes stronger as the temperature is increased. This means that our data are not sufficient to unambiguously determine whether the bound state survives at these temperatures, much less to say anything quantitative about changes to the spectral function.
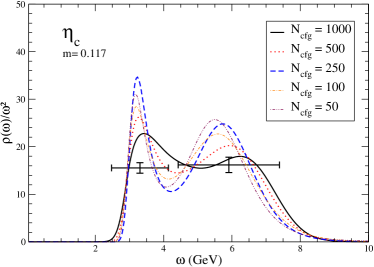

Finally, spectral functions reconstructed using MEM on a finite sample will always display a finite peak width, so the width of the peaks found here cannot be directly interpreted as a thermal width of the corresponding mesonic states. (A further limitation is given by the finite resolution offered by the singular value decomposition procedure used in our MEM analysis, but we believe we are not yet in this regime when .) One may attempt to disentangle the unphysical statistical width from a possible physical thermal width by varying the number of configurations used. Specifically, if the shape of the spectral function is found to be independent of the statistics above a certain number of configurations, one can be more confident in the physical relevance of the results.
In Fig. 13 we show the pseudoscalar spectral function on the lattice, obtained using different numbers of configurations. We see that as the number of configurations is reduced, the primary peak at first gets narrower, then remains approximately constant before broadening somewhat for the lowest statistics. The rather surprising initial narrowing may be related to the disappearance of the weak secondary peak discussed above, in which case it may be argued that the peak width for intermediate statistics is in fact a real thermal width. To test this hypothesis, we also show, in the bottom panel of Fig. 13, the spectral functions obtained from the same data but with , where we already have seen that three peaks are produced. We see that as the statistics are reduced, the middle peak vanishes, but the primary peak remains unchanged. Only for very low statistics did we find a broadening. This lends some support to the hypothesis that the middle peak is indeed related to a surviving state. However, this result must be treated with caution because of the proximity of the lattice artefact peak at GeV.
VI Discussion and conclusions
We have computed charmonium correlators at a range of different temperatures on anisotropic lattices with two light sea quark flavors. We find that the S-wave (vector and pseudoscalar) correlators remain largely unchanged as the temperature is increased up to about twice the pseudocritical temperature, or 400 MeV. The P-wave correlators, on the other hand, exhibit substantial modifications already between 220 and 250 MeV. This behaviour of the correlators is in good agreement with what has been found in quenched QCD studies Umeda:2002vr ; Asakawa:2003re ; Datta:2003ww ; Jakovac:2006sf . Using the maximum entropy method to obtain the corresponding spectral functions, our results indicate that the ground state S-wave peak survives largely unchanged up to MeV, while at our highest temperature, MeV, uncertainties in the MEM procedure prevents us from drawing any conclusion about the presence or absence of a ground state. In the axial-vector (P-wave) channel, we find that the ground state appears to melt between 240 and 250 MeV, although higher statistics will be needed to draw definite conclusions. The scalar meson appears to melt earlier, although this may be a function of limited statistics. Generically, we find that the spectral function analysis for S-waves is more robust than for P-waves, which may be related to the local operators used to represent the meson states. There is some indication that a radial S-wave excitation may survive in the plasma phase just above , but it is premature to draw any conclusions about this. Again these results are in qualitative agreement with most corresponding calculations in the quenched approximation Umeda:2002vr ; Asakawa:2003re ; Datta:2003ww ; Jakovac:2006sf .
Our results appear to be compatible with the sequential charmonium suppression scenario Karsch:2005nk , which requires that S-waves melt at while P-waves melt close to . A simple hydrodynamical model calculation based on the sequential suppression picture Gunji:2007uy gave melting temperatures of for the S-waves and for the P-waves and radial excitation. The former is quite compatible with our results, while the latter appears quite high; however, given the simplicity of the model calculation and the systematic uncertainties in our calculation, the discrepancy is relatively minor.
There are several features of this calculation which must be improved before any firm, quantitative conclusion can be reached. The most important of these relate to the use of a single, fairly coarse lattice spacing, fm and fm. As a result, we are unable to reach temperatures much beyond or 440 MeV, and our results at the highest temperatures are subject to uncertainty due to the small number of points in the imaginary-time direction. Furthermore, lattice artefacts at larger energies expected from free fermion calculations are close to the first peak representing the groundstate at lower temperatures, which complicates a straightforward interpretation. A finer lattice would help overcome both of these problems. Simulations on finer lattices, bringing the main systematic uncertainties in this study under control, are currently underway.
We also note that the fairly heavy sea quarks bring up from its physical value of 150–200 MeV Bernard:2004je ; Aoki:2006br ; Cheng:2006qk , as does the absence of a third active flavor. Lighter sea quarks will also facilitate charmonium dissociation and thus bring down the melting temperature. Simulations with lighter sea quark masses are planned.
In terms of addressing the experimental situation, two further developments are possible. Firstly, the RHIC experiment corresponds to a small but nonzero baryon chemical potential, while the calculations presented here have been carried out at zero chemical potential. It would be useful to calculate the response of the meson correlators to a small chemical potential to determine what, if any, effect this has. Secondly, and perhaps more importantly, the particles which escape from the plasma and are observed as dileptons in detectors will have nonzero (transverse) momentum, and the momentum and rapidity dependence of the yields is a crucial factor in differentiating different models Adare:2006ns ; Thews:2005vj . It is therefore important to study the temperature dependence of charmonium correlators and spectral functions also at nonzero momentum. This is currently underway.
Acknowledgements.
We thank Justin Foley for assistance with the MEM code. This work was supported by the IITAC project, funded by the Irish Higher Education Authority under PRTLI cycle 3 of the National Development Plan and funded by IRCSET award SC/03/393Y, SFI grants 04/BRG/P0266 and 04/BRG/P0275. G.A. was supported by a PPARC advanced fellowship. We are grateful to the Trinity Centre for High-Performance Computing for their support.Appendix A Free lattice spectral functions
In order to estimate lattice artefacts, we have studied meson spectral functions in the free lattice theory, following the approach of Refs. Karsch:2003wy ; Aarts:2005hg ; Aarts:2006em . Since the temporal discretisation in the fermion action used in this paper is identical to the standard Wilson fermions, most details can be found in Section 3.1 of Ref. Aarts:2005hg . Here we only list the expressions that are different.
The fermion dispersion relation is determined by
| (5) |
where in this case
| (6) |
with and . The free meson spectral functions take the same form as in Ref. Aarts:2005hg ; the only change is in the coefficient , which now reads
| (7) |
The finiteness of the Brillouin zone results in lattice artefacts in spectral functions. In particular there are cusps at , when and . The maximal energy is given by , when . For , this corresponds to cusps at and , and a maximal energy of .
References
- (1) T. Matsui and H. Satz, Phys. Lett. B178, 416 (1986).
- (2) T. Umeda, K. Nomura and H. Matsufuru, Eur. Phys. J. C39S1, 9 (2005), [hep-lat/0211003].
- (3) M. Asakawa and T. Hatsuda, Phys. Rev. Lett. 92, 012001 (2004), [hep-lat/0308034].
- (4) S. Datta, F. Karsch, P. Petreczky and I. Wetzorke, Phys. Rev. D69, 094507 (2004), [hep-lat/0312037].
- (5) A. Jakovac, P. Petreczky, K. Petrov and A. Velytsky, Phys. Rev. D75, 014506 (2007), [hep-lat/0611017].
- (6) O. Kaczmarek and F. Zantow, hep-lat/0506019.
- (7) C.-Y. Wong, hep-ph/0509088.
- (8) W. M. Alberico, A. Beraudo, A. De Pace and A. Molinari, Phys. Rev. D75, 074009 (2007), [hep-ph/0612062].
- (9) M. Laine, O. Philipsen, P. Romatschke and M. Tassler, JHEP 03, 054 (2007), [hep-ph/0611300].
- (10) M. Laine, JHEP 05, 028 (2007), [arXiv:0704.1720 [hep-ph]].
- (11) D. Cabrera and R. Rapp, hep-ph/0611134.
- (12) A. Mocsy and P. Petreczky, Phys. Rev. D73, 074007 (2006), [hep-ph/0512156].
- (13) A. Mocsy and P. Petreczky, arXiv:0705.2559 [hep-ph].
- (14) NA50, B. Alessandro et al., Eur. Phys. J. C39, 335 (2005), [hep-ex/0412036].
- (15) NA60, R. Arnaldi et al., Nucl. Phys. A783, 261 (2007), [nucl-ex/0701033].
- (16) PHENIX, A. Adare et al., Phys. Rev. Lett. 98, 232301 (2007), [nucl-ex/0611020].
- (17) F. Karsch, D. Kharzeev and H. Satz, Phys. Lett. B637, 75 (2006), [hep-ph/0512239].
- (18) P. Braun-Munzinger and J. Stachel, Phys. Lett. B490, 196 (2000), [nucl-th/0007059].
- (19) R. L. Thews, M. Schroedter and J. Rafelski, Phys. Rev. C63, 054905 (2001), [hep-ph/0007323].
- (20) R. L. Thews and M. L. Mangano, Phys. Rev. C73, 014904 (2006), [nucl-th/0505055].
- (21) L. Grandchamp and R. Rapp, Nucl. Phys. A709, 415 (2002), [hep-ph/0205305].
- (22) G. Aarts et al., PoS LAT2006, 126 (2006), [hep-lat/0610065].
- (23) R. Morrin et al., PoS LAT2005, 176 (2005), [hep-lat/0509115].
- (24) M. Asakawa, T. Hatsuda and Y. Nakahara, Prog. Part. Nucl. Phys. 46, 459 (2001), [hep-lat/0011040].
- (25) R. Morrin, A. Ó Cais, M. Peardon, S. M. Ryan and J.-I. Skullerud, Phys. Rev. D74, 014505 (2006), [hep-lat/0604021].
- (26) R. K. Bryan, Eur. Biophys. J. 18, 165 (1990).
- (27) G. Aarts, C. Allton, J. Foley, S. Hands and S. Kim, Phys. Rev. Lett. 99, 022002 (2007), [hep-lat/0703008].
- (28) C. Morningstar and M. J. Peardon, Nucl. Phys. Proc. Suppl. 83, 887 (2000), [hep-lat/9911003].
- (29) TrinLat, J. Foley, A. Ó Cais, M. Peardon and S. M. Ryan, Phys. Rev. D73, 014514 (2006), [hep-lat/0405030].
- (30) C. Morningstar and M. J. Peardon, Phys. Rev. D69, 054501 (2004), [hep-lat/0311018].
- (31) J. Foley et al., Comp. Phys. Commun. 172, 145 (2005), [hep-lat/0505023].
- (32) K. J. Juge et al., Nucl. Phys. Proc. Suppl. 153, 264 (2006).
- (33) K. J. Juge, A. Ó Cais, M. B. Oktay, M. J. Peardon and S. M. Ryan, PoS LAT2005, 029 (2005), [hep-lat/0510060].
- (34) K. J. Juge et al., Spectrum of radial, orbital and exotic excitations of charmonium, 2007, in preparation.
- (35) CP-PACS, T. Yamazaki et al., Phys. Rev. D65, 014501 (2002), [hep-lat/0105030].
- (36) P. Petreczky, S. Datta, F. Karsch and I. Wetzorke, Nucl. Phys. Proc. Suppl. 129, 596 (2004), [hep-lat/0309012].
- (37) G. Aarts and J. M. Martínez Resco, JHEP 04, 053 (2002), [hep-ph/0203177].
- (38) P. Petreczky and D. Teaney, Phys. Rev. D73, 014508 (2006), [hep-ph/0507318].
- (39) T. Umeda, Phys. Rev. D75, 094502 (2007), [hep-lat/0701005].
- (40) T. Gunji, H. Hamagaki, T. Hatsuda and T. Hirano, hep-ph/0703061.
- (41) MILC, C. Bernard et al., Phys. Rev. D71, 034504 (2005), [hep-lat/0405029].
- (42) Y. Aoki, Z. Fodor, S. D. Katz and K. K. Szabo, Phys. Lett. B643, 46 (2006), [hep-lat/0609068].
- (43) M. Cheng et al., Phys. Rev. D74, 054507 (2006), [hep-lat/0608013].
- (44) F. Karsch, E. Laermann, P. Petreczky and S. Stickan, Phys. Rev. D68, 014504 (2003), [hep-lat/0303017].
- (45) G. Aarts and J. M. Martínez Resco, Nucl. Phys. B726, 93 (2005), [hep-lat/0507004].
- (46) UKQCD, G. Aarts and J. Foley, JHEP 02, 062 (2007), [hep-lat/0612007].