Network structure of chaotic patterns
Abstract
We reduce complex stripped patterns to a basic topological network of edges and vertices to define defects and measure their influence on the pattern. We present statistics on the spatial and temporal distribution of defects within the state of spiral defect chaos state in experiments on Rayleigh Bénard convection. These measure the role of boundary influence on the dynamics, and suggest an exponential distribution for the length of edges in the pattern. We also indicate a systematic method to study hierarchies of defect interactions based on the network structure.
Topological variations represent basic changes in the connectivity within the geometric structure of a system. The mechanisms leading to topological change are often associated with physically significant events underlying the dynamics. The reduction of patterns to their discrete topological features is therefore useful in building low dimensional phenomenological models for the dynamics. In some systems, a transition between different geometric structures occurs at spatially and temporally localized regions. For example, the patterns exhibited in Rayleigh-Bénard convection are observed to transition from regular structures of parallel rolls or target patterns to complex time-dependent chaos through the formation of localized defects Croquette (1989). These defects mark regions of merger and pinch-off of the stripped patterns exhibited resulting in changes in the topology Egolf et al. (1998); Cross and Tu (1995). Understanding the dynamics of these defects is therefore important to understanding the irregular and chaotic patterns formed.
Defects highlight regions where symmetries of a pattern are broken. The identification of a defect therefore often relies on measures of symmetry. In regular convective patterns, defects have been identified by marking the variation in the phase of an underlying parallel striped pattern Kamaga et al. (2004); Semwogerere and Schatz (2002); Cross and Hohenberg (1993). Spatio-temporal chaotic systems often exhibit intricate patterns with interwoven structure. The absence of symmetries in these patterns makes it difficult to define and identify defects within the structure. In this paper, we present a technique to reduce many conventionally observed complex striped patterns to a discrete set of vertices and edges representing a graph network. This allows fluid systems to be studied using many of the techniques developed in studying complex networks.
The patterns of fluid flow during Rayleigh-Bénard convection represent among the most thoroughly studied patterns in physics Chandrasekhar (1981); Cross and Hohenberg (1993). In this system, a thin layer of fluid(with depth ) is held in a vertical thermal gradient(with temperature difference ). At a critical temperature difference, , buoyant forces overcome thermal and viscous dissipation to result in a convective instability. The temperature difference across the cell is parameterized by the non-dimensional reduced Rayleigh number, . Ideally, the velocity of the fluid is in the form of a set of parallel rolls. A two dimensional projection of this structure along the horizontal direction yields a parallel stripped pattern. The general, convection rolls form stripes that may be simply or multiply connected regions. A transition from a stationary and regular parallel striped pattern to a time dependent chaotic state known as spiral defect chaos has been observed with an increase in thermal driving Morris et al. (1993).
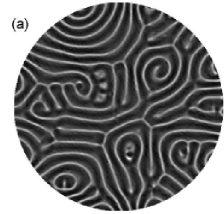
Our experiments use gaseous CO2 pressurized at as the convective fluid confined within a circular convection cell of diameter and . We study the patterns exhibited during spiral defect chaos at to demonstrate the techniques presented in this paper. This state is known as a classic example of spatio-temporal chaos. The temperature difference between hot upflows and cooler downflows are also associated with a variation in refractive index of the gas. These patterns are observed as bright and dark regions in shadowgraphic images de Bruyn et al. (1996). In the experiments, the images are captured using a digital CCD camera with a resolution of 650 pixels 515 pixels. Each gray-scale image obtained is Fourier filtered to remove optical distortions inherent in the measurement process (pixel noise within the CCD array for example) and cropped to the circular region of the convection cell. The filtered images are thresholded to their median value of intensity to produce a binary image. This threshold reduces the image to two components with equal areas representing bright and dark regions in the original image(see figure 1b).
We process each component of the binary image separately. This is done by eroding the pixels at the boundary, except when such erosion would result in connected regions breaking apart. Repeated iteration of the procedure on the components of the binary images reduces their structure to be one pixel thick. Some spurious structures also result with the formation of numerous spurs. These spurs result from a variation in the thickness/wavelength of the convective stripped patterns. These artifacts are removed by further eroding terminating pixels of the structure. This erosion is done to correspond to approximately half the wavelength of the stripped pattern. The final result of the procedure is illustrated in figure 1 where the raw experimental image(a), the thresholded image(b) as well as the skeletonized image(c) are indicated. Further details about this morphological procedure is found in Lam et al. (1992).
A limitation inherent to the technique described is that the spatial resolution of the resulting skeletonized features is one pixel. This limitation arises because the skeletonization technique applies to binary images. Sub-pixel spatial resolution may be obtained by weighting the localized regions around desired features by intensity variations in the original gray-scale images. The results reported here are robust within the current limits on spatial resolution.
The image analysis procedure outlined provides an algorithm to reduce two dimensional stripes to one dimensional lines. This skeletonized description maintains the basic topological structure of the pattern by preserving the Euler number. By construction, the one dimensional curves representing bright and dark regions do not intersect each other, however, they often self-intersect. The intersections form vertices along the one dimensional curves and are marked by circles in Figure 1c. These vertices represent regions of defect formation in the pattern. The statistics of defects may therefore be measured through those of the vertices. The shadowgraph images are thus rendered into a network of vertices(defects) and edges(convective rolls) between two defects. Lines without defects also occur in the form of loops or with termination. For the purposes of the current study, we refer to all line segments as edges.
The occurrence of only three fold vertices within the pattern places a severe constraint on the structure of the network. Similar constraints are known in other two-dimensional systems such as foam where local surface tension forces dictate the equilibrium structures or in regular hexagonal packing. In the present case, this tri-fold vertex structure arises from the hydrodynamic stability of the structure Walter et al. (2004).
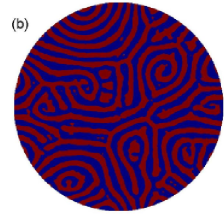
During the flow, the spatial locations of the defects change with time. Figure 2 indicates the variation in position of defects observed within the convection cell. Often, the defects are seen to glide along the convection rolls. The streaks observed in the scatter plot in Figure 2 are a result of such motion. We also observe that the number of defects is higher for dark regions. This may be because the flow is non-Boussinesq at the parameter values used. The non-Boussinesq parameter (defined in Busse (1967)) has a value of approximately close to the onset of convection indicating a break in the Boussinesq symmetry. While the number of defects shows a break in the Boussinesq symmetry, the probability distribution of the defects is symmetric as indicated in Figure 3.
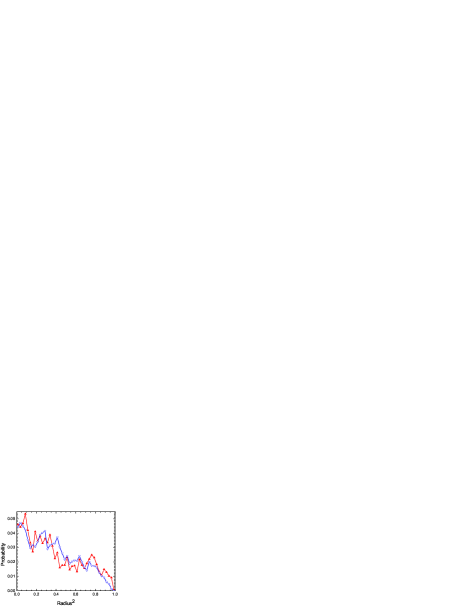
It is difficult to measure the influence of the boundaries in driving the formation of defects. The radial distribution of defect positions is shown in Figure 3. The square of the radius is used along the x-axis as the circular area considered varies quadratically with the radius. The figure shows that the density of defects increases away from the boundaries. Further we calculate that the mean radial velocity of the defects vanishes independent of their radial position, suggesting that the flux of defects moving radially inward is balanced by those moving radially outward. The probability distribution in Figure 3 is therefore stationary. The stationarity of the distribution implies there is no radially localized source/sink for defect creation/annihilation. We also note that at the aspect ratio studied, the radial distribution of defects does not attain a spatially uniform value. It would be interesting to study the aspect ratio at which a region with spatially uniform defect density is obtained. This region would reflect the defect dynamics inherent to the flow during spiral defect chaos independent of the boundaries.
In the state of spiral defect chaos, the motion of the convection rolls result in defects being continually created and annihilated. The vertices in the network constructed are created either through the formation of a new edge along an existing edge, or by the intersection of two separate edges. A vertex may be annihilated through the contraction of one of the three edges defining it. When two edges are shared between two vertices, the contraction of the shared edges results in the annihilation of a pair of vertices/defects. Similarly, progressively higher order interactions may be defined, for example, with a vertex triplet, with each vertex sharing a pair of edges with to other vertices(as in a triangle) and so on. The different processes of edge creation and annihilation occur over a range of timescales. We use a standard Particle Image Velocimetry program to identify and track the motion of individual defects during the flow piv .
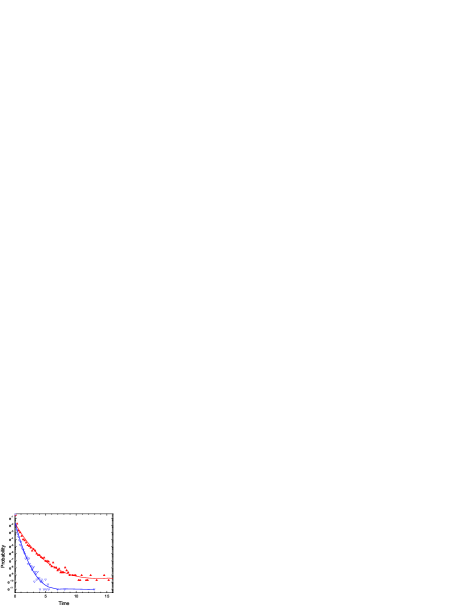
The lifetime of a defect varies inversely with the number of defects as indicated in figure 4. The temporal resolution of image capture in the experiments sets the lower bound of the lifetime measurements. We find that the logarithmic distribution of lifetimes is well fit by a cubic polynomial. The coefficient for the linear term for this fit is large in comparison to those of the quadratic and cubic term which represent small corrections. Also, the number of defects with the same lifetime is larger for bright in comparison to dark stripes in the images.
The formation of defects in Rayleigh-Bénard convection has been associated with instability mechanisms about the straight roll state. In our system, the skew-varicose instability and cross-roll instability primarily drive variations in the pattern at short and long wavelengths respectively Cross and Hohenberg (1993). The vertex description of a defect does not directly provide information on these instability mechanisms, however, it might be possible to observe differences in the network structure around the neighborhood of defect formation to suggest the type of instability mechanism involved locally.
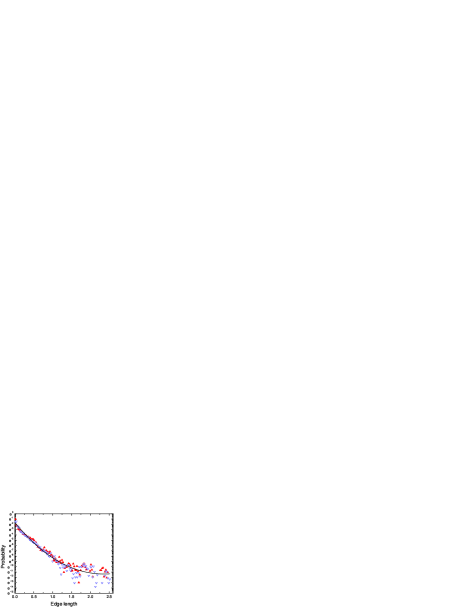
Each edge in the network is either interspersed with vertices, terminates at the boundary/bulk or very rarely forms a loop with no vertices. The edges in the graph network represent these various states of the convection rolls. The distribution of lengths of the edges is shown in figure 5. We find that the number of edges of a given length show a dominantly exponential decay with increasing length of the edges. The deviation from this behavior for edges with large lengths may be due to the finite diameter of the convection cell. The curvature of the convection rolls allow for edges of length exceeding the diameter of the cell. Since the width of bright and dark stripped patterns are similar, and their areas are equal, this also implies that the total length of the edges are equal. Figure 5 indicates that the sectioning of lengths through defect formation or termination for bright and dark regions are equivalent.
There have been many extensive investigations of defects, their identification and their role in fluid flow. Some of the interesting studies and advances have been cited within the literature referred to in this paper. Of particular interest are recent studies that report measures similar to those extracted in this paper from defect trajectories Huepe et al. (2004). Geometric diagnostics of chaotic patterns resulting from defect dynamics too have been reported Riecke and Madruga (2006). In addition, the study of patterns through different topological characterizations has been of interest. Extracting rigorous and dimension independent features from pixelated images however can be daunting. The use of computational presents one of the simplest and most easily accessible topological characterization of patterns Gameiro et al. (2004).
Our present study describes a technique to obtain a graph network for images corresponding to experimentally obtained patterns of chaotic fluid flows. These patterns are similar to those obtained from a number of other canonical systems exhibiting spatio-temporal chaos such as reaction-diffusion systems, granular systems, electro-convection in liquid crystals etc. (See Cross and Hohenberg (1993) for a review). Applying techniques described here lay a common formalism to describe these systems well into the chaotic regime. In the study presented, the patterns are reduced to graphs representing two components of the flow. The vertices of the graph are identified as defects within the pattern. A number of statistics describing the distribution of defects and their influence on the underlying network structure have been described. We have measured the lifetime of a defect and the dispersion of convection roll lengths. We have also quantified the influence of the boundaries on the spatial distribution of the defect dynamics.
References
- Croquette (1989) V. Croquette, Contemporary Physics 30, 113 (1989).
- Egolf et al. (1998) D. A. Egolf, I. V. Melnikov, and E. Bodenschatz, Phys. Rev. Lett. 80, 3228 (1998).
- Cross and Tu (1995) M. C. Cross and Y. Tu, Phys. Rev. Lett. 75, 834 (1995).
- Kamaga et al. (2004) C. Kamaga, F. Ibrahim, and M. Dennin, Physical Review E (Statistical, Nonlinear, and Soft Matter Physics) 69, 066213 (pages 6) (2004), URL http://link.aps.org/abstract/PRE/v69/e066213.
- Semwogerere and Schatz (2002) D. Semwogerere and M. F. Schatz, Phys. Rev. Lett. 88, 054501 (2002).
- Cross and Hohenberg (1993) M. C. Cross and P. C. Hohenberg, Rev. Mod. Phys. 65, 851 (1993).
- Chandrasekhar (1981) S. Chandrasekhar, Hydrodynamic and Hydromagnetic Stability (International Series of Monographs on Physics (Oxford, England)) (Dover Publications, 1981), ISBN 978-0486640716.
- Morris et al. (1993) S. W. Morris, E. Bodenschatz, D. S. Cannell, and G. Ahlers, Phys. Rev. Lett. 71, 2026 (1993).
- de Bruyn et al. (1996) J. R. de Bruyn, E. Bodenschatz, S. W. Morris, S. P. Trainoff, Y. Hu, D. S. Cannell, and G. Ahlers, Review of Scientific Instruments 67, 2043 (1996).
- Lam et al. (1992) L. Lam, S.-W. Lee, and C. Y.Suen, IEEE Transactions on Pattern analysis and Machine Intelligence 14, 869 (1992).
- Walter et al. (2004) T. Walter, W. Pesch, and E. Bodenschatz, Chaos: An Interdisciplinary Journal of Nonlinear Science 14, 933 (2004), URL http://link.aip.org/link/?CHA/14/933/1.
- Busse (1967) F. H. Busse, Journal of Fluid Mechanics 30, 625 (1967).
- (13) http://www.physics.uci.edu/~foams.
- Huepe et al. (2004) C. Huepe, H. Riecke, K. E. Daniels, and E. Bodenschatz, Chaos: An Interdisciplinary Journal of Nonlinear Science 14, 864 (2004), URL http://link.aip.org/link/?CHA/14/864/1.
- Riecke and Madruga (2006) H. Riecke and S. Madruga, Chaos: An Interdisciplinary Journal of Nonlinear Science 16, 013125 (pages 11) (2006), URL http://link.aip.org/link/?CHA/16/013125/1.
- Gameiro et al. (2004) M. Gameiro, K. Mischaikow, and W. Kalies, Phys. Rev. E 70, 035203 (2004).