Lifetime measurements of Triaxial Strongly Deformed bands in 163Tm
Abstract
With the Doppler Shift Attenuation Method, quadrupole transition moments, , were determined for the two recently proposed Triaxial Strongly Deformed (TSD) bands in 163Tm. The measured moments indicate that the deformation of these bands is larger than that of the yrast, signature partners. However, the measured values are smaller than those predicted by theory. This observation appears to be valid for TSD bands in several nuclei of the region.
pacs:
21.10.Tg, 21.60.Ev, 23.20.Lv, 27.70.+qI Introduction
The collective behavior of nuclei with a triaxial shape has attracted much attention over the years. Unfortunately, conclusive experimental signatures for such a shape have proven difficult to establish. Nevertheless, pairs of nearly degenerate bands of the same parity seen in nuclei with mass A 100 Vaman et al. (2004); Timár et al. (2006); Alcántara-Núñez et al. (2004) and A 130 Koike et al. (2003); Starosta et al. (2001); Zhu et al. (2003) have been interpreted as chiral partner bands, where breaking of the chiral symmetry is only possible for a triaxial nuclear shape. Also, rotational sequences measured in A 160 – 175 nuclei Bringel et al. (2003); Ødegård et al. (2001); Jensen et al. (2002a, b); Törmänen et al. (1999); Schönwaßer et al. (2003); Amro et al. (2003, 2001); Neußer et al. (2002); Djongolov et al. (2003); Hartley et al. (2005) have been associated with the triaxial shapes predicted by theory for this mass region. Very recently, it has been proposed that the very high spin rotational bands discovered beyond band termination in 157,158Er are also associated with the rotation of triaxial shapes Paul et al. (2007). The strongest experimental evidence for rotation of a triaxial nucleus available thus far has been found in a number of Lu isotopes, where bands with characteristic properties have been associated with the wobbling mode Ødegård et al. (2001); Jensen et al. (2002a, b); Schönwaßer et al. (2003); Amro et al. (2003). In triaxial nuclei, where different moments of inertia are associated with the three principal axes, rotation about the three axes is quantum mechanically possible. Although rotation about the axis with the largest moment of inertia is favored, the contributions from rotations about the other two axes can force the rotation angular momentum vector (R) off the principal axis to create a precession or wobbling mode of which the classical analog is the rotation of an asymmetric top. As a result, a triaxialy deformed nucleus will exhibit a family of rotational bands (with identical moments of inertia) based on the same configuration, but with different wobbling phonon number () Hagemann and Hamamoto (2003). Because the observed sequences also have relatively large deformation, they are often referred to as triaxial strongly deformed (TSD) bands.
Until very recently, the fact that wobbling had only been observed in the Lu isotopes, and not in any of the neighboring Tm, Ta and Hf nuclei of the region, remained somewhat of a puzzle. TSD bands have been reported in many of these isotopes Amro et al. (2001); Neußer et al. (2002); Djongolov et al. (2003); Hartley et al. (2005); Fetea and Fetea (2001); Roux et al. (2001), but none of them was found to exhibit deexcitation properties characteristic of wobbling. In particular, the interband transitions that provide a clear signature for wobbling in the Lu isotopes are absent. A possible resolution of the issue has recently been proposed in Ref. Pattabiraman et al. (2007), following new experimental data on the 163Tm nucleus. In this work, two strongly interacting TSD bands were identified. These sequences were found to be linked by several interband transitions. However, these connecting rays do not exhibit properties similar to the ones characteristic of wobbling. Rather, they are akin to what would be expected for collective structures associated with particle-hole (ph) excitations in a TSD well. In Ref. Pattabiraman et al. (2007), this interpretation was backed by calculations carried out within the framework of the Tilted-Axis Cranking Model. These calculations not only reproduced the experimental observables for 163Tm, but also provided a plausible explanation for the presence of wobbling bands in the 71Lu isotopes and their absence in the 69Tm, 72Hf and 73Ta neighbors. Indeed, the possibility to identify wobbling bands experimentally is restricted by the competition of these collective excitations with the ph excitations. Only if the excitation energy above the yrast line of the ph configurations is higher than the corresponding energy of the wobbling bands will the latter be fed appreciably in fusion-evaporation reactions. This appears to be the case only in 71Lu, where the Fermi surface lies on the i13/2 orbital and there is a wide gap in the proton level density.
The purpose of the present paper is two-fold. In Ref. Pattabiraman et al. (2007), the interpretation of the two 163Tm sequences as TSD bands rested solely on indirect experimental indications (such as the magnitude and evolution with frequency of the moments of inertia) and on the agreement with the calculations. Here, direct experimental evidence that the two bands are associated with a larger deformation than the yrast sequence is provided through the measurement of transition quadrupole moments. Furthermore, this work provides an additional test of the calculations through a comparison of the calculated and measured moments.
II Experiment
The experiment was performed at the Argonne Tandem Linac Accelerator System (ATLAS). A beam of 165 37Cl was used to bombard a “thick” target, which consisted of a 0.813 mg/cm2 thick 130Te layer (isotopic enrichment ) evaporated on a 15 mg/cm2 thick Au foil backed by a 15 mg/cm2 layer of Pb. The states of interest in 163Tm were fed in the reaction and their mean lifetimes were measured with the Doppler Shift Attenuation Method (DSAM). The thickness of the Au backing was chosen such that the evaporation residues came to a full stop within this Au layer, while the projectiles came to rest in the additional Pb foil.
In the six-day run, over 1.5 109 coincidence events with fold 3 (, with at least three prompt coincident rays) were collected by the Gammasphere detector array Janssens and Stephens (1996). Since the DSAM technique involves the detection of rays during the slowing down process in the thick target, the relation between the average energy shifts and detector angles needs to be determined. For this purpose, the raw data was sorted into several BLUE Cromaz et al. (2001) database files. Unlike traditional data-storage techniques for high-fold -ray coincidence events, such as the RADWARE software package Radford (1995), the BLUE database stores the data in its original fold without unfolding. Thus, each BLUE file corresponds to the ensemble of all coincidence events of a given fold, and each element in the event remains encoded not only with the -ray energy and time information, but also with the auxiliary information, , the detector identification. The specific data structure of BLUE is such that producing background-subtracted spectra at a given detector angle under specific coincidence requirements can be achieved efficiently with the method described in Ref. Starosta et al. (2003).
III Data Analysis and Results
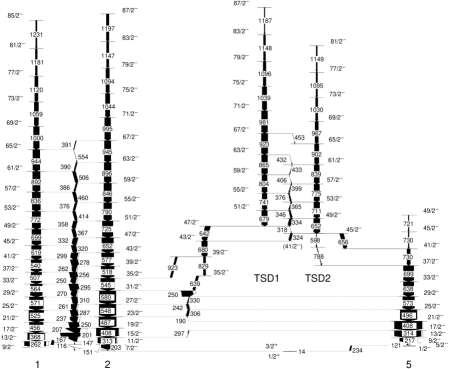
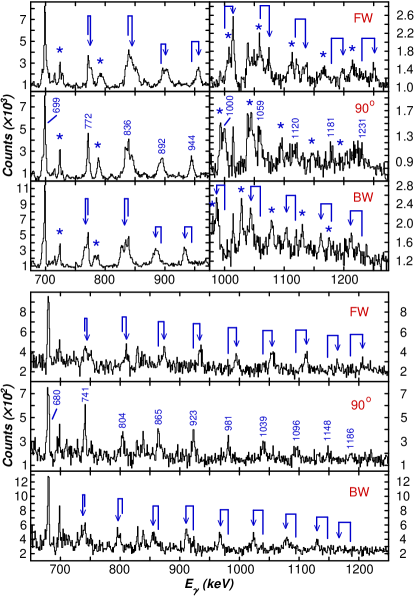
The present work focuses on four rotational bands delineated in Ref. Pattabiraman et al. (2007), and shown in Fig. 1. Hence, the nomenclature proposed in that paper has been adopted here, , the two bands associated with the configuration of normal deformation are designated as band 1 ( – sequence) and 2 ( – cascade), while the proposed triaxial bands are labeled as TSD1 ( – sequence) and TSD2 ( – cascade), respectively. From a first inspection of the coincidence data, it was established that the transitions with energy 600 in bands 1 and 2 did not exhibit any measurable shift or broadening as a function of the detector angle. In other words, these deexcitations must have occurred after the recoiling nuclei have come to rest in the Au layer of the target. These “stopped” transitions could thus be used as a starting point to obtain coincidence spectra for each band at ten detector angles, from which energy shifts would be determined. The use of ”stopped” transitions alone proved to be insufficient. Hence, angle-dependent gates had to be placed on band members in an iterative procedure starting with the lowest ray exhibiting a shift and moving up in the band one transition at each step. This procedure could be applied not only to bands 1 and 2, but also the TSD1 and TSD2 sequences since the latter deexcite into bands 1 and 2. In the process of selecting appropriate gating conditions, special care was taken to avoid numerous contaminant lines from either other 163Tm band structures or other reaction products, as well as some in-band doublet rays such as the 680- line in TSD1, for example, which corresponds both to the transition and to the transition in the decay sequence toward bands 1 and 2 Pattabiraman et al. (2007). In this context, the analysis of band TSD2 proved to be particularly challenging as it is the one most affected by the closeness in energy of many in-band transitions with either those in band 2 or other contaminant peaks. Proceeding in this careful manner, an optimized spectrum was obtained at each detector angle by summing up all clean double-gated coincidence spectra with the appropriate gating conditions. Representative spectra resulting from this analysis are presented in Fig. 2 for bands 1 and TSD1.
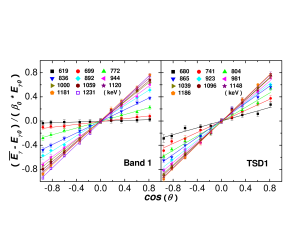
The fractions of full Doppler shift and the associated errors were subsequently extracted for transitions in the four 163Tm bands of interest through linear fits of the shifts measured at 10 angles with the expression
Moore et al. (1997). Here, for every transition is the nominal -ray energy, is the measured energy at the angle , and is the initial recoil velocity of the 163Tm residues formed in the center of the 130Te target layer. This quantity was calculated to be with the help of the stopping powers computed with the code SRIM 2003 Ziegler et al. (1985). Samples of the linear fits can be seen in Fig. 3 for bands 1 and TSD1. The resulting values are presented as a function of the -ray energy for all four bands in Fig. 4. A cursory inspection of this figure indicates two families of curves: for similar transition energies bands 1 and 2 have distinctly smaller values than bands TSD1 and TSD2. It is also worth noting that the larger uncertainties associated with band TSD2 relate to the difficulty of obtaining suitable spectra as discussed above.
The intrinsic transition quadrupole moments of the four bands were extracted from the measured values using the new Monte Carlo computer code MLIFETIME. As is usually the case in this type of analysis, a number of assumptions were made in order to compute the average recoil velocity at which the decay from a particular state occurs. These are: (1) all levels in a given band have the same transition quadrupole moment ; (2) the sidefeeding into each level in a band is modeled as a single cascade with a common, constant quadrupole moment , and characterized by the same dynamic moment of inertia as the main band into which they feed; the number of transitions in each sidefeeding band is proportional to the number of transitions in the main band above the state of interest; (3) the sidefeeding intensities are determined directly from the measured -ray intensities within the bands; and (4) a one-step delay at the top of all feeder bands was parameterized by a single lifetime .

The detailed slowing-down histories of the recoiling 163Tm ions in both the target and the Au backing were calculated using the SRIM 2003 Ziegler et al. (1985) Monte Carlo code. The initial positions and velocity vectors for each of 10,000 starting ions were calculated in a Monte Carlo fashion which included the broadening of the recoil cone due to the evaporation of neutrons from the 167Tm compound nucleus. The production cross section was assumed to be constant over the range of energies due to the beam slowing down in the target. This resulted in an even distribution for the starting positions of the 163Tm ions throughout the target thickness. The initial 163Tm ion positions in the target, ion energies, and recoil direction were supplied as input to the SRIM 2003 code, which then transported each ion through the target and the backing. The detailed recoil history for each ion was written out to a computer file which listed the energy, direction, and position at which each collision of the recoiling 163Tm ions with the target and backing atoms occurred. The lifetime code then read in this file and tracked each ion history in one femto-second (1 ) time steps from initial formation until the ion came to rest. In order to compute the Doppler shifted energies of each ray emitted by the recoiling 163Tm ions in a Monte-Carlo fashion, feeder bands into each state in the main band were randomly populated according to the measured intensity distribution. The subsequent decay profile through the feeder and main band was tracked in 1 steps, with the decay probability given by the radioactive decay law using the parameter and lifetimes generated from each , parameter set. The velocity vector of the emitting ion was recorded at the time of decay of each state of interest. The calculated average fraction of the full Doppler shift was generated by accumulating a large number of histories. In the present analysis, each of the 10,000 ion histories was used 10 times, resulting in better than statistical uncertainty in the calculated values.
A minimization using the fit parameters , and was performed to the measured values for the four bands. The results of the fitting process are summarized in Table 1, where the quoted errors include the covariance between the fit parameters. As can be seen from Fig. 4, the fit of the data is satisfactory in all cases. This is illustrated further in the case of band TSD1 in the insert to Fig. 4, where contours of values are presented in a plane and a clear minimum can be seen.
| Band | |||
|---|---|---|---|
| 1 | 6.51 | ||
| 2 | 8.01 | ||
| TSD1 | 1.81 | ||
| TSD2 | 1.15 |
IV Discussion
Before discussing the significance of the difference in the measured values for bands 1 and 2, on the one hand, and the TSD1 and TSD2 sequences on the other, it is worth examining the relevance of the results through a comparison with other nuclei in the region. Since bands 1 and 2 are based on the configuration, a search of the literature was undertaken for quadrupole moment measurements of this configuration in neighboring nuclei. The results are given in Table 2. The configuration is yrast in 163,165Ho, and, perhaps more importantly, in 163Lu, one of the isotopes where TSD and wobbling bands are known as well. It should be noted that the 163Lu yrast sequence had first been associated with the configuration Schmitz et al. (1992). However, following the work of Ref. Schmitz et al. (1993), the configuration was adopted on the basis of the and transition probabilities deduced from the measured lifetimes and branching ratios.
| Nuclide | Band | Method [REF] | |
|---|---|---|---|
| 163Tm | 1 | FT [present work] | |
| 163Tm | 2 | FT [present work] | |
| 163Ho | ND | LRIMS Alkhazov et al. (1989) | |
| 165Ho | ND1 | , | KaX, PiX Batty et al. (1981) |
| PiX Olaniyi et al. (1983) | |||
| MuX Powers et al. (1976) | |||
| 165Ho | ND2 | MuX Powers et al. (1976) | |
| 163Lu | ND1 | – | LS + RD Schmitz et al. (1993) |
| 163Lu | ND2 | – | LS + RD Schmitz et al. (1993) |
As can be seen from Table 2, the moments have been obtained using a number of techniques ranging from the analysis of values, such as those in the present work, and full line shape analyses of data taken using the DSAM technique, to measurements with the recoil distance method (, so-called plunger data), and even to laser resonance ionization as well as detection of the characteristic rays of kaonic, pionic or muonic atoms. It can be concluded from Table 2 that the moments measured in the present work for bands 1 and 2 ( ) are in good agreement with those reported for the same configuration in the literature. This observation provides further confidence in the analysis presented above.
The moments of bands 1 and 2 can then also be compared with the calculations first outlined in Ref. Pattabiraman et al. (2007). These predict the value to be = at spin = 30, with an associated axial quadrupole deformation of = 0.21. Considering the fact that the errors quoted for the moments in Table 1 are statistical only and do not include the additional systematic error of due to the uncertainties in the stopping powers, the agreement between experiment and theory can be considered as satisfactory. Nevertheless, the fact remains that deformations calculated with the Cranked Nilsson-Strutinsky (CNS) model Bengtsson and Ragnarsson (1985), the Tilted-Axis Cranking (TAC) model Frauendorf (2000) or the Ultimate Cranker (UC) code Bengtsson , all using the same Nilsson potential, tend to be systematically somewhat smaller than the values derived from experiment, an observation that warrants further theoretical investigation.
The present data clearly indicate that the deformation associated with bands TSD1 and TSD2 is larger than that of the yrast structure: as can be seen from Table 1, the moments of bands TSD1 and TSD2 ( ) exceed those for bands 1 and 2 by . The larger deformation agrees with the interpretation proposed in Ref. Pattabiraman et al. (2007). However, the magnitude of the increase in moments is not reproduced as the TAC calculations indicate a transitional quadrupole moment increasing slightly from at spin = 24 to for 34 50. At present, this discrepancy between data and calculations is not understood. It is, however, not unique to 163Tm. Table 3 compares moments for TSD bands in all nuclei of the region where this information is available. Just as was the case above, the systematic uncertainty associated with the stopping powers has been ignored. Nevertheless, three rather striking observations can be made from Table 3: (1) the values for the TSD bands in 163Lu and 163Tm are essentially the same, (2) the moments of the TSD bands decrease from 163Lu and 163Tm to 165Lu, an observation already made for Lu isotopes in Refs. Schönwaßer et al. (2002a, b), and (3) all the TSD bands in Hf nuclei are characterized by moments that are larger than those in Lu and Tm by 4 – , possibly pointing to a rather different nature for these bands. Just as in the present 163Tm case, a discrepancy between the measured and calculated moments was found for the Lu isotopes: UC calculations predicted values of and for positive and negative values of the deformation parameter , and these values were computed to be essentially the same for the three Lu isotopes ( = 163, 164, 165) Schönwaßer et al. (2002a, b), but with the configuration associated with a rotation about the short axis ( 0) being lower in energy. As stated above, the physical origin of the discrepancy between theory and experiment is at present unclear, although it was pointed out in Refs. Schönwaßer et al. (2002a, b) that the exact location in energy of the and proton- and neutron-intruder orbitals is crucial for the deformation. These orbitals are deformation driving and, hence, might have a considerable impact on the moments. It is possible that the use of the standard Nilsson potential parameters, questioned above for normal deformed configurations, needs also to be reconsidered for the precise description of TSD bands.
| Nuclide | Band | Method [REF] | ||
|---|---|---|---|---|
| 163Tm | TSD1 | FT [present work] | ||
| 163Tm | TSD2 | FT [present work] | ||
| 163Lu | TSD1 | , | , | FT Schönwaßer et al. (2002b) |
| – | LS Görgen et al. (2004) | |||
| 163Lu | TSD2 | – | LS Görgen et al. (2004) | |
| 164Lu | TSD1 | FT Schönwaßer et al. (2002b) | ||
| 165Lu | TSD1 | , | , | FT Schönwaßer et al. (2002b) |
| 167Lu | TSD1 | FT Güdal et al. (2005) | ||
| 168Hf | TSD1 | FT Amro et al. (2001) | ||
| 174Hf | TSD1 | FT Hartley et al. (2005) | ||
| 174Hf | TSD2 | FT Hartley et al. (2005) | ||
| 174Hf | TSD3 | FT Hartley et al. (2005) | ||
| 174Hf | TSD4 | FT Hartley et al. (2005) |
In Ref. Schönwaßer et al. (2002a) it was argued that the fact that the measured moments in the 163Lu TSD bands are smaller than the calculated values points towards a positive deformation because the latter is associated with the smaller computed moments. As already discussed in Ref. Pattabiraman et al. (2007), the same conclusion can not be drawn in the case of 163Tm. Indeed, TAC calculations, which do not restrict the orientation of rotational axis to one of the principal axes, point to a tilted solution that smoothly connects two minima of opposite sign in deformation. The average deformation parameters are = 0.39, = 17∘. For 23 the angular momentum vector gradually moves away from the intermediate axis ( 0) toward the short one ( 0), without reaching the latter by = 50.
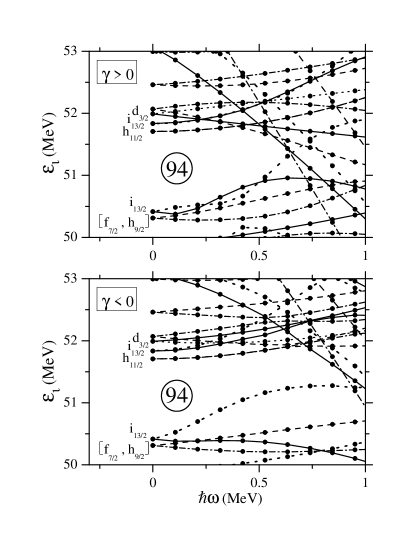
The calculations of Ref. Pattabiraman et al. (2007) have also been extended to the case of 163Lu and the computed moments for the TSD bands are larger than the measured ones, in agreement with the general findings discussed above. These moments in 163Lu were also found to decrease slightly from at = 20 to at = 40 just as in 163Tm. Moreover, the 163Lu values are also somewhat larger than the corresponding ones in 163Tm, reflecting the additional drive towards larger deformation brought about by the proton orbital which is occupied in this case. However, it should be pointed out that within the framework of these calculations Pattabiraman et al. (2007), the occupation of the proton orbital is not a necessary condition to achieve a TSD minimum. Rather, the deformation is driven mainly by the = 94 neutron gap. This point is illustrated further in Fig. 5 where the single-neutron routhians are presented and the large gap associated with the TSD shapes at positive and negative values is clearly visible. The corresponding single-proton routhians can be found in Fig. 6 of Ref. Pattabiraman et al. (2007). The occupation of the proton level in the Lu isotopes adds an additional degree of shape driving towards larger deformation. However, as stated above, the data indicate that its impact is rather minor. This is borne out by the calculations where average deformations of , for 163Tm should be compared with computed values of , for 163Lu. The nearly equal deformations find their origin in the following physical effect: 163Lu does not make full use of the gap, because it has two fewer neutrons, but this absence is compensated by the additional drive provided by the proton. As argued in Ref. Pattabiraman et al. (2007), the large gap makes it unlikely that the 163Tm TSD bands involve a three-quasiparticle structure with a proton coupled to a neutron particle-hole excitation. The possibility that these bands correspond to configurations with the odd proton occupying the level (labeled as in Fig. 6 of Ref. Pattabiraman et al. (2007)) is also unlikely. This orbital is characterized by a large signature splitting and small values for inter-band transitions, in clear contradiction with the data Pattabiraman et al. (2007). While it is possible that combining the occupation of the level with a neutron particle-hole excitation would alter these observables, it would result in an excitation energy much larger than seen experimentally because of the gap. Furthermore, as can be seen in Fig. 6 of Ref. Pattabiraman et al. (2007), there are no other low-lying proton excitations that lead to small signature splitting.
Finally, it is worth noting that the values of the moments associated with the sidefeeding differ significantly between bands 1 and 2, , and bands TSD1 and TSD2, (see Table 1). This change in values is in part responsible for the large difference in the curves as a function of energy seen in Fig. 4. It implies that the -ray intensity responsible for the feeding of the bands originates from states associated with different intrinsic structures. The calculations presented in Ref. Pattabiraman et al. (2007) suggested that several other TSD bands, corresponding to various ph excitations, should be present in 163Tm at excitation energies comparable to those of bands TSD1 and TSD2. It is plausible that these other TSD bands are part of the final stages in the deexcitation process towards the yrast TSD bands. If this is the case, the present observations suggest that the average deformation associated with the feeding TSD bands is larger than that of their yrast counterparts. Conversely, the feeding of bands 1 and 2 then appears to occur from levels associated with a smaller deformation, similar to that of the bands themselves.
V Summary and Conclusion
The transition quadrupole moments, , of two recently observed TSD bands in 163Tm have been determined with the DSAM method and compared with the moments measured for the yrast signature partner bands of normal deformation. While the data confirm that the TSD bands are associated with a larger deformation, the measured moments are smaller than the calculated values. It was pointed out that this difference between theory and experiment appears to a general feature of the region, which requires further investigation. The data also indicate that the feeding of the TSD bands is associated with states of larger deformation.
ACKNOWLEDGMENTS
The authors thank J. P. Greene for the preparation of the target, C. Vaman, D. Peterson, and J. Kaiser for assistance with some of the computer codes used in the present work and D. J. Hartley for fruitful discussions.
This work has been supported in part by the U.S. Department of Energy, Office of Nuclear Physics, under contract No. DE-AC02-06CH11357, the U.S. National Science Foundation under grants No. PHY04-57120 and INT-0111536, and the Department of Science and Technology, Government of India, under grant No. DST-NSF/RPO-017/98.
References
- Vaman et al. (2004) C. Vaman, D. B. Fossan, T. Koike, K. Starosta, I. Y. Lee, and A. O. Macchiavelli, Phys. Rev. Lett. 92, 032501 (2004).
- Timár et al. (2006) J. Timár, C. Vaman, K. Starosta, D. B. Fossan, T. Koike, D. Sohler, I. Y. Lee, and A. O. Macchiavelli, Phys. Rev. C 73, 011301 (2006).
- Alcántara-Núñez et al. (2004) J. A. Alcántara-Núñez, J. R. B. Oliveira, E. W. Cybulska, N. H. Medina, M. N. Rao, R. V. Ribas, M. A. Rizzutto, W. A. Seale, F. Falla-Sotelo, K. T. Wiedemann, et al., Phys. Rev. C 69, 024317 (2004).
- Koike et al. (2003) T. Koike, K. Starosta, C. J. Chiara, D. B. Fossan, and D. R. LaFosse, Phys. Rev. C 67, 044319 (2003).
- Starosta et al. (2001) K. Starosta, T. Koike, C. J. Chiara, D. B. Fossan, D. R. LaFosse, A. A. Hecht, C. W. Beausang, M. A. Caprio, J. R. Cooper, R. Krücken, et al., Phys. Rev. Lett. 86, 971 (2001).
- Zhu et al. (2003) S. Zhu, U. Garg, B. K. Nayak, S. S. Ghugre, N. S. Pattabiraman, D. B. Fossan, T. Koike, K. Starosta, C. Vaman, R. V. F. Janssens, et al., Phys. Rev. Lett. 91, 132501 (2003).
- Bringel et al. (2003) P. Bringel, H. Hübel, H. Amro, M. Axiotis, D. Bazzacco, S. Bhattacharya, R. Bhowmik, J. Domscheit, G. B. Hagemann, D. R. Jensen, et al., Eur. Phys. J. A 16, 155 (2003).
- Ødegård et al. (2001) S. W. Ødegård, G. B. Hagemann, D. R. Jensen, M. Bergström, B. Herskind, G. Sletten, S. Törmänen, J. N. Wilson, P. O. Tjøm, I. Hamamoto, et al., Phys. Rev. Lett. 86, 5866 (2001).
- Jensen et al. (2002a) D. R. Jensen, G. B. Hagemann, I. Hamamoto, S. W. Ødegård, M. Bergström, B. Herskind, G. Sletten, S. Törmänen, J. N. Wilson, P. O. Tjøm, et al., Nuclear Physics A 703, 3 (2002a).
- Jensen et al. (2002b) D. R. Jensen, G. B. Hagemann, I. Hamamoto, S. W. Ødegård, B. Herskind, G. Sletten, J. N. Wilson, K. Spohr, H. Hübel, P. Bringel, et al., Phys. Rev. Lett. 89, 142503 (2002b).
- Törmänen et al. (1999) S. Törmänen, S. W. Ødegård, G. B. Hagemann, A. Harsmann, M. Bergström, R. A. Bark, B. Herskind, G. Sletten, P. O. Tjøm, A. Görgen, et al., Phys. Lett. B 454, 8 (1999).
- Schönwaßer et al. (2003) G. Schönwaßer, H. Hübel, G. B. Hagemann, P. Bednarczyk, G. Benzoni, A. Bracco, P. Bringel, R. Chapman, D. Curien, J. Domscheit, et al., Phys. Lett. B 552, 9 (2003).
- Amro et al. (2003) H. Amro, W. C. Ma, G. B. Hagemann, R. M. Diamond, J. Domscheit, P. Fallon, A. Görgen, B. Herskind, H. Hübel, D. R. Jensen, et al., Phys. Lett. B 553, 197 (2003).
- Amro et al. (2001) H. Amro, P. G. Varmette, W. C. Ma, B. Herskind, G. B. Hagemann, G. Sletten, R. V. F. Janssens, M. Bergström, A. Bracco, M. Carpenter, et al., Phys. Lett. B 506, 39 (2001).
- Neußer et al. (2002) A. Neußer, H. Hübel, G. B. Hagemann, S. Bhattacharya, P. Bringel, D. Curien, O. Dorvaux, J. Domscheit, F. Hannachi, D. R. Jensen, et al., Eur. Phys. J. A 15, 439 (2002).
- Djongolov et al. (2003) M. K. Djongolov, D. J. Hartley, L. L. Riedinger, F. G. Kondev, R. V. F. Janssens, K. A. Saleem, I. Ahmad, D. L. Balabanski, M. P. Carpenter, P. Chowdhury, et al., Phys. Lett. B 560, 24 (2003).
- Hartley et al. (2005) D. J. Hartley, M. K. Djongolov, L. L. Riedinger, G. B. Hagemann, R. V. F. Janssens, F. G. Kondev, E. F. Moore, M. A. Riley, A. Aguilar, C. R. Bingham, et al., Phys. Lett. B 608, 31 (2005).
- Paul et al. (2007) E. S. Paul, P. J. Twin, A. O. Evans, A. Pipidis, M. A. Riley, J. Simpson, D. E. Appelbe, D. B. Campbell, P. T. W. Choy, R. M. Clark, et al., Phys. Rev. Lett. 98, 012501 (2007).
- Hagemann and Hamamoto (2003) G. B. Hagemann and I. Hamamoto, Nucl. Phys. News 13, 20 (2003).
- Fetea and Fetea (2001) M. S. Fetea and R. F. Fetea, Nucl. Phys. A 690, 239 (2001).
- Roux et al. (2001) D. G. Roux, M. S. Fetea, E. Gueorguieva, B. R. S. Babu, R. T. Newman, J. J. Lawrie, R. Fearick, D. G. Aschman, R. Beetge, M. Benatar, et al., Phys. Rev. C 63, 024303 (2001).
- Pattabiraman et al. (2007) N. S. Pattabiraman, Y. Gu, S. Frauendorf, U. Garg, T. Li, B. K. Nayak, X. Wang, S. Zhu, S. S. Ghugre, R. V. F. Janssens, et al., Phys. Lett. B 647, 243 (2007).
- Janssens and Stephens (1996) R. V. F. Janssens and F. S. Stephens, Nucl. Phys. News 6, 9 (1996).
- Cromaz et al. (2001) M. Cromaz, T. J. M. Symons, G. J. Lane, I. Y. Lee, and R. W. MacLeod, Nucl. Instr. And Meth. A 462, 519 (2001).
- Radford (1995) D. C. Radford, Nucl. Instr. And Meth. A 361, 306 (1995).
- Starosta et al. (2003) K. Starosta, D. B. Fossan, T. Koike, C. Vaman, D. C. Radford, and C. J. Chiara, Nucl. Instr. And Meth. A 515, 771 (2003).
- Moore et al. (1997) E. F. Moore, M. P. Carpenter, R. V. F. Janssens, T. L. Khoo, T. Lauritsen, D. Ackermann, I. Ahmad, H. Amro, D. Blumenthal, S. Fischer, et al., Z. Phys. A 358, 219 (1997).
- Ziegler et al. (1985) J. F. Ziegler, J. P. Biersack, and U. Littmark, The stopping and Range of Ions in Solids (Pergamon, New York, 1985).
- Schmitz et al. (1992) W. Schmitz, C. X. Yang, H. Hübel, A. P. Byrne, R. Müsseler, N. Singh, K. H. Maier, A. Kuhnert, and R. Wyss, Nucl. Phys. A 539, 112 (1992).
- Schmitz et al. (1993) W. Schmitz, H. Hübel, C. X. Yang, G. Baldsiefen, U. Birkental, G. Fröhlingsdorf, D. Mehta, R. Müßeler, M. Neffgen, P. Willsau, et al., Phys. Lett. B 303, 230 (1993); W. Schmitz, Thesis (University of Bonn, 1992), unpublished.
- Alkhazov et al. (1989) G. D. Alkhazov, A. E. Barzakh, I. Y. Chubukov, V. P. Denisov, V. S. Ivanov, N. B. Buyanov, V. N. Fedoseyev, V. S. Letokhov, V. I. Mishin, and S. K. Sekatsky, Nucl. Phys. A 504, 549 (1989).
- Batty et al. (1981) C. J. Batty, S. F. Biagi, R. A. J. Riddle, B. L. Roberts, G. J. Pyle, G. T. A. Squier, D. M. Asbury, and A. S. Clough, Nucl. Phys. A 355, 383 (1981).
- Olaniyi et al. (1983) B. Olaniyi, A. Shor, S. C. Cheng, G. Dugan, and C. S. Wu, Nucl. Phys. A 403, 572 (1983).
- Powers et al. (1976) R. J. Powers, F. Boehm, P. Vogel, A. Zehnder, T. King, A. R. Kunselman, P. Roberson, P. Martin, G. H. Miller, R. E. Welsh, et al., Nucl. Phys. A 262, 493 (1976).
- Bengtsson and Ragnarsson (1985) T. Bengtsson and I. Ragnarsson, Nucl. Phys. A 436, 14 (1985).
- Frauendorf (2000) S. Frauendorf, Nucl. Phys. A 677, 115 (2000).
- (37) R. Bengtsson, http://www.matfys.lth.se/ragnar/TSD-defsyst.html.
- Schönwaßer et al. (2002a) G. Schönwaßer, H. Hübel, G. B. Hagemann, J. Domscheit, A. Görgen, B. Herskind, G. Sletten, J. N. Wilson, D. R. Napoli, C. Rossi-Alvarez, et al., Eur. Phys. J. A 13, 291 (2002a).
- Schönwaßer et al. (2002b) G. Schönwaßer, H. Hübel, G. B. Hagemann, H. Amro, R. M. Clark, M. Cromaz, R. M. Diamond, P. Fallon, B. Herskind, G. Lane, et al., Eur. Phys. J. A 15, 435 (2002b).
- Görgen et al. (2004) A. Görgen, R. M. Clark, M. Cromaz, P. Fallon, G. B. Hagemann, H. Hübel, I. Y. Lee, A. O. Macchiavelli, G. Sletten, D. Ward, et al., Phys. Rev. C 69, 031301 (2004).
- Güdal et al. (2005) G. Güdal, H. Amro, C. W. Beausang, D. S. Brenner, M. P. Carpenter, R. F. Casten, C. Engelhardt, G. B. Hagemann, C. R. Hansen, D. J. Hartley, et al., J. Phys. G 31, S1873 (2005).