Optical variabilities in Be/X-ray binary system:
Abstract
Aims. We present an analysis of long-term optical monitoring observations and optical spectroscopic observations of the counterpart to CXOU J205847.5+414637 (high mass X-ray binary system). We search for a variability in the light curve of Be star.
Methods. We used differential magnitudes in the time series analysis. The variability search in the optical light curve was made by using different algorithms. The reduction and analysis of spectra were done by using MIDAS and its suitable packages.
Results. We have performed a frequency search which gave us the value 2.404 d-1. This value is attributed to the non-radial pulsation of Be star. H emission line profiles always show double-peaked emissions with a mean equivalent width of 2.310.19 Å and a peak separation of 51645 km/s. This suggests that Be star disk is still present. CXOU J205847.5+414637 is in X-ray quiescent state.
Key Words.:
stars:emission-line, Be – stars:early-type – stars:variables:Be – stars:oscillations – X-rays:binaries1 Introduction
Be/X-ray binaries consist of a Be star and a neutron star which has little influence on the Be star. Be stars are on or just off the Main Sequence and they have rapid rotational velocities. Majority of them are found to rotate at 0.7 of their break-up velocity (Porter Rivinius 2003). H emission line and infrared excess are the observational characteristics of Be stars. They show disappearance and re-appearance of emission lines. Be stars often display enhancement or fading of their brightness. It is thought that enhancements in brightness are associated with the mass loss episodes and appear to be induced by non radial pulsations (Rivinius et al. 2003). Studies of spectroscopic variations in some line profiles are interpreted as due to non radial pulsations (Rivinius et al. 2003, Neiner et al. 2005). A Be star has a dense disk in its equatorial plane (Quirrenbach 1997; Waters 1986) which is fed from the material expelled from the fast rotating Be star due to radiatively driven wind or photospheric pulsations (Porter Rivinius 2003). Among the disk models the favorable one is the viscous disk model (Lee, Osaki Saio 1991; Okazaki 2001). Quasi Keplerian disks are held by viscosity (Okazaki Negueruela 2001; Okazaki 2001). Angular momentum is transferred from the inner regions of the disk towards the outer region by the viscosity. This disk causes the X-ray outburst of NS either at the periastron passage (Type I outburst) or alters the outer part of disk (Type II outburst) without showing any correlation with orbital parameters (Negueruela 2004). X-rays are produced as a result of accretion of matter onto the NS. In a Be/X-ray system there can be X-ray quiescence periods although a Be disk is present (Negueruela Okazaki 2001; Negueruela et al. 2001).
GRO J2058+42 (CXOU J205847.5+414637), a transient 198 s X-ray pulsar was discovered by the BATSE instrument on the Compton Gamma Ray Observatory during a giant outburst in September 1995 (Wilson et al. 1996). Wilson et al. (1998) proposed that GRO J2058+42 was undergoing periastron and apastron outbursts in a 110 day orbit. They have estimated the/its? luminosity as 0.2-1X erg/s and no optical counterpart has been identified. Corbet et al. (1997) showed the presence of modulation with a period of approximately 54 days in the analysis of RXTE/ASM (Rossi X-ray Timing Explorer/All Sky Monitor) data obtained between 1996 and 1997. Reig et al. (2004a) performed optical photometric and spectroscopic observations of the best fit to GRO position of the GRO J2058+42. They suggested that the star was located at = 20h 58m 47s, = +41∘ 46′ 36′′, as the most likely optical counterpart. Spectra of the proposed star showed a double peak H emission profile with a mean equivalent width of 4.5 Å which supports its classification as Be/X-ray binary.
Subsequent Chandra observations did not find a source within the GRO positional error-box, but just outside, named CXOU J205847.5+414637. Wilson et al. (2005) obtained optical observations of CXOU J205847.5+414637. Its optical spectrum contained a strong H line in double peaked emission. They proposed that CXOU J205847.5+414637 and GRO J2058+42 are the same object. They classified the spectral type of this object as O9.5-B0IV-V (V=14.9). They estimated the distance as 91.3 kpc. When RXTE/ASM data for GRO J2058+42 were folded at 55.03 d period, pulsation from this source were detectable for 1996-2002 data, but were not present in 2003-2004 observations. This system was in X-ray quiescent phase since 2002. During the X-ray quiescence phase the Be disk was present since H was in emission as seen from their spectroscopic study (Wilson et al. 2005).
| Star | R.A. | Decl. | USNO A2 |
|---|---|---|---|
| (J2000.0) | (J2000.0) | R mag | |
| J205847.5+414637 | 20h58m4754 | +41∘46′373 | 14.4 |
| Star 1 | 20h58m5353 | +41∘46′280 | 13.9 |
| Star 2 | 20h58m4585 | +41∘45′060 | 13.9 |
| Star 3 | 20h59m0550 | +41∘44′201 | 14.1 |
There is no long term optical monitoring for this system, therefore in this study we present optical observations obtained by ROTSEIIId telescope. The coordinates of CXOU J205847.5+414637 were taken from Reig et al. (2004a) and Wilson et al. (2005). We present optical spectroscopic observations obtained in 2006. We report short term variabilities seen in the optical light curve. From the analysis of archival RXTE/ASM observations we attempt to detect the orbital modulation in 2005 and 2006.
2 Observations and Data reduction
The optical data were obtained with Robotic Optical Transient Experiment 111http://www.rotse.net (ROTSEIIId) and Russian-Turkish 1.5 m Telescope 222http://www.tug.tubitak.gov.tr (RTT150) located at Bakırlıtepe, Antalya, Turkey.
2.1 Optical Photometric observations
The CCD observations were obtained between Jan, 2005 and Aug, 2006 with 45 cm ROTSEIIId robotic reflecting telescope. ROTSEIII telescopes which operate without filters were described in detail by Akerlof et al. (2003). ROTSEIIId has equipped with a 20482048 pixel CCD. The pixel scale is 3.3 arcsec per pixel for a total field of view 1.∘851.∘85. A total of about 1440 CCD frames were collected during the observations. In 2006, we have 400 data points. Due to the other scheduled observations and atmospheric conditions we have obtained 1–20 frames at each night with an exposure time of 20 sec. All images were automatically dark- and flat-field corrected by a pipeline as soon as they were exposed. Dark field frames which were accumulated each night were used in the data reduction pipeline together with proper sky-flat and fringe frames. For each corrected image, aperture photometry was applied using 5 pixel (17 arcsec) diameter aperture to obtain the instrumental magnitudes. These magnitudes were calibrated by comparing all the field stars against USNO A2.0 R-band catalog. Barycentric corrections were made to the times of each observation by using JPL DE200 ephemerides prior to the analysis with the period determination methods. Details on the reduction of data were described in Kızıloğlu, Kızıloğlu Baykal (2005) and Baykal, Kızıloğlu Kızıloğlu (2005).
We used differential magnitudes in the time series analysis. In magnitude measurements of ROTSEIIId, the magnitude determining accuracy decreases for fainter stars (Fig. 5 of Kızıloğlu et al. 2005). CXOU J205847.5+414637 has a moderate brightness and use of fainter stars than our target as a reference may significantly contribute to the uncertainties of individual points in the differential light curve. When there are suitable stars available within the frame, it is better to choose reference stars that are brighter than the target so as not to introduce an additional noise into the light curve of the target. We adopted three stars as the reference whose properties are given in Table 1, and we used their average light curve in order to reduce long term systematic errors. We checked the stability of the reference stars and two test stars. The mean magnitude of reference stars (see Fig. 1) were used in the calculation of differential magnitudes.
2.2 Optical spectroscopic observations
The spectroscopic observations were performed with RTT150 on May 23, Jun 16, Jul 29, Aug 19 and Sep 26, 2006 using medium resolution spectrometer TFOSC (TÜBİTAK Faint Object Spectrometer and Camera). The camera is equipped with a 20482048, 15 pixel Fairchild 447BI CCD. We used grisms G7 (spectral range 3850-6850 Å), G8 (5800-8300 Å), G14 (3275-6100 Å) and G15 (3300-9000 Å). The average dispersions are 1.5, 1.1, 1.4 and 3 Å pixel-1 for G7, G8, G14 and G15 respectively. We have a low signal to noise ratio for both May and June 2006 observations due to problems with the autoguider. The reduction and analysis of spectra were made using MIDAS333http://www.eso.org/projects/esomidas/ and its packages: Longslit context and ALICE.
3 Long term monitoring
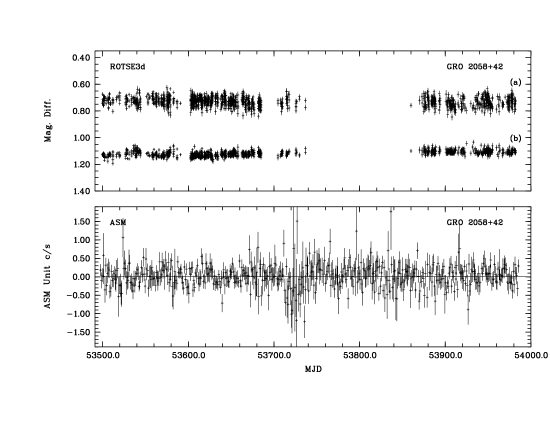
The differential optical light curve and X-ray light curve of Be/X-ray binary system CXOU J205847.5+414637 were shown in Fig. 1. X-ray light curve was obtained from RXTE/ASM web site444http://xte.mit.edu. The X-ray data covers the high energy range (5-12 keV). Due to a varying amount of circumstellar matter long or short term variabilities are expected. These variations include both photospheric and circumstellar variabilities. Therefore a time series analysis for the observational data was performed.
3.1 Variability
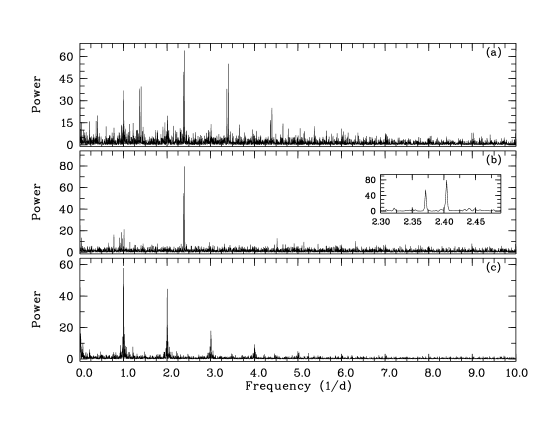
We searched for a variability in the light curve of Be star by using several different algorithms: Lomb-Scargle (Scargle 1982), Clean (Roberts et al. 1987) and Period04 (Lenz & Breger 2005)555available at http://www.univie.ac.at. These methods were applied to the whole observational data (from MJD 53499 to MJD 53982). Frequency analysis was performed over a range from 0 to 10 d-1 with a step width 1/T d-1. Fig. 2 shows the power spectra of the Be star (optical counterpart to CXOU J205847.5+414637). There is a very pronounced window function of one day as expected due to a long observation period. Hence, aliases as a result of window function should be taken into account.
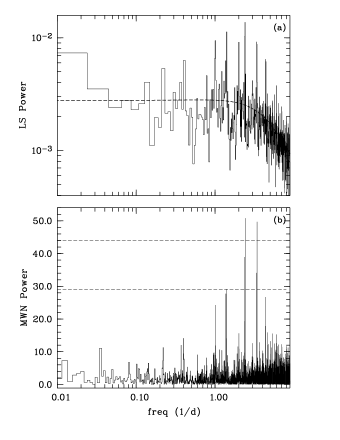
As seen from Fig. 2, the search of frequencies by performing Lomb-Scargle and Clean algorithms results with the same frequencies. The calculated frequencies are 2.404 and 2.371 d-1. Periodogram analysis with Period04 confirmed these frequencies. The power spectrum of mean light curve of reference stars obtained by LS algorithm is also shown in Fig. 2. Test stars gave similar results. Neither the reference stars nor the test stars show pronounced periodicities other than one day aliases. There is no sign of frequencies 2.371 and 2.404 d-1. However, the significance levels of the oscillations at 2.371 and 2.404 d-1which are present in both LS and cleaned spectra, should be set to provide a convincing evidence of their reality. In Fig. 3a the log-log binned Lomb-Scargle periodogram of CXOU J205847.5+414637 is presented. As one can notice from the figure, a red noise component in the power spectra is seen between 1-8 d-1 with a power law index . Even though the red noise component has a very low power law index, we modeled the power spectrum in order to test the significance of these oscillations. In modeling the broad band continuum spectrum, we rebinned the power spectrum by a factor of 10. Then we modeled the broad band continuum by a Lorentzian centered at 0.6 d-1 with a FWHM 10.04 d-1. As seen from the figure, in this way, we were able to model both low frequency ( d-1) and red noise (between 1 and 8 d-1) trends.
To test the significance of oscillations, unbinned power spectrum is divided by its continuum model and the resultant spectrum is multiplied by a factor of 2 (see van der Klis 1989, and İnam et al. 2004 for applications). The resulting power spectrum (Modified White Noise model, MWN) would be a Poisson distribution for 2 degrees of freedom (dof). In this presentation, 5 detection level of continuum normalized power is 44. At this level the probability of detecting a false signal is Q(). Since we have 4822 frequencies (the number of independent Fourier steps) in the power spectra, the probability of having a false signal becomes . This corresponds to the significance of signal detection of 1– = 0.999999. In Fig. 3b, we present the confidence levels of the observed oscillations. Only 2.404 d-1has a confidence level greater than 5 . 2.371 d-1frequency is in between 3 and 5 confidence levels. Other frequencies are aliasing due to the observation window and they are successfully removed which can be seen in the cleaned spectra (Fig. 2b).
| Date | MJD | Grisma | Exp. | FWHM | EW | v (peak sep) |
|---|---|---|---|---|---|---|
| (sec) | (Å) | (Å) | (km s-1) | |||
| 2006 May 23 | 53878 | G7 | 4x600 | 15.86.6 | 2.340.27 | - |
| 2006 June 16 | 53902 | G8 | 3x600 | 10.34.3 | 2.420.29 | 539.4 |
| 2006 July 29 | 53945 | G7 | 2x1200 | 10.04.1 | 2.310.18 | 542.6 |
| G8 | 2x1800 | 11.04.7 | 2.200.17 | 516.9 | ||
| G15 | 1800 | 20.18.4 | 2.650.18 | - | ||
| 2006 August 19 | 53966 | G8 | 1800 | 10.64.4 | 2.030.19 | 516.1 |
| 2006 September 26 | 54004 | G8 | 1800 | 11.14.7 | 2.580.15 | 465.8 |
| G14b | 3600 | - | - | - |
-
a
Nominal dispersions for G7, G8, G14 and G15 are 1.5, 1.1, 1.4 and 3 Åpixel-1 respectively. Hence 3 pixel resolutions at H line are: G7:4.5 Å, G8:3.4 Å, G14:4.2 Å and G15:9.1
-
b
G14 is sensitive in 3275-6100 Å band and used for blue spectra.
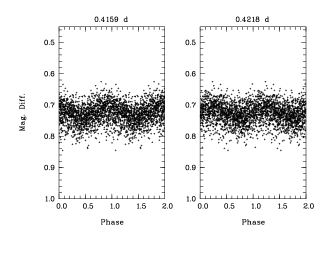
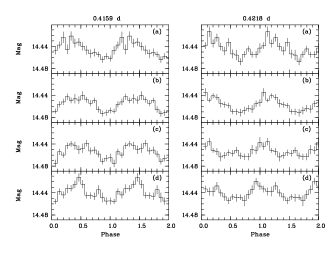
The phase diagrams of 0.416 d (2.404 d-1) and 0.422 d (2.371 d-1) periods calculated from the time series shown in Fig. 1 are presented in Fig. 4. The mean amplitude of the oscillations are 13.41.2 and 10.41.2 mmag, respectively. In order to check the stability of the pulsations in 2005 and 2006 we used target time series so that only the uncertainties of target measurements will contribute to noise. In Fig. 5 we present the same phase diagrams calculated from the target time series. These phase diagrams are obtained by dividing the whole data into four parts (part a: MJD 53499-53583, part b: MJD 53586-53634, part c: MJD 53637-53736, part d: MJD 53836-53982). Each part has almost the same number of data points in order to get similar uncertainties in each bin. The periods are epoch-folded using the epoch T= MJD 53300. It is shown that the observed periods have coherent phase distributions during the different observation spans, in 2005 and 2006.
Short term variations were already found in most of the early type Be stars (Baade 1982, Rivinius et al. 1998, Floquet et al. 2002, Neiner et al. 2005). The timescales range from minutes to a few days and show either the photosphere or the circumstellar environment as their formation region (Porter Rivinius, 2003). In this study, our calculated frequency of 2.404 d-1 does not show transient character so it can be attributed to the non-radial pulsation of Be star. If it was a transient frequency then it should not re-appear with the same frequency and phase at a later epoch.
No long-term variations were found in the optical light curve. This shows that disk was not changing very much over the time of observations.
3.2 Orbital period signatures and X-ray quiescence
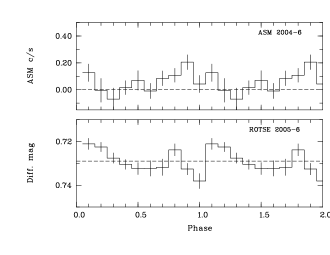
Before the year 2002 this system displayed type I outbursts in X-rays (Wilson et al. 2005) due to accretion of matter from Be disk at periastron passages. Between 2002–2004, type I outbursts were not seen and the orbital period was detected below 3 level in the work of Wilson et al. (2005). We present 2004–2006 RXTE/ASM data (in the energy band 5–12 keV) folded at the orbital period of 55.03 d using the ephemeris given by Wilson et al. (2005) ( MJD ) in Fig. 6. In order to see whether there is any orbital period signature in optical light curve or not, we also fold the optical light curve at a period of 55.03 d using the same ephemeris and we show the result in the bottom panel of Fig. 6. RXTE/ASM data show no correlation with the ROTSE data. The power spectrum of the ASM data is just noise, all of which confirms that the cessation of activity, first noted by Wilson et al. (2005), has continued in subsequent years.
4 Analysis of spectra
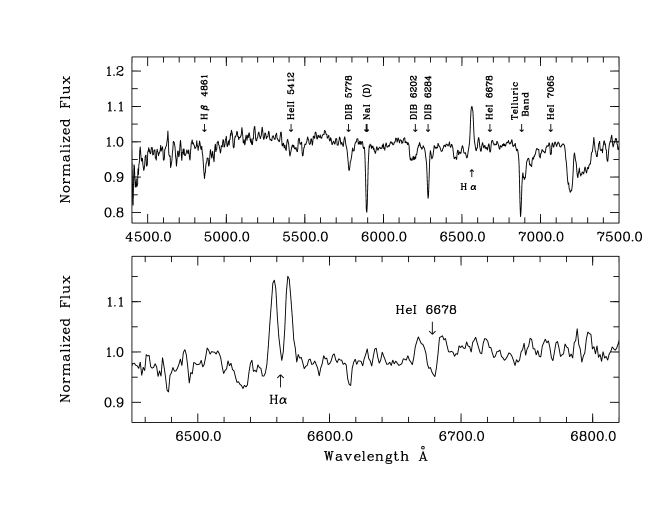
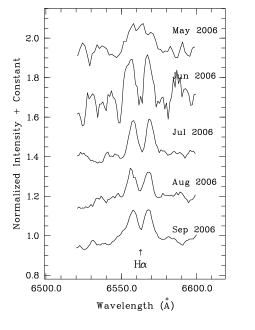
The emission lines of the Be stars particularly H (= 6563Å) can be used for the existence of circumstellar disk of Be stars. We have observed the counterpart of CXOU J205847.5+414637 to see whether any variation exists on the circumstellar disk or not. The journal of spectroscopic observations are listed in Table 2. Broadband (4500-7500 Å) low resolution spectrum of the counterpart is shown in the upper panel of Fig. 7 for July 2006 observation. Several features are recognized in addition to strong H line emission. In the lower panel of Fig. 7, H emission with split profle is visible together with HeI 6678 line (the resolution is 1.1 Å at H). The H profiles obtained from each spectrum are presented in Fig. 8. Table 2 gives the measurements of the equivalent width (EW) of the H line for each observing run together with the values of full width at half maximum (FWHM) and the peak separation (v). The FWHM values are obtained from model calculations of the emission features. The mean FWHM calculated from G7 and G8 observations of June, July, August and September 2006 is 10.64.4 Å. May and June 2006 observations have relatively low signal to noise ratio. The H line shows a double peaked emission profile with a mean equivalent width of 2.310.19 Å and peak separation of 51645 km s-1. The mean equivalent width is almost half of the values obtained by Wilson et al. (2005). H line profiles in all runs show a self–absorption at the center of line due to the high inclination angle of Be disk. The central absorption with a varying level in each observation reaches the continuum on July 2006 observation. We could not detect whether night to night variations of H emission line exist which would imply global structural changes of the disk.
The optical counterpart of CXOU J205847.5+414637 is in still relative optic quiescence phase. However the depth of the self absorption feature in the middle of split H emission is deeper than the feature shown for July 2004 observation of CXOU J205847.5+414637 by Wilson et al. (2005). This can be interpreted as a decrease in the density of Be disk. Like H line, HeI 6678 and 7065 Å lines show emission peaks with central absorption.
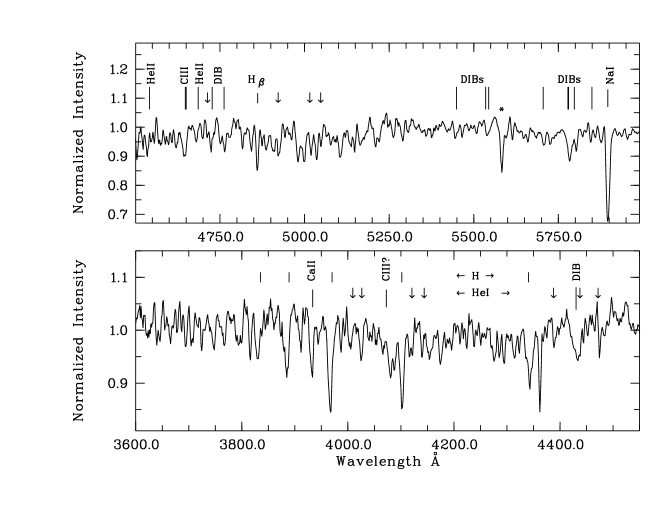
The blue and mid band spectra in Fig. 9 indicate several lines from the Balmer series (H9, H8, H, H, H, H). The typical He I lines, 4009, 4026, 4121, 4144, 4388 are shown in the lower panel. Weak or unresolved 4437 and 4472 lines are also indicated. The other HeI lines 4713, 4922, 5016 and 5048 are shown in the upper panel of Fig. 9. Several DIBs are seen in blue, mid and broad band spectra.
4.1 Rotational velocity
Be stars have rapid rotational velocities. The rotational velocities can be measured by using the empirical relation derived for FWHM of He I lines (Steele et al. 1999). We calculated the rotational velocity sin = 24157 km s-1 by using HeI lines 4026, 4143 and 4471. This velocity is similar to the ones obtained in other Be systems (Nequeruela Okazaki 2001, Reig et al. 2004b). We also calculated the rotational velocity from the average FWHM of H lines as sin = 24251 km s-1. However the same velocity derived from the peak separation is found to be 258 km s-1. On the other hand using the equation given by Hanuschik (1989) (Eq.1b: empirical relation between FWHM of H line and sin derived for a sample of 115 Be stars) we obtained the projected rotational velocity of the H emission region as sin = 312 km s-1. All these calculations provide similar values. Calculation of the outer disk radius of the H emission region, derived from the peak separation values of H line (Coe et al. 2006), shows an increase in disk radius during our spectroscopic observation period.
5 Summary
Be stars which often display enhancement or fading of their brightness are candidates for a search of multi-periodicity. Short term variations has been detected in several Be stars, in most early type Be stars. Baade (1982) attributed the short term periodic line profile variations on timescales between 0.5 and 2 days to non-radial pulsations. Balona (1990) argued that periods were better explained by stellar rotation and he attributed LPV (line profile variability) to stellar spots. Guerrero et al. (2000) reported the optical variability of the Be star o And during the period 1975-1998 and concluded that neither multimodal pulsations nor rotational modulation completely explains the complex light curves. Photometric variations in visual bands on timescales as short as one day have been reported by Percy et al. (1997) for a sample of Be stars.
Multi-periodicity has been detected in several Be stars in optical LPVs (Rivinius et al. 1998, Floquet et al. 2002, Neiner et al. 2005) and in photometric variations (Gutierrez-Soto et al. 2006) with few hours periods. Rivinius et al. (2003) reported that the short-term periodic LPV of Be stars was due to non radial pulsation which is thought to have a connection with mass loss or circumstellar disk formation. In addition to this they noted secondary (transient) periods which were attributed to processes that strongly interact with or reside in the disk. They were formed in the photosphere and the close circumstellar environment. These periods were within 10 of the main photospheric period in their sample Be stars. Multi-periodicity which is mainly detected in optical LPV has been generally attributed to non-radial pulsations. Pulsations combined with rapid rotation of Be stars are thought to be a prime candidate to explain mass loss and disk formation in Be stars. In this work, frequency analysis of the light curve of the Be star counterpart to CXOU J205847.5+414637 results in one short-term variability. The calculated frequency is 2.404 d-1. This frequency is attributed to non-radial pulsation. In the study of non radially pulsating Be stars Rivinius et al. (2003) found that photometric periods were detected for stars which have intermediate to high sin values. As the amplitude of pulsation increases sin value increases for these stars. They noted that non-radial pulsation induced photometric variability cannot be seen for the stars whose inclination angle is less (seen pole-on). In this work the Be star (counterpart to CXOU J205847.5+414637) has sin value of about 250 km/s indicating an inclination angle greater than 40∘ (not to exceed the break-up velocity of Be stars) and can be placed well in the defined band of Fig. 16 (photometric amplitude is plotted against sin) of Rivinius et al. (2003).
The frequency 2.371 d-1which is very close to 2.404 d-1as seen in Fig. 2 can also be thought as a non-radial pulsation of this star. Its confidence is 4. These frequencies do not show transient characteristics (Fig. 5). During different observation periods they appear with the same frequency and the same phase. The light curve of the Be star does not show outbursts. Štefl et al. (2003) suggests that transient periods appear during or shortly after outbursts. Therefore pulsations that we found are photospheric. The absence of outbursts supports the conclusion that the inner part of the disk is stable. The disk does not change very much over the time of observations.
Periodic variations were not detected in other Be/X-ray binary systems. It is believed that the companion has little influence on the Be star and alters only the outer part of the circumstellar disk. Then it is possible for Be stars in binary systems to exhibit periodic variations. There was a proposed periodic optical variability detection for Be/X-ray binary system 2S 0114+65 by Taylor et al. (1995) with a period of 2.77 h and with a semiamplitude of 4 millimag. The evidence that this short timescale variation in optical line profiles occurs was marginal in the study of Koenigsberger et al. (2003).
We follow up the behavior of H line during the five months of 2006 by spectroscopic observations. Double peaked, similar intensity H line profiles remain unchanged during this period. We did not observe shell or single-peaked profiles. The self absorption on emission line, seen in our spectroscopic observations is caused by the absorption of light coming from the interior part of the disk, by the outer regions of the disk. This occurs when the disk is under a large inclination angle . Be disk is still present. Our calculated EW values of H profiles are smaller than the calculated values given by Wilson et al. (2005) indicating that Be star disk lost some mass since 2004. It might also be possible that the density is lower, i.e the disk grew and diluted, or a combination of less massive and less dense disk.
Acknowledgements.
This project utilizes data obtained by the Robotic Optical Transient Search Experiment. ROTSE is a collaboration of Lawrence Livermore National Lab, Los Alamos National Lab and the University of Michigan (http://www.rotse.net). We thank the Turkish National Observatory of TÜBİTAK for running the optical facilities. We thank the referee, Th. Rivinius, for a careful reading and valuable comments. Special thanks to Tuncay Özışık and colleagues from TUG who keeps hands on ROTSEIIId. We acknowledge support from TÜBİTAK, The Scientific and Technological Research Council of Turkey, through project 106T040. We also acknowledge the RXTE/ASM team for the X-ray monitoring data.References
- (1) Akerlof C. W., Kehoe R.L., McKay T.A., Rykoff E.S., Smith D.A., et al., 2003, PASP, 115, 132
- (2) Baade D., 1982, A&A, 105, 65
- (3) Balona L.A., 1990, MNRAS, 245, 92
- (4) Baykal A., Kızıloğlu Ü., Kızıloğlu N., 2005, IBVS 5615
- (5) Coe M.J., Reig P., McBride V.A., Galache J.L., Fabregat J., 2006, MNRAS, 368, 447
- (6) Corbet R., Peele A., Remilliard R., 1997, IAUC 6556
- (7) Floquet M., Neiner C., Janot-Pacheco E., Huber A.M., Jankov S., Zorec J., Briot D., Chauville J., Leister N.V., Percy J.R., Ballereau D., Bakos A.C., 2002, A&A, 394, 137
- (8) Guerrero G., Sareyan J.P., Alvarez P., Chauville J., Arellano F., Mathias P., Pena J., Garcia E., 2000, ASP Conf. Series, Vol. 214, p:205
- (9) Gutierrez-Soto J., Fabregat J., Suarez J.C., Moya A., Garrido R., Hubert A.M., Flaquet M., Neiner C., Fremat Y., 2006, ASPC, 349, 249
- (10) Hanuschik R.W., 1989, Ap&SS, 161, 61
- (11) İnam, C.S., Baykal, A., Swank, J., Stark, M.J., 2004, ApJ., 616, 443
- (12) Kızıloğlu Ü., Kızıloğlu N., Baykal, A., 2005, AJ, 130, 2076
- (13) Koenigsberger G., Canalizo G., Arrieta A., Richer M.G., Georgiev L., 2003, Rev. Mex. Ast.Astrof., 39, 17
- (14) Lee U., Osaki Y., Saio H., 1991, MNRAS, 250, 432
- (15) Lenz, P., & Breger, M. 2005, CoAst, 146, 53
- (16) Negueruela I., 2004, in N. St-Louis and A. Moffat, eds., Proceedings of ’Massive Stars in Interacting Binaries’, ASP Conf. Series, also in astro-ph/0411335
- (17) Negueruela I., Okazaki A.T., 2001, A&A, 369, 108
- (18) Negueruela I., Okazaki A.T., Fabregat J., Coe M.J., Munari U., Toma T., 2001, A&A, 369, 117
- (19) Neiner C., Floquet M., Hubert A.M., Fremat Y., Hirata R., Masuda S., Gies D., Buil C., Martayan C., 2005, A&A, 437, 257
- (20) Okazaki A.T., 2001, PASJ, 53, 119
- (21) Okazaki A.T., Negueruela I., 2001, A&A, 377, 161
- (22) Percy J.R., Harlow J., Hayhoe K.A.W., Ivans I.I, Lister M., Plume R., Rosebery T., Thompson S., Yeung D., 1997, PASP, 109, 1215
- (23) Porter J.M., Rivinius T., 2003, PASP, 115, 1153
- (24) Quirrenbach A., 1997, ApJ, 479, 477
- (25) Reig P., Kougenrakis T., Papamastorakis G., 2004a, Atel no:308
- (26) Reig P., Negueruela I., Fabregat J., Chato R., Blay P., Mavromatakis F., 2004b, A&A, 421, 673
- (27) Reig P., Negueruela I., Papamastorakis G., Manousakis A., Kougentakis T., 2005, A&A, 440, 637
- (28) Rivinius Th., Baade D., Štefl S., Stahl O., Wolf B., Kaufer A., 1998, A&A, 333, 125
- (29) Rivinius Th., Baade D., Štefl S., 2003, A&A, 411, 229
- (30) Roberts D.H., Lehar J., Dreher J.W., 1987, AJ, 93, 968
- (31) Scargle J.D., 1982, ApJ, 263, 835
- (32) Steele I.A., Negueruela I., Clark J.S., 1999, A&A Suppl. Ser., 137, 147
- (33) Štefl S., Baade D., Rivinius Th., Stahl O., Budovičová A., Kaufer A., Maintz M., 2003, A&A, 411, 167
- (34) Taylor M., Finley J.P., Kurt C., Koenigsberger G., 1995, AJ, 109, 396
- (35) van der Klis, M., 1989, in Ögelman H., van den Hauvel E.P.J., Eds, ”Timing Neutron Stars”, NATO ASI Series, Kluwer, p. 27
- (36) Waters L.B.F.M., 1986, A&A, 162, 121
- (37) Wilson C.A., Strohmayer T., Chakrabarty D., 1996, IAUC 6514
- (38) Wilson C.A., Finger M.H., Harmon B.A., Chakrabarty D., Strohmayer T., 1998, ApJ, 499, 820
- (39) Wilson C.A., Weisskopf M.C., Finger M.H., Coe M.J., Greiner J., Reig P., Papamastorakis G., 2005, ApJ, 622, 1024