MEASUREMENT OF DUST OPTICAL PROPERTIES IN COALSACK
Abstract
We have used FUSE and Voyager observations of dust scattered starlight in the neighborhood of the Coalsack Nebula to derive the optical constants of the dust grains. The albedo is consistent with a value of and the phase function asymmetry factor with a value of throughout the spectral range from 900 – 1200 Å, in agreement with previous determinations as well as theoretical predictions. We have now observed two regions (Ophiuchus and Coalsack) with intense diffuse background radiation and in both cases have found that the emission is due to light from nearby hot stars scattered by a relatively thin foreground cloud, with negligible contribution from the background molecular cloud.
1 INTRODUCTION
It has long been assumed that the diffuse far-ultraviolet (FUV) background should be correlated with the amount of H I in the line of sight (e.g., Maucherat-Joubert et al., 1980). While this may be true at high galactic latitudes where Haikala et al. (1995) and Schiminovich et al. (2001) have both found the UV scattered light to be correlated with the 100 µm emission observed using the Infrared Astronomical Satellite (IRAS), albeit with different correlation factors, it is now becoming apparent that local effects, such as the proximity of dust to hot stars, can also play an important role in the level of the diffuse UV background (Murthy & Sahnow, 2004; Edelstein et al., 2006). This interdependence is even more apparent in the LMC where Cole et al. (1999) have found that neither bright stars nor dust are sufficient in themselves to produce scattered emission; only when both are present with a favourable geometry is scattered light seen. In our own Galaxy, Lee et al. (2006) found the scattered radiation in Taurus to be actually anti-correlated with the gas column density suggesting that the source of the radiation is behind the molecular cloud.
In addition to characterizing and understanding the diffuse radiation field, one of our scientific goals has been to extract the optical constants – the albedo () and phase function asymmetry factor () – of the interstellar dust grains. This has been complicated by the faintness of the signal and lack of knowledge about the scattering geometry (Mathis et al., 2002). Thus, although we have observed targets over the entire sky (Murthy et al., 1999; Murthy & Sahnow, 2004), we have chosen to begin our modeling with two regions where the signal is bright and the interstellar dust distribution, from whence the scattering comes, is well characterized. The first of these was in the constellation of Ophiuchus (Sujatha et al., 2005) and the second, which we present here, is near the Coalsack Nebula.
Murthy et al. (1994) found from observations made with the two Voyager Ultraviolet Spectrographs (UVS) that the Coalsack was one of the brightest regions of diffuse UV emission in the sky and they attributed this emission to forward scattering from a relatively thin H I cloud in front of the Coalsack molecular cloud, a conclusion later confirmed by Shalima & Murthy (2004). In order to supplement these observations, we searched for further observations made with the Far Ultraviolet Spectroscopic Explorer (FUSE) finding an additional 29 observations of 21 targets, including 3 observations that were made as part of our own FUSE guest investigator observing program.
2 OBSERVATIONS
We have collected 34 observations (29 from FUSE and 5 from the Voyager UVS) of the diffuse radiation in and around the Coalsack Nebula (Table 1). Of the five observations made with the Voyager UVS, four have already been discussed by Murthy et al. (1994) and a full description of the instrument and diffuse observations made with it has been given by Murthy et al. (1999) and references therein. Briefly, the Voyager UVS observe diffuse radiation from 500 - 1600 Å with a resolution of about 38 Å. The field of view is large (0.1 0.87) and integration times are long resulting in a sensitivity to diffuse radiation of better than 100 photons cm-2 sr-1 s-1 Å-1.
The remaining 29 observations were made with the LWRS () aperture on the FUSE spacecraft. The four FUSE spectrographs cover the wavelength region from 850 - 1167 Å with a resolution () of about 20000. Although intended for observations of point sources (see Moos et al., 2000; Sahnow et al., 2000, for a description of the spacecraft and mission), Murthy & Sahnow (2004) have shown that background levels of 2000 photons cm-2 sr-1 s-1 Å-1 are detectable with the LWRS aperture.
Following Murthy & Sahnow (2004), we binned the data into broad bands of about 50 Å in width in order to increase the signal-to-noise ratio. This yields a total of 6 independent bands (Table 2) with sufficient sensitivity to detect the diffuse radiation from the Coalsack. Because the 2A2 and 1B1 bands and the 2A1 and 1B2 bands, respectively, had similar bandpasses, we used their weighted average for our further calculations. A point source in the aperture will result in a Gaussian with a width of about 18 pixels while a diffuse aperture filling source will yield a Gaussian with a width of 30 pixels. We have used this width to ensure that the signal in our observations was indeed of diffuse origin.
We have additionally searched the Digital Sky Survey plates from CDS111Centre de Donnes astronomiques de Strasbourg : http://cdsweb.u-strasbg.fr/ and found no point sources in the aperture. However, it is interesting to calculate the brightness of a star whose contribution would be equivalent to a diffuse flux of 20,000 photons cm-2 sr-1 s-1 Å-1. A star with a spectral type of later than about B9 would simply not have enough flux to contribute in the FUSE range without being blazingly bright in the visible. On the other hand, this amount of diffuse flux corresponds to an unreddened 18th magnitude B3 star implying a spectroscopic distance of about 1.5 kpc, or well beyond the Coalsack Nebula which would, of course, absorb any UV component of such a star.
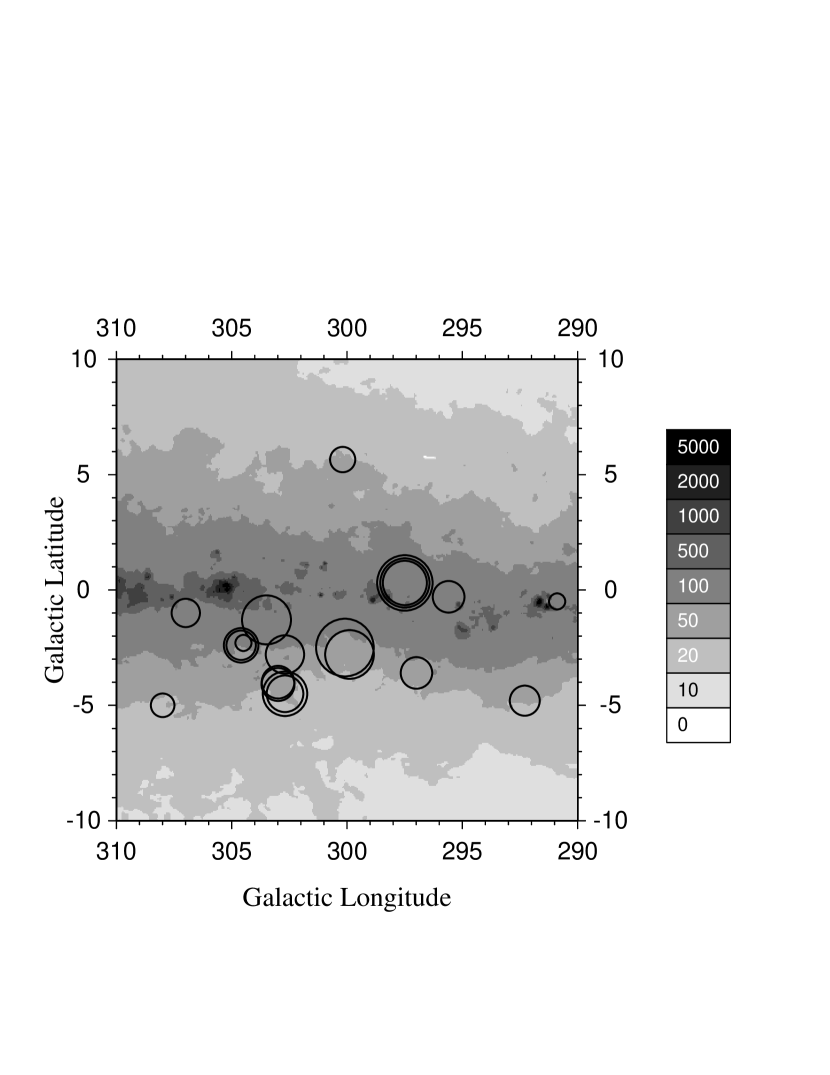
Our observed values for each of the 6 FUSE bands and for the Voyager spectra at the same wavelengths are listed in Table 1 and are superimposed on a 100 µm map from IRAS in Fig. 1. The circles are centred on the observed locations and the diameter of each circle is proportional to the weighted average of the intensity in the 2A2 and 1B1 bands at an effective wavelength of about 1114 Å.
3 RESULTS AND MODELING
It is apparent from Fig. 1 and Fig. 2, where the weighted average of the 2A2 and 1B1 bands are plotted against the 100 µm intensity, that there is not a simple correlation between the UV and IR emission. There is a tendency for the amount of diffuse UV light to increase with the IR emission up to an intensity of about 80 MJy sr-1, but with a lot of scatter. This correlation breaks down for larger IR intensities possibly suggesting that both the IR and UV emission are dominated by emission from the foreground cloud at lower H I column densities (as traced by the IR) but not at higher column densities where the IR emission is largely due to emission from dust in the optically thick Coalsack molecular cloud.
The scattered UV light from any location in space is a function of the interstellar radiation field (ISRF), the amount of dust in the line of sight and the scattering function of the dust grains. Of these, the ISRF is the easiest to derive as the Coalsack is so thick that no stars will be seen from behind the cloud, particularly in the UV, and the radiation field is dominated by only 13 stars (Table 3). As described by Sujatha et al. (2004) we have used the Hipparcos catalog to locate the stars in 3-dimensions and calculated their contribution at the location of scattering based on their spectral type, V magnitude, and appropriate Kurucz models (Kurucz, 1992). Not less than 95% of the total ISRF in the vicinity of the Coalsack comes from these stars. This method is identical to that of Shalima & Murthy (2004) except that they had incorrectly scaled the FUV fluxes of the stars to observations made with the small aperture of the International Ultraviolet Explorer. The small aperture of IUE is known to underestimate stellar fluxes by about 40% and thus they derived an albedo that was too high by the same factor. The FUV fluxes used in this work are in agreement with large aperture IUE observations of the stars.
The dust distribution has been well characterized by Corradi et al. (2004) using 4 color photometry of several hundred stars in the region. They have found, in addition to the Coalsack Nebula itself at a distance of 180 pc, two foreground clouds of neutral hydrogen at distances of 60 pc and 120 - 150 pc. The column densities (N(H I)) of these clouds are 3.2 1019 cm-2 and 1.5 1021 cm-2, respectively. We have used all three clouds in our modeling but note that most of the observed light comes from the more distant of the two H I clouds.
We have implemented a Monte Carlo code to account for multiple scattering in all three clouds: the two foreground neutral hydrogen clouds and the Coalsack molecular cloud. In this code, a photon is emitted in a random direction from one of the stars and continues in a straight line until it has an interaction with a dust grain, the probability of which depends on the local density and the grain cross-section, taken from the “Milky Way” model of Weingartner & Draine (2001). This model uses a mixture of silicate and graphite grains with implicit assumptions of RV = 3.1 and the canonical gas-to-dust ratio of Bohlin et al. (1978). After each interaction, the relative weight of the photon is reduced by the albedo and it is scattered into a new direction with a probability taken from the Henyey-Greenstein scattering function (Henyey & Greenstein, 1941). Each individual photon is followed either until its weight becomes negligible or the photon escapes the region of interest. A complete run consists of about photons emitted for each star for each value of and .
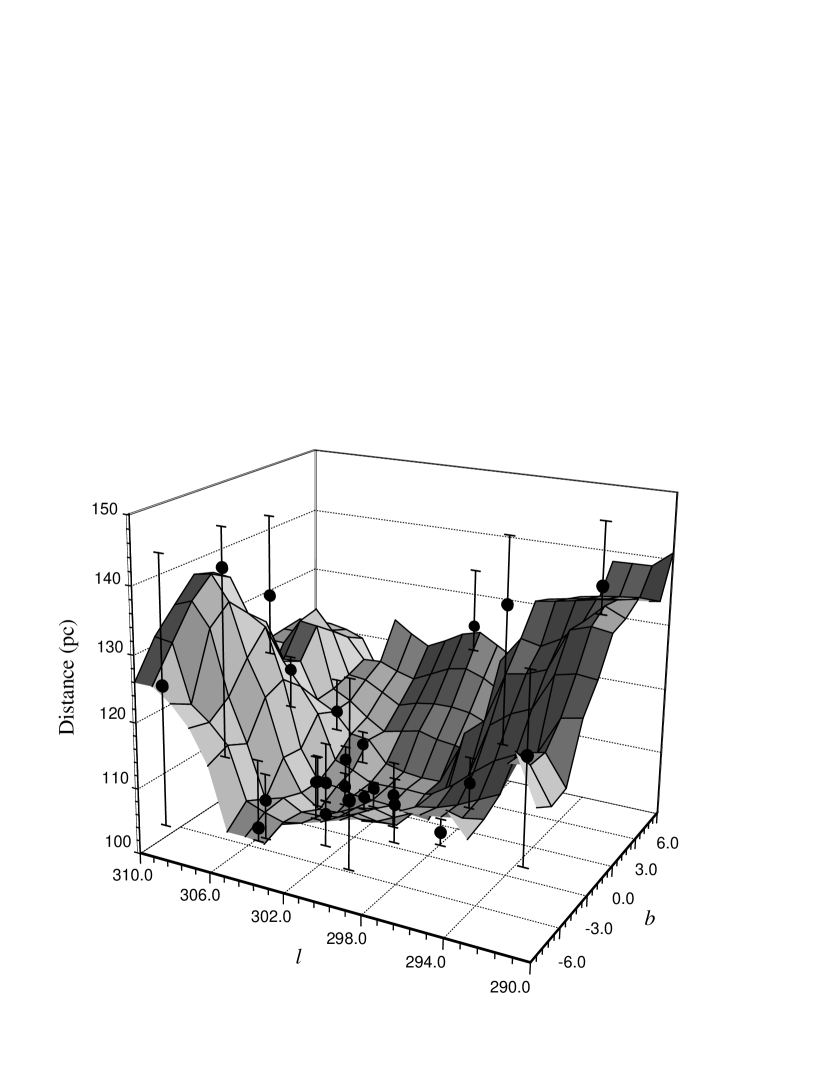
We found that most of the observed radiation arose in the more distant of the two foreground clouds and hence most of the uncertainty in our model results comes from the uncertainty in the actual distance of that cloud. Because there is no reason to assume that the cloud is flat and perpendicular to our line of sight, we have derived the distance at each scattering location by finding the combination of optical constants ( and ) and distance which gives the best match of the predicted light with the observed value (weighted average of the 2A2 and 1B1 bands, i.e., at 1114 Å), with the further assumption that the optical constants are the same throughout the region. These distances are plotted in Fig. 3 with error bars showing the range of allowed distances. Any point outside this allowed region will not satisfy our conditions of uniform and . Given the sparse nature of our data, we find a contiguous but warped cloud.
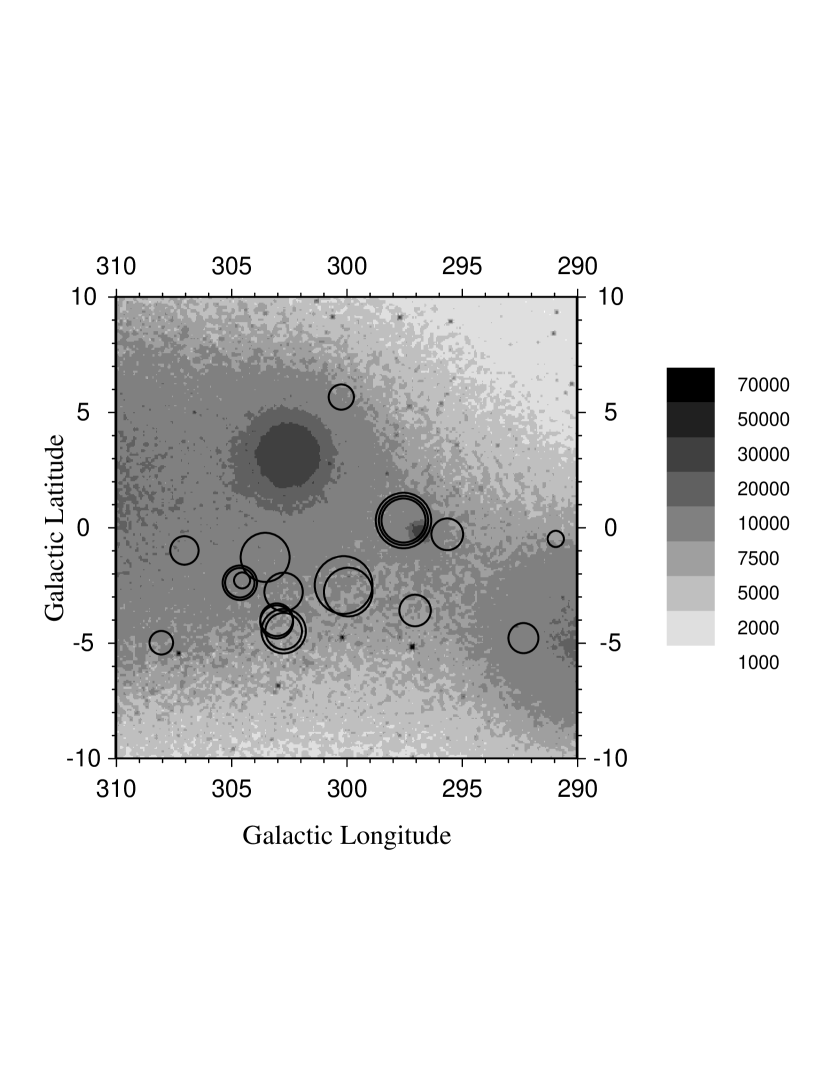
Our final model assumes three clouds each with a 1 pc thickness (defined by our bin size): the Coalsack molecular cloud at a distance of 180 pc, a cloud of neutral hydrogen at a distance of 60 pc from the Sun, and the cloud illustrated in Fig. 3b with a distance at each point as found from the best fit to the data. The output of this model is an image of the region around the Coalsack for each value of the optical constants which can be directly compared to the observations in each of the wavelength bands. Fig. 4 shows this image for the best fit values of and (0.28 and 0.61, respectively) at a wavelength 1114 Å, with our observations plotted as circles whose diameters are proportional to the weighted average of the 2A2 and 1B1 bands.
The 6 FUSE bands (Table 2) allowed observations at 4 wavelengths (1004 Å, 1058 Å, 1114 Å, and 1158 Å) where the intensities at 1114 Å and 1158 Å were taken from the weighted average of the 2A2 and 1B1 bands and 2A1 and 1B2 bands, respectively. The Voyager UVS is far more sensitive to diffuse radiation because of its relatively large aperture and allowed observation of the entire spectrum of the diffuse radiation between 912 Å (the Lyman limit) and 1200 Å.
Our predictions from our best fit model agree well with the observations both spatially (Fig. 5) and spectrally (Fig. 6). We have plotted 67% and 95% confidence contours (following the procedure of Lampton et al. (1976)) for and in Fig. 7. They are consistent with values of for the albedo and for the phase function asymmetry factor throughout the spectral range from 912 Å to 1200 Å (Fig. 8), in agreement with the prediction of Weingartner & Draine (2001) for their “Milky Way” model. The error bars in the optical constants include both observational errors and errors in the modeling, such as in the distance.
4 CONCLUSIONS
We have used Voyager and FUSE observations of diffuse emission near the Coalsack Nebula to constrain the optical parameters of the interstellar dust. We find that the albedo is and is throughout the spectral range from 900 to 1200 Å. These values are consistent with previous determinations in reflection Nebulae (Witt et al., 1993; Burgh et al., 2002), in diffuse clouds (Sujatha et al., 2005), and in Orion (Shalima et al., 2006). It is clear that interstellar grains in the FUV are strongly forward scattering with a moderately low albedo, in agreement with theoretical prediction for a mixture of graphite and silicate grains (Weingartner & Draine, 2001). Even though small grains have been depleted in Orion (R; Fitzpatrick (1999)), it makes little difference to the optical constants (Weingartner & Draine, 2001) and our data cannot distinguish between them.
It had been our hope that we could derive a global model for the diffuse UV radiation over the entire sky. However, we have found the true situation to be more complex with the radiation being dependent largely on the presence of scattering dust near a hot star. In particular, we note that the SPEAR data (Edelstein et al., 2006) show strong enhancements in the diffuse emission in the Ophiuchus and Coalsack regions which one might have naively associated with the prominent molecular clouds in those regions. However, our detailed modeling (Sujatha et al. (2005) and this paper, respectively) have shown that the emission is actually due to scattering from a much thinner foreground cloud. We plan to continue our characterization of the diffuse UV radiation field and its implications for the nature of the interstellar dust using Voyager, FUSE and GALEX (Galaxy Evolution Explorer) observations.
References
- Bohlin et al. (1978) Bohlin, R. C., Savage, B. D., & Drake, J. F. 1978, ApJ, 224, 132
- Burgh et al. (2002) Burgh, E. B., McCandliss, S. R., & Feldman, P. D. 2002, ApJ, 575, 240
- Cole et al. (1999) Cole, A. A., Wood, K., & Nordsieck, K. H. 1999, AJ, 118, 2292
- Corradi et al. (2004) Corradi, W. J. B., Franco, G. A. P., & Knude, J. 2004, MNRAS, 347, 1065
- Edelstein et al. (2006) Edelstein, J., et al. 2006, ApJ, 644, 153
- Fitzpatrick (1999) Fitzpatrick, E. L. 1999, PASP, 111, 63
- Haikala et al. (1995) Haikala, L. K., Mattila, K., Bowyer, S., Sasseen, T. P., Lampton, M., & Knude, J. 1995, ApJ, 443, 33
- Henyey & Greenstein (1941) Henyey, L. C., & Greenstein, J. L. 1941, ApJ, 93, 70
- Kurucz (1992) Kurucz, R. L. 1992, in The Stellar Populations of Galaxies, IAU Symp., 149, ed. B. Barbuy & A. Renzini (Dordrecht: Kluwer), 225
- Lampton et al. (1976) Lampton, M., Margon, B., & Bowyer, S. 1976, ApJ, 208, 177
- Lee et al. (2006) Lee, D. H., et al. 2006, ApJ, 644, L181
- Mathis et al. (2002) Mathis, J. S., Whitney, B. A., & Wood, K. 2002, ApJ, 574, 812
- Maucherat-Joubert et al. (1980) Maucherat-Joubert, M., Deharveng, J. M., & Cruvellier, P. 1980, A&A, 88, 323
- Moos et al. (2000) Moos, H. W., et al. 2000, ApJ, 538, 1
- Murthy et al. (1999) Murthy, J., Hall, D., Earl, M., Henry, R. C., & Holberg, J. B. 1999, ApJ, 522, 904
- Murthy et al. (1994) Murthy, J., Henry, R. C., & Holberg, J. B. 1994, ApJ, 428, 233
- Murthy & Sahnow (2004) Murthy, J., & Sahnow, D. J. 2004, ApJ, 615, 315
- Perryman et al. (1997) Perryman, M. A. C., et al. 1997, A&A, 323, 49
- Sahnow et al. (2000) Sahnow, D. J., et al. 2000, ApJ, 538, 7
- Schiminovich et al. (2001) Schiminovich, D., Friedman, P. G., Martin, C., & Morrissey, P. F. 2001, ApJ, 563, 161
- Shalima & Murthy (2004) Shalima, P., & Murthy, J. 2004, MNRAS, 352, 1319
- Shalima et al. (2006) Shalima, P., Sujatha, N. V., Murthy, J., Henry, R. C., & Sahnow, D. J. 2006, MNRAS, 367, 1686
- Sujatha et al. (2004) Sujatha, N. V., Chakraborty, P., Murthy, J., & Henry, R. C. 2004, BASI, 32, 151
- Sujatha et al. (2005) Sujatha, N. V., Shalima, P., Murthy, J., & Henry, R. C. 2005, ApJ, 633, 257
- Weingartner & Draine (2001) Weingartner, J. C., & Draine, B. T. 2001, ApJ, 548, 296
- Witt et al. (1993) Witt, A. N., Petersohn, J. K., Holberg, J. B., Murthy, J., Dring, A., & Henry, R. C. 1993, ApJ, 410, 714
| No. | Data ID | Target Name | Observed UV Intensity Error (photons cm-2 s-1 sr-1 Å-1) | IR 100 µm | |||||||
|---|---|---|---|---|---|---|---|---|---|---|---|
| (deg) | (deg) | 1A1 | 1A2 | 2A2 | 1B1 | 1B2 | 2A1 | (MJy sr-1) | |||
| (1004 Å) | (1058 Å) | (1112 Å) | (1117 Å) | (1157 Å) | (1159 Å) | ||||||
| 1 | Voyager 1aaMurthy et al. (1999) | BKGND3 | 301.7 | -1.7 | 13165 366 | 16212 590 | 17023 730 | 18500 800 | 23675 1500 | 23700 1500 | 123 |
| 2 | Voyager 2bbMurthy et al. (1994) | Coalsack | 303.7 | 0.8 | 9240 1000 | 10750 545 | 13950 2000 | 11519 700 | 15120 800 | 15210 1000 | 343 |
| 3 | Voyager 3bbMurthy et al. (1994) | Coalsack | 303.7 | 0.8 | 10880 700 | 13815 700 | 14000 2300 | 13823 700 | 15916 1200 | 14104 800 | 343 |
| 4 | Voyager 4bbMurthy et al. (1994) | Coalsack | 304.6 | -0.4 | 4311 500 | 6140 500 | 11900 2400 | 8295 500 | 11150 800 | 11000 1000 | 400 |
| 5 | Voyager 5bbMurthy et al. (1994) | Coalsack | 305.2 | -5.7 | 9450 500 | 11060 700 | 8000 2000 | 11520 1000 | 16720 1200 | 15500 1500 | 35 |
| 6 | B0680101 | Gamma-Cru | 300.17 | 5.65 | 1045 792 | 3077 825 | 3031 518 | 289 219 | 539 408 | 3818 938 | 26 |
| 7 | D0260101 | HD113708 | 304.55 | -2.39 | 8830 2995 | 9228 2450 | 6640 2010 | 20065 2188 | 20591 2444 | 6780 2126 | 107 |
| 8 | D0260102 | HD113708 | 304.55 | -2.39 | 5304 3078 | 7611 2093 | 6627 5022 | 14273 3724 | 11357 2194 | 5788 4386 | 107 |
| 9 | D0260201 | HD113659 | 304.52 | -2.26 | 7544 4087 | 7254 1815 | 6468 3903 | 13014 3199 | 10914 1836 | 4074 3087 | 120 |
| 10 | D0260301 | HD111641 | 302.97 | -3.98 | 3647 2339 | 6132 1319 | 3031 518 | 13779 2020 | 10584 1736 | 3461 674 | 53 |
| 11 | D0260302 | HD111641 | 302.97 | -3.98 | 8422 2586 | 8733 1547 | 12287 3606 | 14065 2035 | 13242 1723 | 4803 2941 | 53 |
| 12 | D0260401 | HD111195 | 302.65 | -4.49 | 5772 2082 | 8091 1472 | 8838 1693 | 10249 1482 | 10459 1473 | 7687 1814 | 62 |
| 13 | D0260402 | HD111195 | 302.65 | -4.49 | 8194 2188 | 10160 1561 | 10778 1576 | 9044 1419 | 8583 1990 | 11029 1790 | 62 |
| 14 | D0260501 | HD111283 | 302.69 | -2.72 | 6666 4015 | 9077 2191 | 6648 5038 | 12683 2164 | 15342 3167 | 7048 4859 | 83 |
| 15 | D0260601 | HD116796 | 306.94 | -0.95 | 4338 2510 | 4139 1650 | 4627 3506 | 4827 897 | 3119 2364 | 3791 2708 | 203 |
| 16 | D0260701 | HD117667 | 299.95 | -2.73 | 23614 5031 | 22132 4400 | 16511 6952 | 13621 3080 | 14986 4366 | 12930 6116 | 67 |
| 17 | D0260702 | HD117667 | 299.95 | -2.73 | 9626 4093 | 12149 2720 | ccData nonexistent | 10161 2827 | 4667 3537 | ccData nonexistent | 67 |
| 18 | E0290101 | Coalsack-1 | 303.52 | -1.32 | 8926 1725 | 11212 824 | 10515 1375 | 10976 1073 | 9025 999 | 7224 1637 | 235 |
| 19 | E0290301 | Coalsack-3 | 297.02 | -3.62 | 3678 2787 | 5685 1544 | 5389 3621 | 13792 2019 | 13043 1994 | 3147 2385 | 64 |
| 20 | E0290401 | Coalsack-4 | 308.01 | -4.99 | 4216 2278 | 5957 1067 | 3741 2163 | 5487 1379 | 4861 1544 | 3024 1669 | 46 |
| 21 | S4050701 | HD96548-BKG | 292.32 | -4.83 | 7051 766 | 9408 1521 | 8270 2461 | 9441 1667 | 8141 1284 | 8979 1148 | 53 |
| 22 | S4051701 | HD104994-BKGD | 297.56 | 0.34 | 10005 1305 | 12378 796 | 17134 1162 | 11626 878 | 11241 980 | 11823 1318 | 258 |
| 23 | S4055301 | WR42-HD97152-BGD | 290.95 | -0.49 | 660 500 | 1288 541 | 3031 518 | 144 109 | 360 273 | 3461 674 | 267 |
| 24 | S4055801 | HD102567-BKGD | 295.61 | -0.24 | 3538 1256 | 5279 455 | 1767 527 | 3452 690 | 3206 849 | 5330 915 | 266 |
| 25 | S4059101 | HD104994-BKGD | 297.56 | 0.34 | 8711 1056 | 10994 589 | 11305 1059 | 9852 693 | 8971 618 | 9659 715 | 258 |
| 26 | S5052801 | HD108002-BKGD | 300.16 | -2.48 | 10808 3230 | 17048 1309 | 16862 3320 | 13498 2022 | 11437 2069 | 13198 3158 | 68 |
| 27 | S5059001 | POLE-BKGD | 307.12 | -2.44 | 1953 1359 | 5221 682 | 7151 2213 | 4157 981 | 6476 868 | 2498 1317 | 78 |
| 28 | S5059101 | POLE-BKGD | 303.9 | -8.14 | 1458 724 | 4522 565 | 5985 1032 | 4019 488 | 3646 927 | 2136 1042 | 20 |
| 29 | S5059102 | POLE-BKGD | 303.9 | -8.14 | 1707 1294 | 4872 1622 | 2044 1549 | 2134 1617 | 1985 1304 | 2213 1677 | 20 |
| 30 | S5059201 | POLE-BKGD | 301.97 | -2.14 | 10641 1674 | 13708 845 | 16677 1393 | 10501 829 | 9378 924 | 8117 1940 | 60 |
| 31 | S5059302 | POLE-BKGD | 298.92 | -8.51 | 2792 1513 | 4377 1359 | 4769 2393 | 4441 1428 | 2767 1501 | 1645 849 | 12 |
| 32 | S5160101 | HD104994 | 297.56 | 0.34 | 8475 1395 | 12669 695 | 15611 1863 | 11667 884 | 10333 931 | 12731 1245 | 258 |
| 33 | S5058901 | POLE-BKGD | 308.54 | -8.86 | 645 489 | 2220 515 | 4948 1169 | 3980 550 | 3918 652 | 4156 928 | 14 |
| 34 | S5058902 | POLE-BKGD | 308.54 | -8.86 | 1155 875 | 2001 710 | 1958 1448 | 3046 851 | 2699 978 | 1118 847 | 14 |
| Detector bands | Wavelength range | Average Wavelength | |
|---|---|---|---|
| (Å) | (Å) | ||
| LiF | 1A1 | 987.1 - 1020.8 | 1004 |
| LiF | 1A2 | 1034.8 - 1081.4 | 1058 |
| LiF | 2A2 | 1095.0 - 1128.6 | 1112 |
| LiF | (2A2+1B1)/2**Derived band | 1114 | |
| LiF | 1B1 | 1100.3 - 1133.7 | 1117 |
| LiF | 1B2 | 1133.7 - 1180.1 | 1157 |
| LiF | (1B2+2A1)/2**Derived band | 1158 | |
| LiF | 2A1 | 1142.0 - 1175.3 | 1159 |
| HD Number | Name | l | b | Sp. TypeaaFrom Hipparcos Catalog (Perryman et al., 1997) | DistanceaaFrom Hipparcos Catalog (Perryman et al., 1997) | LuminositybbUsing Kurucz Model scaled to V magnitude. at 1100 Å |
|---|---|---|---|---|---|---|
| (deg) | (deg) | (pc) | (photons s-1 Å-1) | |||
| 122451 | Cen | 311.77 | 1.25 | B1III | 161.3 | 2.451046 |
| 108248 | Cru | 300.13 | -0.36 | B0.5IV | 98.3 | 1.281046 |
| 111123 | Cru | 302.46 | 3.18 | B0.5IV | 108.1 | 1.01046 |
| 93030 | Car | 289.6 | -4.9 | B0Vp | 134.6 | 4.621045 |
| 104841 | Cru | 297.64 | -0.78 | B2IV | 230.9 | 1.381045 |
| 99264 | 296.32 | -10.51 | B2IV-V | 271.0 | 1.171045 | |
| 91465 | PP Car | 287.18 | -3.15 | B4Vne | 152.4 | 6.871044 |
| 102776 | J Cen | 296.18 | -1.73 | B3V | 140.9 | 3.451044 |
| 92938 | V518 Car | 289.56 | -5.00 | B3V | 139.9 | 2.291044 |
| 93607 | 289.97 | -4.69 | B3IV | 137.7 | 1.951044 | |
| 103884 | Glazar Cru 135 | 296.76 | -0.22 | B3V | 183.5 | 1.771044 |
| 93194 | 289.50 | -4.46 | B5Vn | 148.4 | 6.611043 | |
| 99103 | 293.78 | -3.66 | B5 | 145.6 | 6.001043 |
Note. — Stars in descending order of UV luminosity