Advances in Reverberation Mapping
Abstract
This contribution briefly reviews the reverberation mapping technique which leads to determination of black hole masses. I focus on the emerging relation between the broad-line region size and the active galactic nucleus (AGN) luminosity, and on an overview of recent results of reverberation mapping studies which are starting to cover the full AGN luminosity range. Preliminary results and time lag determination from a reverberation mapping program of high-luminosity quasars are also presented.
School of Physics & Astronomy and the Wise Observatory,
Tel-Aviv University Tel-Aviv 69978, Israel
Physics Department, Technion, Haifa 32000, Israel
1. Introduction
While the physical origin of Active Galactic Nuclei (AGNs) continuum variability is still unclear, it is possible to use the “reverberation mapping” technique to study the geometry and kinematics of the gas in the Broad Line Region (BLR), and to deduce the mass of the central black hole (BH) in the center of the AGN. The technique is based on the response of the ambient gas to changes in the central continuum source. Such response was first used to account for the observations of the apparent expansion of Nova Persei in 1901 (Couderc 1939) and has been proposed to explain the light curves of Type I supernovae (Morrison & Sartori 1969). The method was first suggested to be used in the analysis of AGN light curves by Bahcall, Kozlovsky, & Salpeter (1972), who calculated the response of the line intensity in a spherical distribution of gas. Blandford & McKee (1982) were the first to coin the term “reverberation mapping” and put it into mathematical formalism with the fundamental equation that relates the emission-line and continuum light curves, and :
| (1) |
where is the velocity field of the BLR (which manifest itself in the emission-line profile), and is defined from this equation as the transfer function, which holds in it the information about the geometry and kinematics of the BLR. The latter was studied by several authors who showed how can be derived from the observed continuum and line light curves and how will changed for different geometries and kinematics of the BLR (e.g., Welsh & Horne 1991; Perez et al. 1992; Horne et al. 2004).
In practice, in order to get the line and continuum light curves, the AGN needs to be monitored frequently over a period of time (from days to weeks depending on the AGN luminosity and variability characteristics). First attempts to carry out AGN reverberation mapping used poorly sampled light curves and low resolution spectra (e.g., Peterson 1988 and references therein), thus leading to a collapse of the two-dimension transfer function, , into one-dimension transfer function . In fact this is further collapsed into only one parameter: the time lag between the line light curve and the continuum light curve. The time lag is defined as the centroid of the cross correlation function (CCF) between the continuum and line light curves:
| (2) |
where N is the number of points used in the sum for the lag , and are the rms of the light curves, and the light curves have zero mean. The centroid of this CCF is taken to be a measure for the size of the BLR, denotes as . Once is found from reverberation mapping the mass of the BH in the center of the AGN can be estimated using:
| (3) |
where is a measure of the BLR clouds’ velocity, and is a dimensionless factor that depends of the geometry and kinematics of the BLR. The mass—luminosity relation is further discussed in Peterson’s contribution to these proceedings and will not be discussed here.
Over the past two decades many monitoring campaigns were carried out and enabled the measurement of in about three dozen AGNs. Some of the notable projects are: (1) Individual monitoring of Seyfert I galaxies (e.g., Mrk 279, NGC 5548, NGC 4151 — Maoz et al. 1991 — and many more by the “AGN Watch”111http://www.astronomy.ohio-state.edu/agnwatch/ projects — Peterson 1999). (2) The Lover of Active Galaxies (LAG) campaign (e.g., Robinson 1994). (3) The Ohio State University monitoring program (Peterson et al. 1998). (4) The Wise Observatory and Steward Observatory 17 Palomar-Green (PG) quasars monitoring program by Kaspi et al. (2000). For recent reviews of the subtleties of the reverberation mapping technique see Peterson (1993), Netzer & Peterson (1997), Peterson (2006) and references therein. In the following sections I will summarize the current situation and recent studies using reverberation mapping. I will also try to point on directions I think reverberation mapping should take in the near future.
2. Size—Luminosity Relation
Peterson et al. (2004) compiled all available reverberation-mapping data, obtained up to then, and analyzed them in a uniform and self-consistent way to improve the determination of the time lags and their uncertainties and derived for all objects with available data. Kaspi et al. (2005) used these size measurements to study the relation between and the Balmer emission line, X-ray, UV, and optical continuum luminosities. This relation is a fundamental relation in AGNs study since both quantities ( and ) are directly obtained from measurements with minimum assumptions and models. Once this relation is determined for the objects with reverberation-mapping data, it is used to estimate the mass of the BH in other AGNs by using a ‘single-epoch measurements’ of their luminosity and the line width (e.g., Wang & Lu 2001; Woo & Urry 2002; Grupe & Mathur 2004). To study the robustness of the correlation Kaspi et al. (2005) used data subsamples and two different regression methods: (1) The linear regression method of Press et al. (1992), in which a straight-line is fitted to the data with errors in both coordinates (known as FITEXY) and follow Tremaine et al. (2002) procedure to account for the intrinsic scatter in the relation. (2) The bivariate correlated errors and intrinsic scatter (BCES) regression method of Akritas & Bershady (1996).
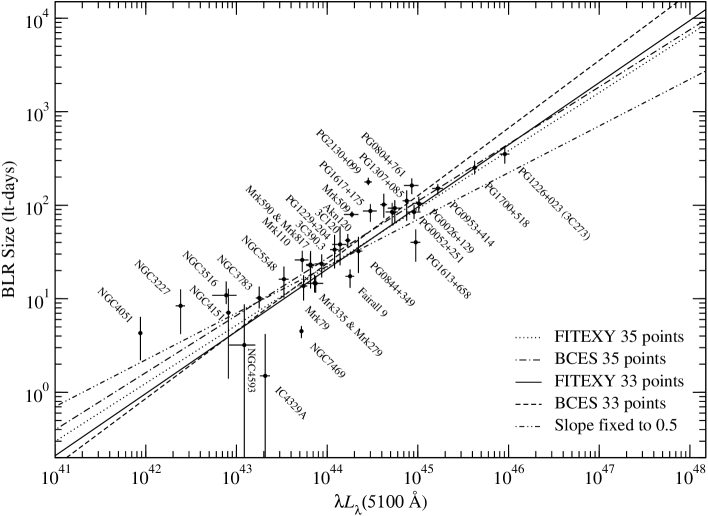
Assuming a power-law relation Kaspi et al. (2005) find that the mean best-fitting is about for the optical continuum and the broad H luminosity, about for the UV continuum luminosity, and about for the X-ray luminosity. They also find an intrinsic scatter of % in these relations. In Fig. 1 the mean Balmer-line BLR size versus the (5100 Å) luminosity is plotted, with one averaged point per object. Four fits are shown: using all 35 points, excluding the two low luminosity AGNs (which are heavily influenced by intrinsic reddening), and with the two fitting methods. Within the luminosity range of the measurements (– ergs s-1) all fits are consistent with each other and all are well within the scatter of the points in the plot. The disagreement of these results with the theoretical expected slope of 0.5 indicates that the simple assumption of all AGNs having on average same ionization parameter, BLR density, column density, and ionizing spectral energy distribution, is not valid and there is likely some evolution of a few of these characteristics along the luminosity scale.
Bentz et al. (2006) used high-resolution images of the central region of 14 of the reverberation-mapped AGNs (mostly the low luminosity ones) and accounted for the host-galaxy star light contamination of the AGN luminosities. Removing the star-light contribution and excluding several points (some of which do not have measured star-light contributions, do not have reliable H BLR size measurement, or have nuclear structure and reddening that influence the luminosity measurement), they find the power-law slope of the size—luminosity relation to be (see Bentz’ contribution in these proceedings).
3. Expanding the Luminosity Range
Current reverberation mapping studies cover the luminosity range of – erg s-1. Since the full AGN luminosity range is 4 orders of magnitude larger than this range and span the range – ergs s-1, there is an essential need to carry out reverberation mapping studies for lower- and higher-luminosity AGNs. Hopefully such broadening of the luminosity range will help to define better the slope of the size—luminosity relation.
Since most reverberation-mapping studies mentioned above were based on Balmer emission lines, generally H, and on optical luminosity, single-epoch estimates for objects at redshifts have had to rely either on IR observations (e.g., Shemmer et al. 2004) or on attempts to extend the optically based size—luminosity relation to UV luminosities and UV broad emission lines (e.g., McLure & Jarvis 2002; Vestergaard & Peterson 2006). While important progress has been made, there are still a number of potential problems that need to be addressed (e.g., Maoz 2002; Baskin & Laor 2005). Thus, the single-epoch measurements depend on the untested assumption that these extrapolations are valid. Although a posteriori explanations of the physical plausibility of the observed relations can be found, it is quite possible that subtle or strong deviations from the relations occur at high luminosities or redshifts (Netzer 2003).
3.1. Reverberation Mapping of High-Luminosity AGNs
Reverberation mapping of high-luminosity quasars is an ambitious task. Quasars of the highest luminosities (with bolometric luminosity, – ergs s-1) are expected to harbor some of the most massive BHs known, with . More massive BHs may have slower continuum flux variations with smaller amplitudes (e.g., Giveon et al. 1999; Vanden Berk et al. 2004). The required observing periods of high-luminosity quasars are also significantly lengthened by cosmological time dilation, since such sources are typically found at high redshifts (). On the other hand, the ability to monitor high- objects in the rest-frame UV, in which AGN variability amplitudes are routinely higher than in the optical, can lead to better characterized continuum light curves. The smaller intrinsic variability amplitude of the continuum could result in smaller flux-variability amplitudes for the emission lines, affecting the ability to detect the time delay in the BLR response. Furthermore, high-redshift sources are fainter and hence more difficult to observe. Probably due to all of these possible problems, no reverberation measurements exist for AGNs with ergs s-1, and several attempts at such measurements have so far not been successful (e.g., Welsh et al. 2000; Trevese et al. 2006; A. Marconi 2005, private communication).
In view of the many unknowns and the opposing effects entering the above discussion, and considering the importance of the subject, over a decade ago, we began a reverberation-mapping program aimed at high-luminosity, high-redshift AGNs (Kaspi et al. 2007). The sample of 11 high-luminosity quasars was selected in 1994 from the Veron-Cetty & Veron (1993) catalog. These are high declination () objects, with observed magnitude , redshifts in the range , and in the luminosity range of ergs s-1. This is an order of magnitude higher than other AGNs with existing reverberation measurements (see Fig. 1).
All 11 AGNs are monitored photometrically at the Wise Observatory (WO) 1 m telescope since 1995 in and bands. Since the targets have high declinations, they can be observed from the WO for about 10 months a year, with observations scheduled about once every month. Spectrophotometric monitoring of six of the 11 quasars has been carried out since 1999 at the 9 m Hobby-Eberly Telescope (HET). Observations are carried out using a comparison star which is observed in the slit simultaneously with the quasar and serves for spectrophotometric calibration of the quasar under non-photometric conditions. For details of the observational and reduction technique see, e.g., Maoz et al. (1994) and Kaspi et al. (2000).
The continuum light curves of all 11 quasars show variations of 10–70% measured relative to the minimum flux. Comparing the variability characteristics of this sample to these of the lower-redshift PG quasar sample (Kaspi et al. 2000) the variability of the later is about double the variability of the high-luminosity quasars. The lower rest-frame variability measured in the continuum for the current sample is probably a manifestation of the general trend that high-luminosity AGNs have longer variability timescales (e.g., Vanden Berk et al. 2004), perhaps as a result of their higher BH masses.
None of the four Ly light curves shows significant variability. In contrast, the two C iii]1909 light curves and all six C iv1550 light curves show significant variability. The variability measures of these emission-line light curves are comparable to, or even greater than, those of their corresponding continuum light curves. There are few previous AGN UV data sets with which to compare these possible trends. The only quasar with UV variability data of similar quality is 3C273. Interestingly, Ulrich et al. (1993) noted the non-variability of Ly in this object, at a level of %, over a period of 15 years, despite factor-of-two variations in the continuum during the same period (there are no data for the C iv and C iii] lines during that time).
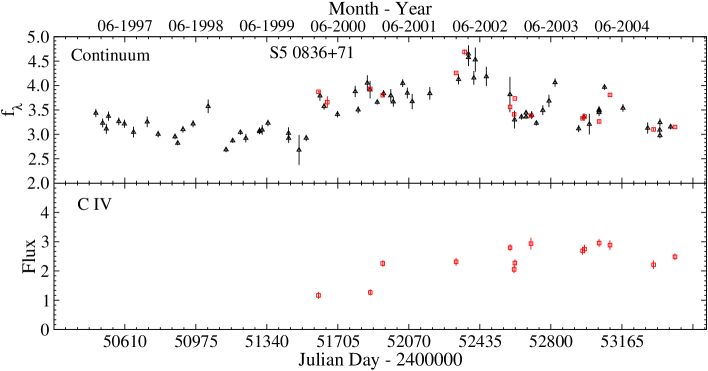
The main objective of our program is to detect and measure a time delay between the continuum and the line-flux variations in high-luminosity AGNs. The significant continuum and line variations that was observed during a decade demonstrate that, at least in principle, such a measurement may be feasible. Examining the light curves of the six quasars with emission-line data at the current stage of our project, all but one currently suffer from either low variability amplitude in the emission-line light curves or monotonically increasing or decreasing continuum light curves. The one current exception is S5 0836+71; although the data for this quasar are still not ideal for reverberation mapping they do allow a preliminary measurement of the emission-line to continuum lag. Figure 2 shows the continuum and C iv emission line light curves for this object. These light curves has largest variation among all our monitored quasars. Figure 3 shows the CCFs for these two light curves. The tentative time lag between the C iv line and the continuum of S5 0836+71 is found to be days, or days in the quasar rest frame.

The mean FWHM of the C iv line measured from the mean spectrum of S5 0836+71 is about 9700 km s-1. Using Eq. 5 of Kaspi et al. (2000) and the time lag of 188 days, the central mass of S5 0836+71 is estimated to be M. This is the highest mass directly measured for a BH in an AGN using reverberation mapping. 3C 273 (=PG 1226+023), the quasar with the highest directly measured mass so far, has a mass of M, (1350 Å)=2.0 ergs s-1, and (5100 Å)=9.1 ergs s-1. Thus, S5 0836+71 has a factor three higher mass and a factor higher luminosity than 3C 273.
3.2. Reverberation Mapping of low-Luminosity AGNs
Reverberation mapping of low-luminosity AGNs might be considered fairly easy due to the short timescales involved and the expected high-amplitude variability. However, as these objects are of low luminosity there will be a need of a 3–10 m class telescope to carry out reverberation mapping campaigns for such objects (for example the candidate AGNs with intermediate-mass BH from the sample by Green & Ho 2004). So far no reverberation mapping campaign for AGNs with optical luminosity ergs s-1 were carried out successfully.
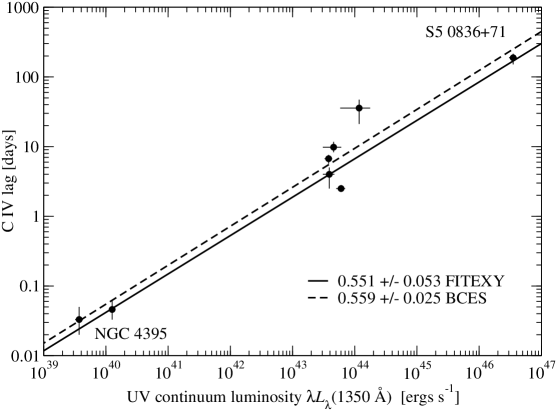
The one exception is NGC 4395 ((5100 Å)=5.9 ergs s-1) in which Peterson et al. (2005) measured the BLR size of its C iv emission line to be light hr. This is consistent with the size expected from extrapolating the – relation to lower luminosities. However, two optical campaigns to determine the H time lag of NGC 4395 were so far unsuccessful due to bad weather (Desroches et al. 2006 and contribution in these proceedings; Kaspi et al. 2007, in preparation).
Until recently, only four AGNs had measured C iv reverberation time lags: NGC 3783, NGC 5548, NGC 7469, and 3C 390.3 (see Peterson et al. 2004, for a summary). NGC 4395 is four orders of magnitude lower in luminosity than those four AGNs and S5 0836+71 is 3 orders of magnitude higher. Thus, a preliminary C iv-size—UV-luminosity relation over 7 orders of magnitude in luminosity can be determined. Figure 4 shows the data for the above 6 objects with the best fit slope using the two different fitting methods; and for the FITEXY and BCES methods, respectively.
4. Further Prospects of Reverberation Mapping
4.1. Two-Dimension Reverberation Mapping
The initial goal of the reverberation-mapping technique (Blandford & McKee 1982) is to study the geometry and kinematics of the BLR. This was not yet achieved due to poor spectroscopic data and insufficient time sampling. More detailed information on BLR geometry and kinematics in AGN can be obtained by studying line profile variations. Various researchers computed two-dimensional echo images for specific gas motions in the BLR: outward moving gas clouds, inward falling clouds, circulating gas clouds in a plane, or clouds orbiting in randomly-inclined orbits (e.g., Welsh & Horne 1991; Perez et al. 1992; Horne et al. 2004).
Only few studies attempted the two-dimensional reverberation mapping on actual data and none resulted with conclusive results. Recently, Kollatschny (2003; and contribution in these proceedings) used the monitoring data of Mrk 110 to study the variations in the line profiles and produced time-delay versus velocity maps. These maps resemble a disk transfer-function maps. Kollatschny (2003) finds that the outer line wing respond before the inner line profile and confirms the stratification of the ionizing structure in the BLR by showing that lower ionization lines respond after the higher ionization lines. Thus, With recent improved sensitivity of optical telescopes and the accumulated experience from previous mapping campaigns, it is becoming possible to obtain the crucial information about the geometry and kinematics of the BLR gas.
4.2. Dust Reverberation Mapping
IR emission in AGNs is considered to be from the alleged torus region which is at distances larger than the BLR from the BH. Thus, IR reverberation mapping might reveal the distance of the torus from the BH. Only few IR monitoring campaigns were carried out in the past two decades (e.g., Clavel et al. 1989; Glass 1992; Sitko et al. 1993). Recently, Suganuma et al. (2006; and see contribution in these proceedings) monitored the optical and IR emission in four additional objects and determined time lags. Together with previous results they are able to construct the torus-size—luminosity relation for 10 objects. They find the torus size to strongly correlate with the optical luminosity (the time lag is consistent with the square root of the luminosity) and that it weakly correlates with the mass of the BH.
4.3. X-ray FeK Reverberation Mapping
Several studies suggested the application of the reverberation mapping technique to the broad 6.4 keV FeK line seen in the X-ray band (e.g., Reynolds et al. 1999). This line is considered to emerge from the accretion disk in the very close vicinity of the BH, and using reverberation mapping will allow the measurement of the disk’s size. So far several attempts to apply this method did not produce significant results (e.g., Ballantyne et al. 2005 and references therein), implying either on the complicated connection between the broad 6.4 keV FeK line flux and the X-ray continuum, or on the fact that the X-ray data obtained so far were not sufficient for reverberation mapping.
5. Summary
Over the past two decades reverberation mapping of AGNs have yield measurements of the BLR size in about three dozen AGNs in the luminosity range – erg s-1). This enables to establish a scaling relation between the BLR size and luminosity in AGNs which, in turn, allows the estimate of the BH mass in AGNs. Using reverberation mapping of different emission lines implies about the radial ionization stratification of the BLR (higher ionized specious emits from inner BLR), and that motion of the gas in the BLR are virial and primarily orbital. Current BLR studies should aim at broadening the luminosity range to all AGNs (– erg s-1) and first steps toward low- and high-luminosity AGNs are being taken. Two-dimensional reverberation mapping is a promising direction which will produce information about the geometry and kinematics of the BLR. Reverberation mapping in the IR enables measurement of the dusty region in AGNs (torus) which seems to surrounds the BLR. On the other hand reverberation mapping of the inner accretion disk, using X-ray observations, is still to be proven feasible.
Acknowledgments.
I would like to thank the organizers for a stimulating meeting and for inviting me to give this talk. I thank my collaborators in the high-luminosity AGNs monitoring project, Dan Maoz, Hagai Netzer, W. N. Brandt, Donald P. Schneider, and Ohad Shemmer. I gratefully acknowledge the financial support of the Colton Foundation at Tel-Aviv University and the Zeff Fellowship at the Technion.
References
- Akritas & Bershady (1996) Akritas, M. G. & Bershady, M. A. 1996, ApJ, 470, 706
- Alexander (1997) Alexander, T. 1997, in Astronomical Time Series, ed. D. Maoz, A. Sternberg, & E. M. Leibowitz (Dordrecht: Kluwer), 163
- Bahcall et al. (1972) Bahcall, J. N., Kozlovsky, B.-Z., & Salpeter, E. E. 1972, ApJ, 171, 467
- Ballantyne et al. (2005) Ballantyne, D. R., Turner, N. J., & Young, A. J. 2005, ApJ, 619, 1028
- Baskin & Laor (2005) Baskin, A. & Laor, A. 2005, MNRAS, 356, 1029
- Bentz et al. (2006) Bentz, M. C., Peterson, B. M., Pogge, R. W., Vestergaard, M., & Onken, C. A. 2006, ApJ, 644, 133
- Blandford & McKee (1982) Blandford, R. D. & McKee, C. F. 1982, ApJ, 255, 419
- Clavel et al. (1989) Clavel, J., Wamsteker, W., & Glass, I. S. 1989, ApJ, 337, 236
- Couderc (1939) Couderc, P. 1939, Annales d’Astrophysique, 2, 271
- Desroches et al. (2006) Desroches, L.-B., et al. 2006, ApJ, 650, 88
- Gaskell (1994) Gaskell, C. M. 1994, in Reverberation Mapping of the Broad-Line Region in AGNs, ed. P. Gondhalekar, K. Horne, & B. M. Peterson (San Francisco: ASP), 111
- Giveon et al. (1999) Giveon, U., Maoz, D., Kaspi, S., Netzer, H., & Smith, P. S. 1999, MNRAS, 306, 637
- Glass (1992) Glass, I. S. 1992, MNRAS, 256, 23P
- Greene & Ho (2004) Greene, J. E., & Ho, L. C. 2004, ApJ, 610, 722
- Grupe & Mathur (2004) Grupe, D. & Mathur, S. 2004, ApJ, 606, L41
- Horne (2004) Horne, K., Peterson, B.M., Collier, S.J. & Netzer, H. 2004, PASP 116, 465
- Kaspi et al. (2000) Kaspi, S., Smith, P. S., Netzer, H., Maoz, D., Jannuzi, B. T., & Giveon, U. 2000, ApJ, 533, 631
- Kaspi et al. (2005) Kaspi, S., Maoz, D., Netzer, H., Peterson, B. M., Vestergaard, M., & Jannuzi, B. T. 2005, ApJ, 629, 61
- Kaspi et al. (2007) Kaspi, S., Brandt, W. N., Maoz, D., Netzer, H., Schneider, D. P., & Shemmer, O. 2007, ApJ, 659, 997
- Kollatschny (2003) Kollatschny, W. 2003, A&A, 407, 461
- Maoz (2002) Maoz, D. 2002, astro-ph/0207295
- Maoz et al. (1991) Maoz, D., et al. 1991, ApJ, 367, 493. Erratum 1993, ApJ, 413, 445
- Maoz et al. (1994) Maoz, D., Smith, P. S., Jannuzi, B. T., Kaspi, S., & Netzer, H. 1994, ApJ, 421, 34
- McLure & Jarvis (2002) McLure, R. J. & Jarvis, M. J. 2002, MNRAS, 337, 109
- Morrison & Sartori (1969) Morrison, P., & Sartori, L. 1969, ApJ, 158, 541
- Netzer (2003) Netzer, H. 2003, ApJ, 583, L5
- Netzer & Peterson (1997) Netzer, H. & Peterson, B. M. 1997, in Astronomical Time Series, ed. D. Maoz, A. Sternberg and E. Leibowitz (Dordrecht: Kluwer Academic Publishers), 85
- Perez (1992) Perez, E., Robinson, A., & de la Fuente, L. 1992, MNRAS, 256, 103
- Peterson (1993) Peterson, B. M. 1993, PASP, 105, 247
- Peterson (1999) Peterson, B. M. 1999, ASP Conf. Ser. 175: Structure and Kinematics of Quasar Broad Line Regions, 175, 49
- Peterson (2006) Peterson, B. M. 2006, in Physics of Active Galactic Nuclei at All Scales, ed. D. Alloin, R. Johnson, P. Lira (Berlin: Springer-Verlag), in press
- Peterson et al. (1998) Peterson, B. M., Wanders, I., Bertram, R., Hunley, J. F., Pogge, R. W., & Wagner, R. M. 1998, ApJ, 501, 82
- Peterson et al. (2004) Peterson, B. M., et al. 2004, ApJ, 613, 682
- Peterson et al. (2005) Peterson, B. M., et al. 2005, ApJ, 632, 799. Erratum: 2006, ApJ, 641, 638
- Press et al. (1992) Press, W. H., Teukolsky, S. A., Vetterling, W. T, & Flannery, B. P. 1992, Numerical Recipes in FORTRAN (Second ed.; Cambridge: Cambridge Univ. press)
- Reynolds et al. (1999) Reynolds, C. S., Young, A. J., Begelman, M. C., & Fabian, A. C. 1999, ApJ, 514, 164
- Robinson (1994) Robinson, A. 1994, ASP Conf. Ser. 69: Reverberation Mapping of the Broad-Line Region in Active Galactic Nuclei, 69, 147
- Sitko et al. (1993) Sitko, M. L., Sitko, A. K., Siemiginowska, A., & Szczerba, R. 1993, ApJ, 409, 139
- Shemmer et al. (2004) Shemmer, O., Netzer, H., Maiolino, R., Oliva, E., Croom, S., Corbett, E., & di Fabrizio, L. 2004, ApJ, 614, 547
- Suganuma et al. (2006) Suganuma, M., et al. 2006, ApJ, 639, 46
- Trevese et al. (2006) Trevese, D., Stirpe, G., Vagnetti, F., Zitelli, V., & Paris, D. 2006, proceedings of ”AGN Variability from X-rays to Radio Waves”, Eds. C. M. Gaskell, I. M. McHardy, B. M. Peterson, and S. G. Sergeev, astro-ph/0408075
- Tremaine et al. (2002) Tremaine, S., et al. 2002, ApJ, 574, 740
- Ulrich et al. (1993) Ulrich, M.-H., Courvoisier, T. J.-L., & Wamsteker, W. 1993, ApJ, 411, 125
- Vanden Berk et al. (2004) Vanden Berk, D. E., et al. 2004, ApJ, 601, 692
- Veron-Cetty & Veron (1993) Veron-Cetty, M.-P., & Veron, P. 1993, ESO Scientific Report, Garching: European Southern Observatory (ESO), 6th ed.
- Vestergaard & Peterson (2006) Vestergaard, M., & Peterson, B. M. 2006, ApJ, 641, 689
- Wang & Lu (2001) Wang, T. & Lu, Y. 2001, A&A, 377, 52
- Welsh (1991) Welsh, W.F., & Horne, K. 1991, ApJ, 379, 586
- Welsh et al. (2000) Welsh, W., et al. 2000, BAAS, 32, 1458
- White & Peterson (1994) White, R. J., & Peterson, B. M. 1994, PASP, 106, 879
- Woo & Urry (2002) Woo, J. & Urry, C. M. 2002, ApJ, 579, 530