A new comprehensive set of elemental abundances in DLAs
III. Star formation histories
††thanks: Based on UVES observations made with the European Southern Observatory
VLT/Kueyen telescope, Paranal, Chile, collected during the programme ID
No. 70.B–0258(A).
We obtained comprehensive sets of elemental abundances for eleven damped Ly systems (DLAs) at . For nine of them, we accurately constrained their intrinsic abundance patterns accounting for dust depletion and ionization effects. In Paper I of this series, we showed for three DLA galaxies that we can derive their star formation histories and ages from a detailed comparison of their intrinsic abundance patterns with chemical evolution models. We determine in this paper the star formation properties of six additional DLA galaxies. The derived results confirm that no single star formation history explains the diverse sets of abundance patterns in DLAs. We demonstrate that the various star formation histories reproducing the DLA abundance patterns are typical of local irregular, dwarf starburst and quiescent spiral galaxies. Independent of the star formation history, the DLAs have a common characteristic of being weak star forming galaxies; models with high star formation efficiencies are ruled out. The distribution of the DLA star formation histories shows a trend of finding more galaxies with a star formation history typical of dwarf irregulars with a bursting star formation toward high redshifts, . Only two DLA galaxies (each at ) in our sample of nine objects have a star formation history typical of spiral galaxies. Since DLAs sample the broad distribution of galaxies at high redshift, this trend indicates that young and less evolved proto-galactic structures with low masses and low star formation rates are more common toward higher redshifts. This is further supported by the star formation rate and age distributions. Indeed, all the derived DLA star formation rates per unit area are moderate or low, with values between M⊙ yr-1 kpc-2. The DLA abundance patterns also require a large spread in ages ranging from 20 Myr up to 3 Gyr. Enhanced over iron-peak ratios are associated with young objects having undergone a recent burst of star formation, while solar over iron-peak ratios are associated with old objects undergoing an inefficient continuous star formation. The oldest DLA in our sample is observed at with an age estimated to more than 3 Gyr; it nicely indicates that galaxies were already forming at . But, most of the DLAs show ages much younger than that of the Universe at the epoch of observation. Young galaxies thus seem to populate the high redshift Universe at , suggesting relatively low redshifts of formation () for most high-redshift galaxies. The large dispersion in star formation history and age indicates that the DLAs are drawn from a diverse population of galaxies. The DLA star formation properties are compared with those of other high-redshift galaxies identified in deep imaging surveys with the aim of obtaining a global picture of high-redshift objects.
Key Words.:
cosmology: observations – quasars: absorption lines – galaxies: abundances – galaxies: evolution1 Introduction
Quasar (QSO) absorption line systems provide an alternative means to study the high-redshift galaxy properties other than the traditional stellar luminosity selected galaxy samples (Steidel et al. 2003, and reference therein). Indeed, they are expected to select galaxies based on gas cross-section, rather than luminosity, and hence give a complementary view of the galaxy population to that obtained from emission-selected galaxies. The damped Ly systems (DLAs) with H i column densities higher than cm-2 are particularly interesting, since they contain the majority of the neutral gas at high redshifts and may provide the fuel reservoirs for subsequent star formation in galaxies (e.g. Wolfe et al. 1986; Prochaska et al. 2005).
The connection between the population of DLA absorbers and galaxy populations identified at high redshifts in deep imaging studies remains, however, a key topic in extragalactic astronomy today. While an evolutionary link between the emission-selected galaxies at and the bulge component of the galaxy population today is strongly suggested (Steidel et al. 1996; Adelberger et al. 2004; Steidel et al. 2005), an analogous connection for DLAs is still a matter of debate, because of the difficult detection of DLA galaxy counterparts (Møller et al. 2004). Indeed, the complete picture relating the gas cross-section, ionization and chemical abundances of the interstellar media and gaseous halos surrounding galaxies to the emission properties of the associated galaxy remains incomplete.
DLA galaxy counterparts are difficult to identify, because they typically lie at angular separations of the order of one arcsec from the quasar line of sight, and are therefore swamped by the light from the quasar. At high redshift (), despite large observational efforts, emission, in general from Ly, from seven DLA counterparts was detected and spectroscopically confirmed, but only four are not associated DLAs with the QSO, (see a summary by Weatherley et al. 2005). At lower redshift (), the DLA galaxy counterparts are more readily observed. Deep-imaging and follow-up spectroscopic surveys of the fields of DLA absorbers revealed host galaxies with a wide range of morphological types between spirals, irregulars, dwarfs, and low surface brightness galaxies (e.g. Le Brun et al. 1997; Rao et al. 2003; Chen et al. 2005).
Studies of elemental abundances in high-redshift DLAs have, on the other hand, achieved large statistical samples over the last few years. This progress is the result of 8–10 m class telescopes and the high resolution spectroscopy. The HIRES spectrograph on the Keck I telescope at Mauna Kea, Hawaii, was the first in operation and allowed the routine detection of elements in DLAs: Al, Si, S, Cr, Mn, Fe, Ni, and Zn (e.g. Lu et al. 1996; Prochaska & Wolfe 1999). With the arrival of the UVES spectrograph on the Very Large Telescope (VLT) ESO telescope at Cerro Paranal, Chile, with a better efficiency in the blue ( Å) and in the red ( Å), additional element abundances can now be accurately measured in DLAs: C, N, O, Mg, P, Ar, and Ti, plus the deuterium and the molecular hydrogen (e.g. Levshakov et al. 2002; Petitjean et al. 2000). Moreover, for some specific DLAs, the so-called metal-strong DLAs, the access to new elements, several beyond the Fe-peak, is becoming very promising (Prochaska et al. 2003; Herbert-Fort et al. 2006).
The main motivation common to all these observational efforts is to understand the physical processes at play in the formation and evolution of galaxies. To achieve this goal, the chemical information can be used as one of the possible means at our disposal to link the properties of DLA high-redshift galaxies with both those of present-day galaxies and other galaxies detected at high redshifts. Indeed, with the measure of so many different elemental abundances, DLAs are real physical laboratories. In Dessauges-Zavadsky et al. (2004, hereafter Paper I), we showed for three DLAs with comprehensive sets of elemental abundances (22 elements detected) that we can derive their star formation histories (SFHs) and ages from a detailed comparison of their abundance patterns with chemical evolution models. Previous studies also investigated the nature of DLA galaxies by means of chemical evolution models (Jimenez, Bowen & Matteucci 1999; Hou et al. 2001; Cora et al. 2003; Calura et al. 2003). Our approach differs in the fact that we treat the DLAs studied as individual systems, and not as an ensemble following a common evolutionary sequence.
We propose to constrain the nature of six new high redshift DLA galaxies via their chemical abundance analysis following the prescriptions defined in Paper I in order to derive a global picture of high-redshift galaxies. Together with the three DLAs previously studied, these nine DLA systems at were selected only on the basis of: (i) a bright background quasar, (ii) the existence of HIRES/Keck spectra, and (iii) minimal Ly forest contamination which maximizes access to chemical elements. The latter criterion was achieved by demanding while requiring that the velocity separation km s-1 such that the two are not physically associated. They form a sample which covers the full range of H i column densities, metallicities, and dust depletion levels as observed in DLAs. The DLAs studied in this paper thus are well representative of the average high-redshift DLA galaxy population.
The layout of the paper is as follows. In Sect. 2 we describe our DLA sample and the determination of their intrinsic abundances free from dust depletion and ionization effects. In Sect. 3 we present the chemical evolution models we will use to constrain the DLA star formation histories and ages. In Sect. 4 we derive for the six DLA galaxies in our sample the star formation histories and ages. Finally, in Sect. 5 we compare and try to connect the determined DLA properties, i.e. ages, star formation rates, and star formation histories, with the properties of emission-selected galaxies at the same redshifts. To conclude, Sect. 6 provides a summary of the main constraints obtained on the DLA galaxies. The adopted cosmology throughout the paper is km s-1 Mpc-1 (), , and .
2 Our DLA sample and their abundances
The sample of DLA galaxies that we will study in this paper is unique. Indeed, by combining our high quality UVES/VLT spectra with existing HIRES/Keck spectra, we obtained comprehensive sets of elemental abundances for eleven DLAs. We detected 54 metal-line transitions which allowed us to measure the column densities of 30 ions from 22 elements: B, C, N, O, Mg, Al, Si, P, S, Cl, Ar, Ti, Cr, Mn, Fe, Co, Ni, Cu, Zn, Ge, As, and Kr. This contrasts with the majority of DLAs for which only a handful of elements (Si, Fe, Cr, Zn, Ni) is usually detected (e.g. Lu et al. 1996; Prochaska & Wolfe 1999; Prochaska et al. 2001). In these other cases, one struggles to interpret the DLA abundance patterns, especially to distinguish between differential depletion and intrinsic nucleosynthetic patterns (e.g. Prochaska & Wolfe 2002).
| Quasar | Q B0841+129 | Q B0841+129 | PKS 1157+014 | Q B1210+175 | Q B2230+02 | Q B2348–1444 | |||||||
|---|---|---|---|---|---|---|---|---|---|---|---|---|---|
| 2.375 | 2.476 † | 1.944 | 1.892 | 1.864 | 2.279 | ||||||||
| (H i) | 20.99(0.08) | 20.78(0.08) | 21.60(0.10) | 20.63(0.08) | 20.83(0.05) | 20.59(0.08) | |||||||
| Ionic column densities and absolute abundances | |||||||||||||
| (B ii) | [B/H]obs | … | … | … | … | … | … | … | … | … | … | ||
| (N i) | [N/H]obs | 14.60(0.01) | (0.10) | 13.94(0.08) | (0.13) | 14.71(0.09) | (0.13) | 15.02(0.06) | (0.11) | 13.35(0.05) | (0.11) | ||
| (O i) | [O/H]obs | 16.15(0.10) | (0.14) | … | … | … | … | … | … | ||||
| (Mg ii) | [Mg/H]obs | 15.13(0.10) | (0.13) | 14.99(0.15) | (0.17) | 15.99(0.04) | (0.11) | ||||||
| [Mg/H]cor(E00) | (0.13) | … | (0.12) | ||||||||||
| [Mg/H]cor(E11) | (0.13) | … | (0.12) | ||||||||||
| (Al ii) | [Al/H]obs | … | … | ||||||||||
| (Si ii) | [Si/H]obs | 15.21(0.04) | (0.09) | 14.99(0.03) | (0.09) | 15.97(0.01) | (0.10) | 15.33(0.03) | (0.09) | 15.70(0.03) | (0.06) | 14.18(0.06) | (0.10) |
| [Si/H]cor(E00) | (0.09) | … | (0.10) | (0.09) | (0.07) | (0.10) | |||||||
| [Si/H]cor(E11) | (0.09) | … | (0.11) | (0.09) | (0.07) | (0.10) | |||||||
| (P ii) | [P/H]obs | 12.82(0.06) | (0.12) | 12.56(0.09) | (0.13) | 13.86(0.09) | (0.15) | 13.69(0.08) | (0.11) | … | … | ||
| (S ii) | [S/H]obs | 14.69(0.05) | (0.11) | 14.48(0.10) | (0.15) | … | … | 14.96(0.02) | (0.10) | 15.29(0.06) | (0.11) | 13.75(0.06) | (0.12) |
| (Cl i) | [Cl/H]obs | … | … | … | … | … | … | … | … | … | … | ||
| (Ar i) | [Ar/H]obs | 13.53(0.08) | (0.13) | 13.11(0.08) | (0.13) | … | … | … | … | … | … | … | … |
| (Ti ii) | [Ti/H]obs | … | … | … | … | 12.82(0.13) | (0.16) | 12.34(0.08) | (0.13) | 12.68(0.09) | (0.10) | … | … |
| (Cr ii) | [Cr/H]obs | 13.07(0.02) | (0.08) | 12.89(0.06) | (0.11) | 13.76(0.02) | (0.10) | 13.28(0.03) | (0.09) | 13.44(0.04) | (0.08) | 12.30(0.09) | (0.12) |
| (Mn ii) | [Mn/H]obs | 12.50(0.02) | (0.08) | 12.33(0.15) | (0.17) | 13.25(0.02) | (0.10) | 12.72(0.01) | (0.09) | 13.03(0.03) | (0.06) | 11.66(0.15) | (0.17) |
| (Fe ii) | [Fe/H]obs | 14.76(0.01) | (0.08) | 14.50(0.03) | (0.09) | 15.46(0.02) | (0.10) | 15.01(0.03) | (0.09) | 15.24(0.03) | (0.06) | 13.84(0.05) | (0.09) |
| [Fe/H]cor(E00) | (0.10) | … | (0.18) | (0.16) | (0.14) | (0.19) | |||||||
| [Fe/H]cor(E11) | (0.10) | … | (0.18) | (0.16) | (0.14) | (0.19) | |||||||
| (Co ii) | [Co/H]obs | … | … | … | … | 13.10(0.13) | (0.16) | … | … | … | … | … | … |
| (Ni ii) | [Ni/H]obs | 13.53(0.05) | (0.09) | 13.19(0.09) | (0.13) | 14.21(0.02) | (0.10) | 13.67(0.06) | (0.11) | 14.09(0.04) | (0.08) | ||
| [Ni/H]cor(E00) | (0.11) | … | (0.18) | (0.19) | (0.13) | ||||||||
| [Ni/H]cor(E11) | (0.11) | … | (0.18) | (0.18) | (0.16) | ||||||||
| (Cu ii) | [Cu/H]obs | … | … | … | … | … | … | … | … | … | … | ||
| (Zn ii) | [Zn/H]obs | 12.10(0.02) | (0.09) | 11.69(0.10) | (0.14) | 12.99(0.05) | (0.12) | 12.40(0.05) | (0.10) | 12.72(0.05) | (0.09) | ||
| (Ge ii) | [Ge/H]obs | … | … | … | … | 11.99(0.14) | (0.18) | … | … | … | … | … | … |
| (As ii) | [As/H]obs | … | … | … | … | … | … | … | … | ||||
| (Kr i) | [Kr/H]obs | … | … | … | … | … | … | … | … | ||||
| (C ii∗) | – | 12.96(0.08) | – | – | 15.13(0.09) | – | … | – | 13.95(0.02) | – | – | ||
| Relative abundances | |||||||||||||
| [Zn/Fe]obs | (0.02) | (0.11) | (0.07) | (0.07) | (0.07) | ||||||||
| [Ni/Fe]obs | (0.05) | (0.09) | (0.03) | (0.07) | (0.05) | ||||||||
| [Ni/Fe]cor (E00) | (0.04) | … | (0.02) | (0.06) | (0.04) | ||||||||
| [Ni/Fe]cor (E11) | (0.05) | … | (0.03) | (0.07) | (0.05) | ||||||||
| [Si/Fe]obs | (0.04) | (0.04) | (0.02) | (0.03) | (0.04) | (0.08) | |||||||
| [Si/Fe]cor (E00) | (0.06) | … | (0.09) | (0.10) | (0.11) | (0.18) | |||||||
| [Si/Fe]cor (E11) | (0.06) | … | (0.09) | (0.10) | (0.11) | (0.18) | |||||||
| [Mg/Fe]obs | (0.10) | (0.15) | (0.05) | ||||||||||
| [Mg/Fe]cor (E00) | (0.12) | … | (0.12) | ||||||||||
| [Mg/Fe]cor (E11) | (0.12) | … | (0.12) | ||||||||||
| [S/Fe]obs | (0.08) | (0.12) | … | (0.07) | (0.09) | (0.10) | |||||||
| [S/Fe]cor (E00) | (0.13) | … | … | (0.10) | (0.18) | (0.18) | |||||||
| [S/Fe]cor (E11) | (0.13) | … | … | (0.10) | (0.18) | (0.18) | |||||||
| [S/Zn]obs | (0.07) | (0.15) | … | (0.08) | (0.10) | ||||||||
| [N/Si]obs | (0.07) | (0.10) | (0.11) | (0.09) | (0.10) | ||||||||
| [N/Si]cor (E00) | (0.07) | … | (0.16) | (0.13) | (0.10) | ||||||||
| [N/Si]cor (E11) | (0.07) | … | (0.16) | (0.13) | (0.10) | ||||||||
| [N/S]obs | (0.07) | (0.14) | … | (0.11) | (0.10) | (0.10) | |||||||
Notes. – The DLA at toward Q B04501310 is affected by high ionization
effects (see Sect. 2.2), and therefore we do not consider it in this paper.
Notes. – The values in parenthesis correspond to the 1 errors.
Notes. – We provide dust corrections only for the absolute and relative abundances
that we will further use in our study. The dust corrections are computed using the Vladilo (2002a)
prescriptions. The models E00 and E11
Notes. assume that the intrinsic [Zn/Fe] ratio is equal to dex.
† The DLA at toward Q B0841+129 does not require any dust correction,
because the [Zn/Fe] ratio is almost solar. We obtained for this DLA the rare O abundance measurement
which leads to the following relative abundances: [O/Fe] , [O/Zn] ,
and [N/O] .
The abundance analysis of our sample of DLAs is presented in Paper I for four DLAs toward Q B0100+13, Q B1331+17, Q B2231002, and Q B2343+125, and in Dessauges-Zavadsky et al. (2006, hereafter Paper II) for seven DLAs toward Q B04501310, Q B0841+129, PKS 1157+014, Q B1210+175, Q B2230+02, and Q B23481444111The naming of quasars have slightly been modified relative to Papers I and II in order to be in accordance with the IAU rules.. A complete interpretation of the abundances with the determination of the star formation histories can also be found in Paper I for the first set of DLAs222The DLA toward Q B2343+125 was excluded from the star formation history study, because of its large ionization fraction.. In this paper we will focus on the second set of DLAs. In Table 1 we summarize their ionic column densities and absolute abundances. The most important relative abundances are also reported. They have been computed by considering only the column densities of Voigt profile components detected in both elements of the abundance ratio.
The interpretation of the observed elemental abundance patterns in DLAs is not straightforward. The principal difficulty is to disentangle the nucleosynthesis contributions from dust depletion and ionization effects. Indeed, since we are measuring gas-phase elemental abundances, in presence of dust the observed abundances may not represent the intrinsic chemical composition of the galaxy if part of the elements is removed from the gas to the solid phase, as it happens in the interstellar medium (ISM) of our Galaxy (Savage & Sembach 1996). Similarly, a fraction of the gas may be ionized by external or internal ionizing sources. Therefore, a comprehensive set of ionic column densities and elemental abundances is of great advantage in order to evaluate the dust depletion and ionization effects, and hence derive the intrinsic abundances.
2.1 Dust depletion corrections
Several pieces of evidence show that some dust is present in DLAs (Pettini et al. 1994; Hou et al. 2001; Prochaska & Wolfe 2002). Three main approaches help to circumvent the problem of dust depletion in the studies of DLA abundance patterns. The first one, although very limiting, consists in considering only the DLAs with low dust depletion levels. [Zn/Fe], the ratio of two iron-peak elements with very different degrees of incorporation into dust grains, is often used as a dust depletion indicator, with Zn being a volatile element and Fe a refractory element. Hence, DLAs with [Zn/Fe] are considered as systems with negligible dust depletion levels (Pettini et al. 2000a). This is the case in our sample for the DLA at toward Q B0841+129 with [Zn/Fe] . In three other DLAs toward Q B0841+129, Q B1210+175, and Q B23481444, the dust depletion levels are also relatively low: [Zn/Fe] . The second approach consists of quantifying the dust depletion effects and applying dust corrections to the observed abundances. Several authors have considered different methods to compute the dust depletion corrections (e.g. Vladilo 1998; Savaglio et al. 2000; Vladilo 2002a, b; Prochaska & Wolfe 2002). Finally, the third approach consists of focusing on non-refractory and/or mildly refractory elements, such as N, O, S, Ar, and Zn. In this way one assesses the intrinsic abundances in DLAs.
In our study we considered all the three approaches: the first for the DLA at toward Q B0841+129, and the second and the third for the other DLAs. We performed the dust depletion corrections using the method developed by Vladilo (2002a, b), as in Paper I. This method groups together several dust correction models based on different assumptions. We consider here the models E00 and E11 computed by assuming that the intrinsic [Zn/Fe] ratio is equal to +0.10 dex (see Vladilo’s papers for more details). In Table 1 we report the dust-corrected values, in addition to the observed ones, for the absolute and relative abundances which we will further use in the paper.
2.2 Ionization corrections
Several authors investigated photoionization in DLAs (e.g. Viegas 1995; Howk & Sembach 1999; Izotov et al. 2001; Vladilo et al. 2001) and generally concluded that the ionization corrections to observed abundances should be small. We used the photoionization diagnostics of Prochaska et al. (2002) to check the ionization state of the DLAs in our sample. These diagnostics provide a qualitative analysis of the ionization level in a DLA. They consist of prescriptions based on the column density ratios of adjacent ions of the same element, such as (Fe++)/(Fe+), and on Ar. Ar is very sensitive to ionization, because its photoionization cross-section is one order of magnitude larger than for H i at energies Ryd (Sofia & Jenkins 1998).
These photoionization diagnostics were discussed in Papers I and II for the DLAs in our sample. They show that the ionization fraction is lower than 10 % for nine out of eleven DLAs and that the ionization corrections are negligible for these nine DLAs. The two DLAs with the high ionization fractions, the DLA toward Q B2343+125 and the DLA toward Q B04501310, are not considered in the star formation study and therefore the DLA toward Q B04501310 is not included in Table 1. They will be discussed in a future paper (Deassuages-Zavadsky et al. in prep).


3 Chemical evolution models
Theoretically, we can determine the star formation history and the age of a galaxy from its abundance patterns (Matteucci 2001). Indeed, in chemical evolution models the absolute abundances depend on the model assumptions, whereas the relative abundances depend on the nucleosynthesis, the stellar lifetimes, and the initial mass function. Relative abundances can thus be used as cosmic clocks if they involve two elements formed on different timescales. Typical examples are the [/Fe] and [N/] ratios, since the -elements (O, Si, S, Mg) are produced on short timescales by Type II supernovae (SNe) and the Fe-peak elements and nitrogen are produced on long timescales by Type Ia SNe and intermediate-mass stars, respectively.
In this work, we will make use of different chemical evolution models spanning different star formation histories and star formation efficiencies. These models are the same as the models used by Calura et al. (2003) and in Paper I. No instantaneous recycling approximation is adopted, the stellar lifetimes are properly taken into account. We describe the models in the next two sections.
3.1 Spiral models
The model for a typical spiral galaxy is calibrated on the chemical features of the Milky Way. The galaxy is assumed to form as a result of two main infall episodes (Chiappini et al. 1997). During the first episode the halo forms and the gas shed by the halo rapidly gathers in the center leading to the formation of the bulge. During the second episode, a slower infall of external gas gives rise to the disk with the gas accumulating faster in the inner than in the outer region, leading to timescales ranging from Gyr in the inner disk to Gyr in the solar region, and up to 13 Gyr in the outer disk (“inside-out” scenario, Matteucci & François 1989). The efficiency of the star formation is characterized by the efficiency parameter, , defined as the inverse of the typical timescale for star formation. It is set to Gyr-1 and becomes zero when the gas surface density drops below a certain critical threshold. A threshold density of M⊙ pc-2 is adopted in the disk (Chiappini et al. 1997). The resulting star formation rate then is proportional to and the gas surface density which depends on the galactocentric radius and time. The initial mass function (IMF) is taken from Scalo (1986). The galactic wind is assumed to be inefficient (Matteucci 2001).
Hence, due to the “inside-out” scenario and the threshold density adopted in the spiral model, the star formation history is different at different galactocentric radii (see Fig. 1, left panel). Indeed, in the inner regions of the disk where the rate of accretion of matter onto the disk is fast, a high gas surface density well above the critical threshold is reached and maintained during a long period, and hence the star formation is almost continuous through the galaxy lifetime. On the other hand, in the outer regions of the disk (radius kpc) where the rate of accretion of matter onto the disk is slow, the SFH proceeds in a gasping way, due to the fact that in these regions the gas density is always close to the critical threshold. We will label “spiral inner disk” the models at kpc, “spiral solar neighborhood” the model at kpc, and “spiral outer disk” the models at kpc. These different star formation histories at different galactocentric radii are associated with different abundance patterns which can be compared with observations. The radius corresponds to the position at which the QSO line of sight crosses the DLA galaxy disk.
3.2 Dwarf irregular models
Dwarf irregular galaxies are assumed to form owing to a continuous infall of pristine gas until a mass of M⊙ is accumulated (Bradamante et al. 1998). The evolution of these galaxies is characterized by a bursting star formation history. The parameters which need to be constrained are the number of bursts of star formation and for each burst the efficiency, , (same definition as above) and the burst duration, . The star formation rate is in this case directly proportional to and the gas density at a given time. The star formation in the dwarf irregular models can proceed either in short bursts of a duration from 10 to 200 Myr separated by long quiescent periods or at a low regime but continuously, namely in one or two long episodes of inefficient star formation lasting between 3 and 13 Gyr (see Fig. 1, right panel). They will be referred as the “dwarf irregular bursting” models and the “dwarf irregular continuous” models, respectively. The dwarf irregular galaxies are particularly sensitive to outflows resulting from the energy injection from the supernova explosions (Recchi et al. 2001).
The IMF is taken from Salpeter (1955). The reason for such a choice relies mainly on the chemical abundances and on the metal content observed in irregulars (for a detailed explanation, see Calura & Matteucci 2006). Indeed, a Salpeter IMF can account for the abundances observed in local dwarf galaxies (Recchi et al. 2002), whereas it leads to an overestimation of the abundances in spiral disks (see Romano et al. 2005) which are well accounted for by means of the Scalo (1986) IMF. On the other hand, when assuming a Scalo IMF in dwarfs, we underestimate their present-day average metallicity (Calura & Matteucci 2004).
In summary, three different types of star formation histories are modeled by the grid of chemical evolution models which we use in our study of DLAs (see Fig. 1 for illustration):
-
•
the single burst SFH:
by the dwarf irregular bursting models: dwarf irregular models with a single burst of star formation characterized by different efficiencies from 0.1 to 5 Gyr-1 and different burst durations from 10 to 200 Myr; -
•
the episodic bursting SFH:
by the spiral outer disk models: spiral models at kpc characterized by a bursting star formation separated by short quiescent periods; -
•
the continuous SFH:
by the spiral inner disk models: spiral models at kpc characterized by a continuous star formation over 13 Gyr;
by the spiral solar neighborhood models: spiral models at kpc characterized by a continuous star formation but having a weaker star formation efficiency than the spiral inner disk models;
and by the dwarf irregular continuous models: dwarf irregular models with a continuous star formation over Gyr and characterized by low efficiencies from 0.01 to 0.1 Gyr-1, leading to star formation efficiencies about 10 times weaker than in the spiral inner disk and solar neighborhood models.
| QSO | Possible model | Star formation characteristics | Age | SFR per unit area | ||
|---|---|---|---|---|---|---|
| [Gyr-1] / [Gyr] | [Gyr] | [M⊙ yr-1 kpc-2] | ||||
| Q B0841+129 | 2.375 | spiral | outer disk | |||
| dwarf irregular | bursting: 0.3 / 0.2 | |||||
| dwarf irregular | continuous: 0.05 | |||||
| Q B0841+129 | 2.476 | dwarf irregular | bursting: 2.0 / 0.02 | |||
| PKS 1157+014 | 1.944 | spiral | outer disk | |||
| dwarf irregular | bursting: 0.7 / 0.1 | |||||
| dwarf irregular | continuous: 0.05 | |||||
| Q B1210+175 | 1.892 | spiral | inner disk | |||
| dwarf irregular | bursting: 1.2 / 0.2 | |||||
| dwarf irregular | continuous: 0.06 | |||||
| Q B2230+02 | 1.864 | dwarf irregular | continuous: 0.1 | |||
| Q B23481444 | 2.279 | dwarf irregular | bursting: 0.1 / 0.15 | |||
| dwarf irregular | continuous: 0.1 |
Note. The model in boldface corresponds to the favored model. We assume that the favored model is the model which reproduces
all the data points within 1 error (minimum ).
3.3 Stellar yields
For all the chemical elements studied, the stellar yields considered in this work are the same as the ones used in Paper I, except for nitrogen. These include the yields of Nomoto et al. (1997a) for massive stars ( M⊙), the yields of van den Hoeck & Groenwegen (1997) for low- and intermediate-mass stars (), and the yields of Nomoto et al. (1997b) for Type Ia SNe (model W7). For Zn we consider the specific prescriptions calculated by Calura et al. (2003) and for Ni we adopt the prescriptions presented in Paper I.
Our motivation to consider other yields for N comes from the lack of reproducing the [N/] ratios of the DLAs studied in Paper I (see Figs. 15 and 17) and from the work by Chiappini et al. (2003). This work shows that by computing the same chemical evolution models as those used in this paper with the new N yields of Meynet & Maeder (2002) which take into account the stellar rotation, the overestimation of the DLA [N/] ratios is solved. The yields with rotation are similar to the ones of van den Hoeck & Groenwegen (1997) for the low-mass stars, but they are substantially smaller for the intermediate-mass stars. We hence adopt the same tables of N yields as the ones of Chiappini et al. (2003) extrapolated from the stellar model grids of Meynet & Maeder (2002). Meynet & Maeder did not provide the yields for other elements yet. The use of a different set of yields for N and other elements should, however, not be a problem, because the stellar mass range for the production of the other elements considered in this work is different. Indeed, O, Si, S, and Mg are mainly produced by massive stars, while N is mainly produced by intermediate-mass stars.
Recently, François et al. (2004) published a new set of yields for several elements studied in this work, in particular Zn, Ni, O, and Mg. These yields were derived from a careful comparison between the Milky Way chemical evolution model predictions and the very accurate UVES measurements of abundance ratios observed in Galactic stars with metallicities . For the elements Ni and Zn, our adopted yields prescriptions (see Paper I and Calura et al. 2003, respectively) are fully consistent with the yields of François et al. (2004) over the DLA metallicity range (). For O, the new yields of François et al. (2004) predict lower [O/Fe] ratios than our adopted yields of Nomoto et al. (1997a) at a given metallicity. This leads to a better agreement with the [O/Fe] measurements in DLAs as discussed in Sect. 4.2. The largest discrepancy between our adopted yields and the ones of François et al. (2004) concerns Mg. Nomoto et al. (1997a) yields of Mg are known to underestimate the observed [Mg/Fe] ratios in Galactic stars, as also shown by Chiappini et al. (1999). We tested the François et al. Mg yields, and they usually better reproduce the [Mg/Fe] ratios measured in DLAs with the spiral models, but tend to overestimate the [Mg/Fe] ratios with the dwarf irregular models.
4 DLA star formation histories
In Paper I we have demonstrated that the star formation history and the age of a DLA galaxy can be constrained from a detailed comparison of the DLA abundance patterns with chemical evolution models. The relative abundances when examined as a function of a metallicity tracer (e.g. [Fe/H], [Zn/H], or [/H]) allow one to determine the star formation history, and when examined as a function of redshift, they determine the age of the DLA galaxy defined as the time at which the galaxy started to form stars. The star formation rate is also a direct output of the model comparison. In the case of the spiral model, the derived SFR is the SFR per unit area and it corresponds to the SFR that the galaxy has when it is observed. In the case of the dwarf irregular model, to get the SFR per unit area from the SFR output, we assume a spherical symmetry and a galactic radius of 3.5 kpc equivalent to the mean size of the Magellanic Clouds (Russell & Dopita 1992)333The radius of dwarf galaxies at high redshift is an unknown quantity. In the paper, we assume a radius of 3.5 kpc. In the case that the radius is half this value, it would produce star fomation rates larger by a factor of 4. This difference would, however, have no impact on the results described in Sect. 5.. It corresponds to the average SFR integrated over the time of the burst of star formation, i.e. over the period when the star formation is active.
The relative abundances that best constrain the chemical evolution model are [O/Fe], [Si/Fe], [S/Fe], [S/Zn], [Mg/Fe], [Ni/Fe], [N/O], [N/Si], and [N/S], most of them accessible for each DLA in our sample (see Table 1). For each DLA individually, we look for the model that best reproduces all these abundance ratios as a function of metallicity using the same statistical test as in Paper I and defined as follows. We first determine the minimal distance between the data point and the curve corresponding to a given chemical model for each abundance ratio. For this purpose, we consider the 1 error on the data point (i.e. the covariance matrix of the 1 measurement error), and we derive the minimal distance by computing the distances from the data point to the points defining the considered model curve and by determining the for which the / ratio is minimal. Second, once the minimal distances for all the abundance ratios available and for a given model are derived, we compute their weighted mean. Finally, the comparison of the weighted means obtained for different chemical models determines the best chemical evolution model which reproduces the data points and thus the DLA galaxy. The limits are not taken into account. We then derive the age of the DLA galaxy by determining with the same statistical test at which redshift, the so-called redshift of formation, the deduced best model reproduces all the abundance ratios as a function of redshift.
We now describe the deduced star formation histories and ages of the six DLA galaxies from our new set of data. In Table 2 we summarize the results. We provide the best models reproducing the DLA abundance patterns and the corresponding derived redshifts of formation , ages, and star formation rates per unit area.
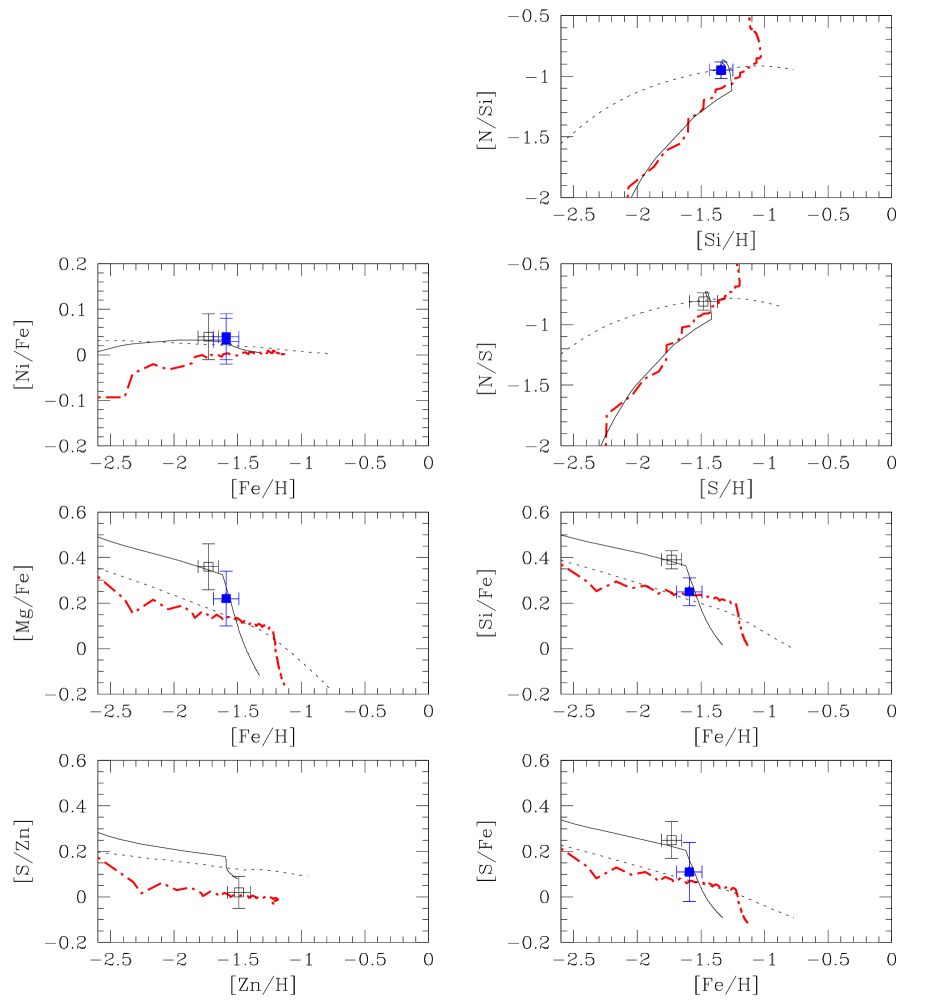
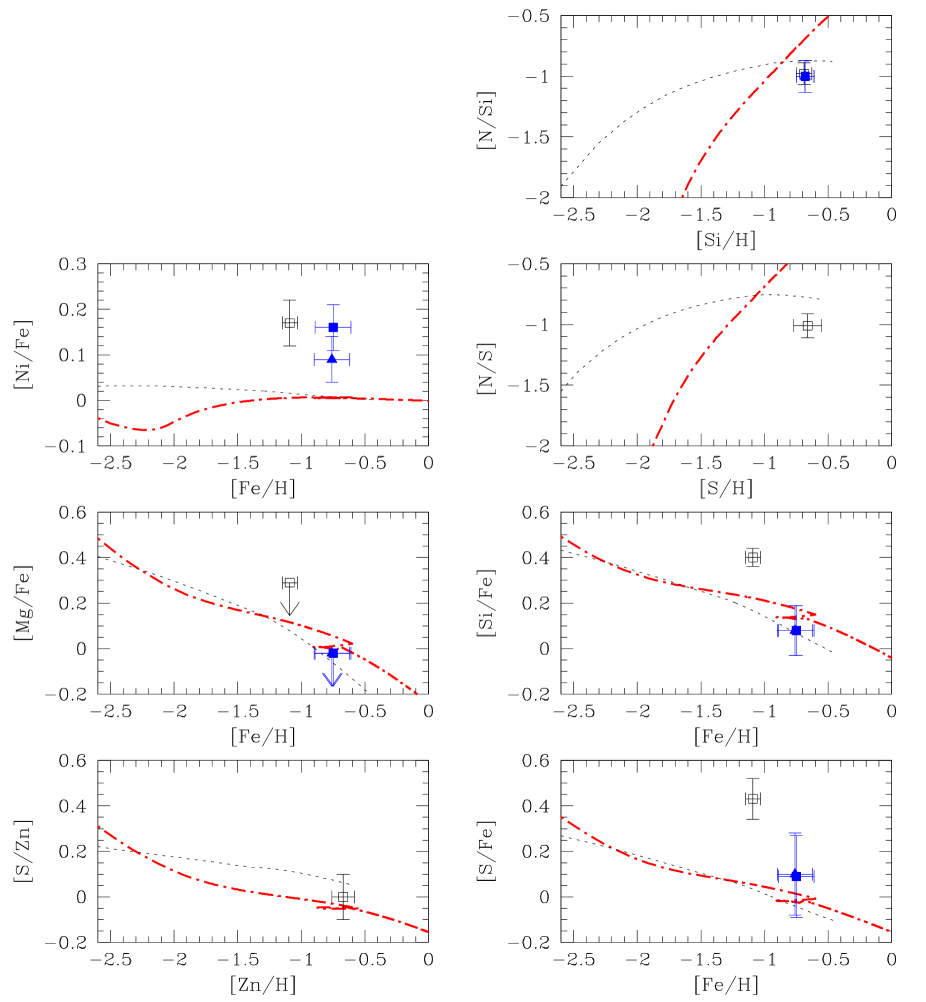
4.1 Q B0841+129, zDLA=2.375
The abundance ratios of interest (see above) available in this DLA system are [Si/Fe], [S/Fe], [S/Zn], [Mg/Fe], [Ni/Fe], [N/Si], and [N/S]. For the refractory elements we consider the dust-corrected values given in Table 1, although in this DLA the dust corrections are small, since [Zn/Fe] .
The spiral model which best reproduces the observed abundance patterns is the spiral outer disk model (see the thick dashed-dotted curve in Fig. 2). This model fits all the data points within 1 error, except the [N/Si] ratio which is at 1.5 . We also investigated whether a dwarf irregular model can reproduce the abundance patterns. We explored both the dwarf irregular models with a continuous star formation regime over the Hubble time characterized by the efficiencies , 0.03, and 0.05 Gyr-1, and a bursting star formation regime with a burst duration Gyr and characterized by the efficiencies , 0.3, and 0.5 Gyr-1. The bursting model with Gyr-1 reproduces all the data points within 1 error (thin solid curve in Fig. 2), while the continuous model with Gyr-1 also fits well the DLA abundance patterns, except the [S/Zn] ratio which is at 1.4 (thin dotted curve in Fig. 2).
We thus have a degeneracy between these three models which all well reproduce the abundance patterns observed in this DLA galaxy. However, in terms of derived ages and star formation rates, this degeneracy mainly concerns the bursting versus continuous star formation regimes. The values given in Table 2, indeed, show that the spiral outer disk model and the dwarf irregular bursting model, characterized by an episodic bursting and a single burst star formation history, respectively (see Sect. 3), lead to very similar results (age and SFR), while those of the dwarf irregular continuous model are different. The only way to break this degeneracy is to impose that all the abundance patterns have to be within 1 of the model curve (i.e. have the minimum ). The resulting favored model then is the dwarf irregular bursting model characterized by Gyr-1 and Gyr. However, this selection is very arbitrary.
From the analysis of the abundance ratios as a function of redshift, we obtain a redshift of formation, , of the DLA galaxy between 2.6 and 3 for the favored model. This corresponds to an age of Gyr, the DLA being observed at . The star formation rate per unit area is M⊙ yr-1 kpc-2.
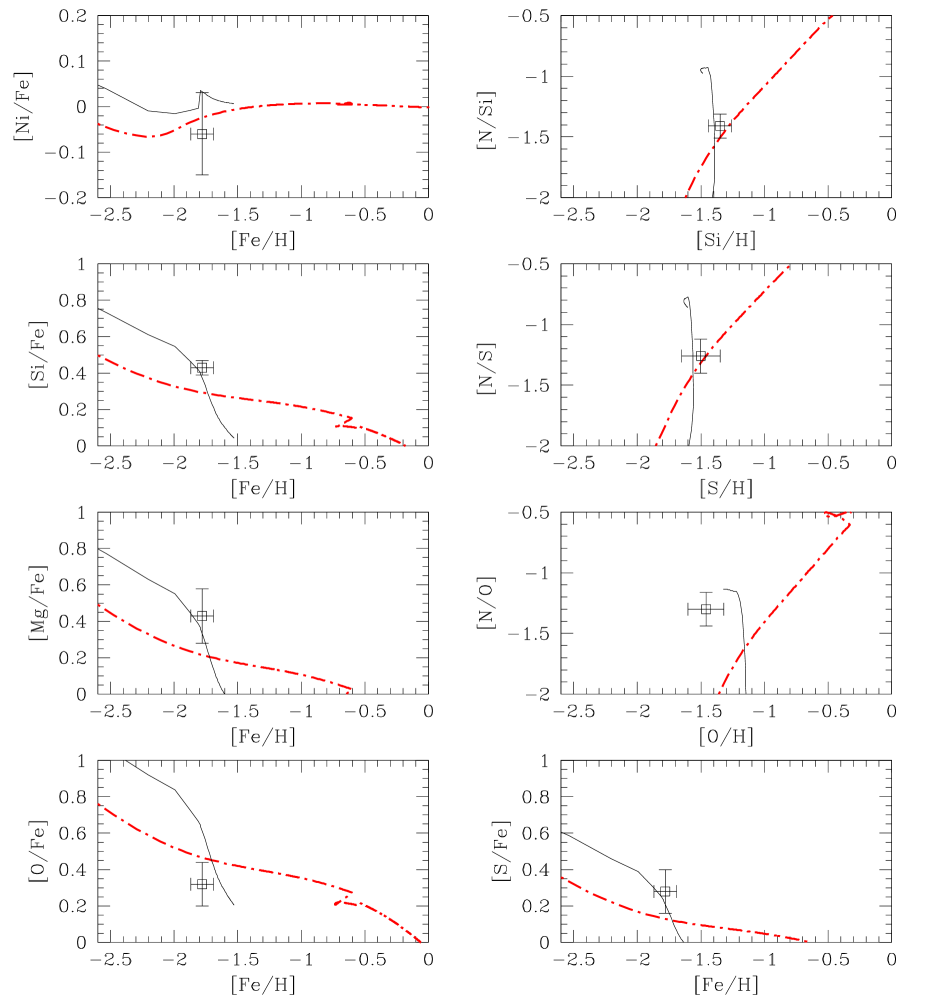
4.2 Q B0841+129, zDLA=2.476
We have at disposal the following abundance ratios in this DLA system: [Si/Fe], [S/Fe], [Mg/Fe], [Ni/Fe], [N/Si], [N/S], and the rare [O/Fe] and [N/O]. With [Zn/Fe] , the system is likely free from dust and thus unaffected by dust depletion effects. No dust corrections have been computed.
None of the spiral models succeeds in reproducing the [/Fe] ratios in this DLA galaxy. Indeed, the [O/Fe] ratio is located at 1.2 , [Si/Fe] at 2.4 , [S/Fe] at 1.3 , and [Mg/Fe] at 1.4 from the best spiral model curve (see the thick dashed-dotted curve in Fig. 3). Moreover, the [N/O] ratio is also not fitted (3.1 ). Similarly, none of dwarf irregular continuous models fits the observed abundance patterns. We investigated dwarf irregular bursting models with efficiencies between 1.5 to 4 Gyr-1 by step of 0.5 Gyr-1 and burst durations between 0.01 and 0.05 Gyr. The model with Gyr-1 and a very short burst duration Gyr best reproduces the observed abundance patterns. Indeed, the model fits all the data points within 1 error, except the [O/Fe] and [N/O] ratios (thin solid curve in Fig. 3).
O is the most reliable diagnostic in the SFH studies, thus the fact that the [O/Fe] and [N/O] ratios are not well reproduced by the model may suggest either that the O abundance measurement is underestimated due to a possible O i line saturation (see Paper II) or that the adopted O yields are not reliable enough. When considering the new yields of François et al. (2004) which predict a lower O abundance at a given metallicity, the problem of O is solved for both the dwarf irregular bursting model and the best spiral model.
The degeneracy between the three star formation histories investigated is in this case alleviated. Only the dwarf irregular bursting model allows to reproduce the abundance patterns of this DLA characterized by a high -enhancement. We would like to point out that the adopted Salpeter IMF in the dwarf irregular models largely contributes to the successful fit of these DLA data points. Indeed, a more top-heavy IMF relative to the Scalo IMF is needed to reproduce the high /Fe ratios. This is why the spiral models are ruled out.
From the abundance ratios versus redshift diagrams, we find a redshift of formation for this DLA galaxy, while we observe this DLA at . This corresponds to a very young age of Gyr only due to the very short burst duration, and suggests that the DLA galaxy is likely experiencing its first burst of star formation. The measured star formation rate per unit area is M⊙ yr-1 kpc-2. Examples of galaxies with such a short burst duration exist among the local metal-poor galaxies. In particular, Kunth et al. (1995) studied the chemical properties of IZw18 by means of a starburst model similar to ours, characterized by a burst duration of 0.01 Gyr and an average SFR of M⊙ yr-1 kpc-2. Transient episodes of star formation with such a duration are also likely to be typical of some local blue irregular galaxies (Annibali et al. 2003).
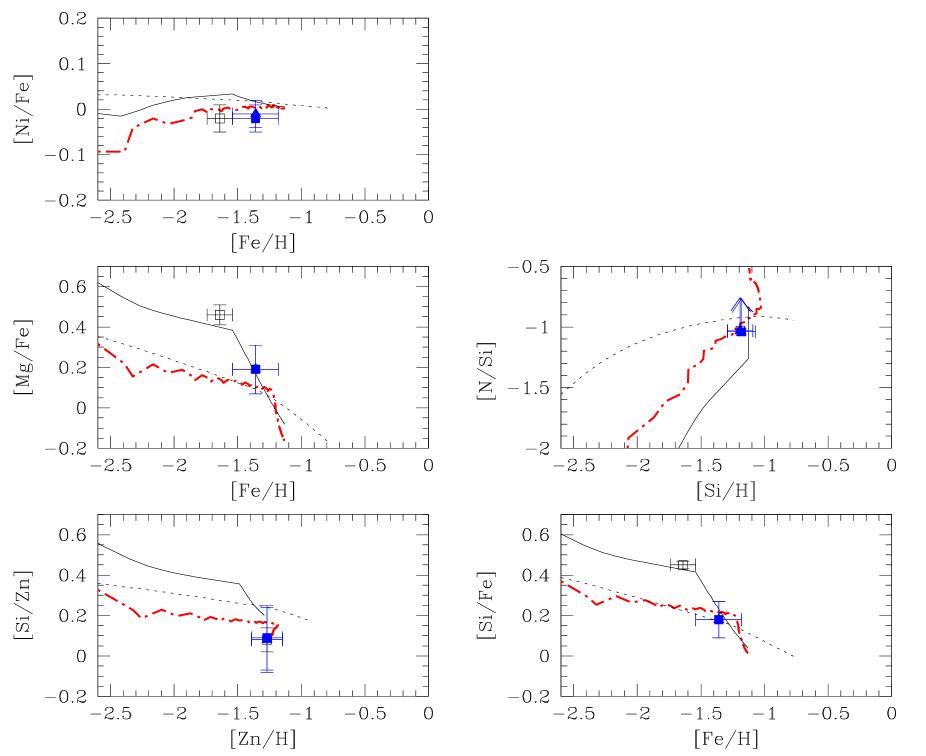
4.3 PKS 1157+014, zDLA=1.944
Few abundance ratios of interest are available in this DLA system: [Si/Fe], [Si/Zn], [Mg/Fe], [Ni/Fe], and a lower limit to [N/Si]. We consider the dust-corrected values given in Table 1, since they are relatively important in this system with [Zn/Fe] .
The best spiral model is the spiral outer disk model. It reproduces all the data points within 1 error and is in agreement with the lower limit to [N/Si] (see the thick dashed-dotted curve in Fig. 4). We considered also dwarf irregular models with both the continuous and bursting star formation regimes. For both of them we can constrain adequately the star formation parameters to reproduce successfully all the abundance patterns within 1 error: for the continuous model an efficiency Gyr-1 is needed (thin dotted curve in Fig. 4), and for the bursting model a burst with an efficiency Gyr-1 and a duration Gyr is needed (thin solid curve in Fig. 4). This leads again to an important degeneracy between these three models tracing three different star formation histories: an episodic bursting SFH, a continuous SFH, and a single burst SFH, respectively. If we compare the weighted means of the minimal distances between the model curves and the available data points, then the episodic bursting SFH (spiral outer disk model) with the minimum is the favorite one. However, there is no physical reason to exclude the two other star formation histories, since they all agree with the abundance patterns.
From the abundance ratios studied as a function of redshift, we derived the redshift of formation and the age of the DLA galaxy for the three best models. The obtained age proves to be very different from one model to the other. Indeed, for the spiral outer disk model we find which corresponds to an age of Gyr, for the dwarf irregular bursting model we have which gives an intermediate age of Gyr, and for the dwarf irregular continuous model we get which corresponds to a much older age of Gyr. The star formation rate per unit area is also very disparate from one model to the other: M⊙ yr-1 kpc-2 for the spiral model, between and M⊙ yr-1 kpc-2 for the dwarf irregular continuous model, and M⊙ yr-1 kpc-2 for the dwarf irregular bursting model.
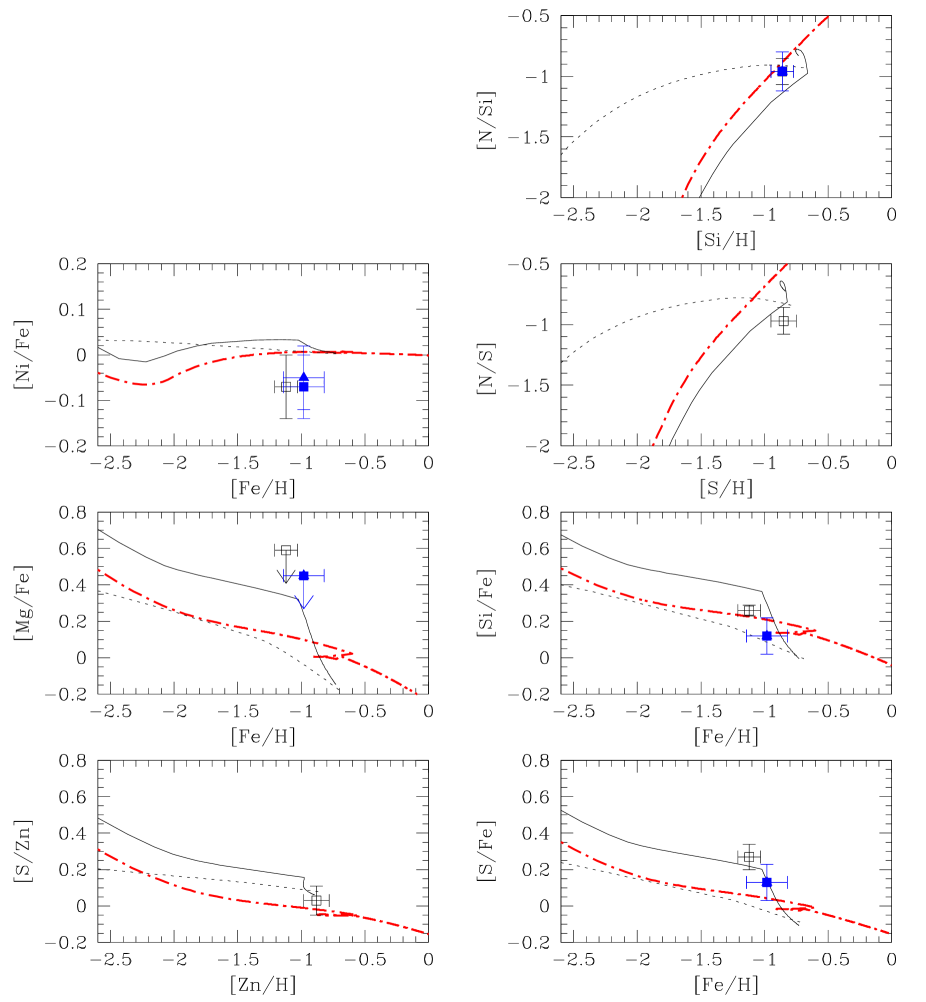
4.4 Q B1210+175, zDLA=1.892
We have at disposal the following abundance ratios in this DLA system: [Si/Fe], [S/Fe], [S/Zn], [Ni/Fe], [N/Si], [N/S], and an upper limit to [Mg/Fe]. We consider the dust-corrected values given in Table 1 for the abundance ratios including a refractory element, although the dust content in this system is relatively low, [Zn/Fe] .
The spiral model which best reproduces the abundance patterns is the spiral inner disk model. This model fits all the data points within 1 error, except the [N/S] ratio which is at 2.9 (see the thick dashed-dotted curve in Fig. 5). We investigated also the dwarf irregular models first to see whether the [N/S] ratio can better be reproduced and second because the probability that the QSO line of sight intercepts the internal parts of a spiral galaxy is low. None of the dwarf irregular models with a continuous star formation regime can reproduce the [N/S] ratio within 1 error. The best of these models is the model with an efficiency Gyr-1, but it fails to fit the [S/Fe] ratio at 1.4 in addition to the [N/S] ratio which is at 1.3 (thin dotted curve in Fig. 5). The favored model is the dwarf irregular bursting model with an efficiency Gyr-1 and a duration Gyr (thin solid curve in Fig. 5). Indeed, this model reproduces all the abundance patterns within 1 error and is in agreement with the upper limit to [Mg/Fe] as well as the lower limit to [Mg/Fe] obtained from the Mg ii 2796,2803 doublet which dust-corrected value is [Mg/Fe] (see Paper II).
The analysis of the abundance ratios as a function of redshift gives for the favored model a redshift of formation of this DLA galaxy. This corresponds to an age of Gyr. The star formation rate is M⊙ yr-1 kpc-2.
4.5 Q B2230+02, zDLA=1.864
This DLA galaxy has a very high metallicity, [Zn/H] , higher than 1/5 solar, and relatively important dust depletion corrections that may bring an uncertainty in the study of the star formation history of this object (see Table 1). The abundance ratios at disposal are [Si/Fe], [S/Fe], [S/Zn], [Ni/Fe], [N/Si], [N/S], and an upper limit to [Mg/Fe].
Only the spiral inner disk model manages to reproduce the observed high metallicity of this DLA galaxy. However, this model fails to fit the [N/Si] and [N/S] ratios which are at 2 and 4.5 from the model curve, respectively, and the [Mg/Fe] upper limit (see the thick dashed-dotted curve in Fig. 6). We further investigated continuous star formation histories, but with weaker star formation efficiencies considering parameters between 0.05 and 0.2 Gyr-1. We found that the dwarf irregular continuous model with Gyr-1 best reproduces the abundance patterns of this DLA galaxy (thin dotted curve in Fig. 6). It is in agreement with the upper limit to [Mg/Fe] and fits all the data points within 1 error, except the [N/S] ratio at 2.3 . The oversolar [Ni/Fe] measurement can hardly be explained by any chemical evolution model, since Ni should closely trace Fe.
We used the abundance ratios versus redshift to estimate the redshift of formation and the age of this DLA galaxy for the favored model identified. The redshift of formation found is very high, , implying a very old age, higher than 3.2 Gyr, for this galaxy. This suggests that galaxies were already formed at . The star formation rate per unit area of this DLA galaxy is of M⊙ yr-1 kpc-2.
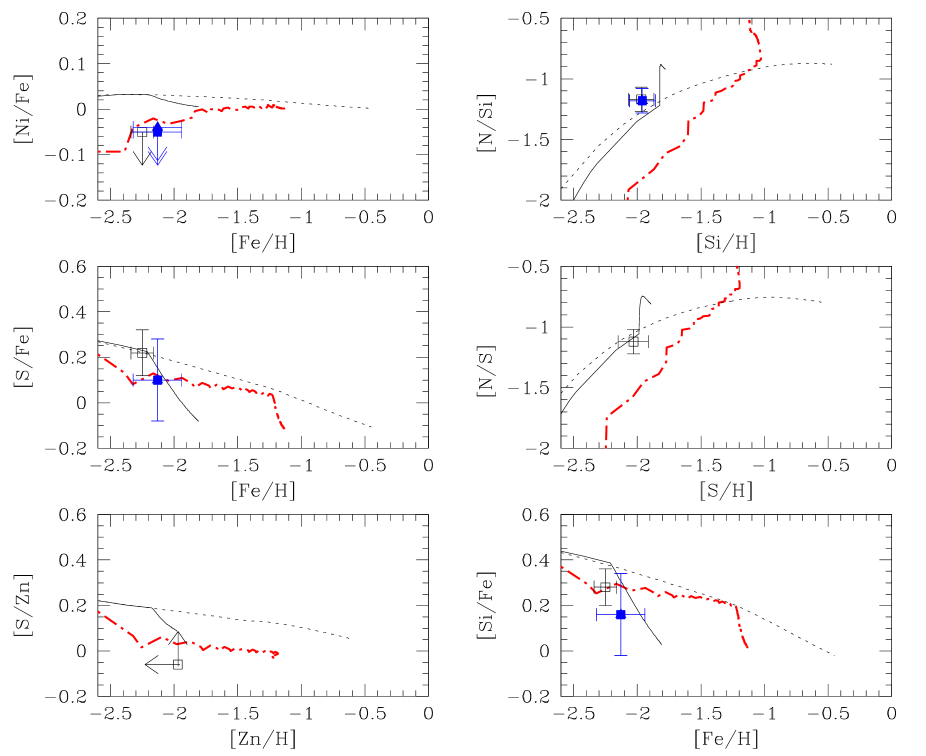
4.6 Q B2348–1444, zDLA=2.279
This DLA, on the contrary to the DLA toward Q B2230+02, has a low metallicity 1/180 solar ([Fe/H] ). The derived upper limit to the Zn abundance indicates weak effects due to dust depletion, since [Zn/Fe] . The abundance ratios at disposal for the study of the star formation history of this DLA galaxy are [Si/Fe], [S/Fe], [N/Si], [N/S], and the upper limits to [Ni/Fe] and [S/Zn].

The spiral model which best reproduces the abundance patterns is the spiral outer disk model. This model fits very well the [/Fe] ratios, but fails to reproduce the [N/Si] and [N/S] ratios which are at 4.0 and 2.3 , respectively (see the thick dashed-dotted curve in Fig. 7). We then considered dwarf irregular models with both the continuous and bursting star formation regimes to see whether they better reproduce the data points. The best dwarf irregular continuous model is characterized by an efficiency Gyr-1 (see the thin dotted curve in Fig. 7). It reproduces all the abundance patterns within 1 , except the [Si/Fe] ratio which is at 1.1 . Similarly, the dwarf irregular bursting model, characterized by an efficiency Gyr-1 and a burst duration Gyr, also reproduces all the data points within 1 , except the [N/Si] ratio which is at 1.4 (see the thin solid curve in Fig. 7). We thus have for this DLA galaxy a high degeneracy between these two dwarf irregular models tracing two different star formation histories.
From the abundance ratios studied as a function of redshift, we derived the redshift of formation and the age of the DLA galaxy for the two possible SFHs. For the dwarf irregular continuous model we find , while for the dwarf irregular bursting model we find . This corresponds to ages of relatively the same order, Gyr and Gyr, respectively. The star formation rates per unit area obtained for the two models are, on the contrary, relatively different, and M⊙ yr-1 kpc-2, respectively.
5 Comparison of DLA properties with other high-redshift galaxies
The eleven DLA systems at studied in Papers I and II were selected only on the basis of bright background quasars and the existence of HIRES/Keck spectra. They form a sample which covers the full range of H i column densities, metallicities, and dust depletion levels observed in other DLAs at similar redshifts, as illustrated in Fig. 8444The “control” sample is a compilation of abundance measurements from the literature of all DLAs at obtained from high-resolution spectra.. However, this sample appears to be slightly biased toward high H i column densities, since it contains three out of the five higher H i column density systems of our control sample, and toward less dusty DLA galaxies, as indirectly selected with the bright QSOs. Nevertheless, these effects are not determinant on our results, since they are not significant, the full range of DLA values is covered by the DLAs in our sample. The derived star formation histories of nine of these DLA galaxies555Two DLAs in our sample have high ionization fractions (see Sect. 2.2). We exclude them from our star formation history study, because the measure of their intrinsic abundances is very uncertain. thus are well representative of the average DLA galaxy population.
Our results show that the abundance patterns observed in DLAs are compatible with various star formation histories: episodic bursting, single burst, and continuous star formation histories with different star formation efficiencies. These are typical of inner and outer regions of Milky Way type spiral galaxies and of dwarf irregular galaxies with bursting and continuous star formation regimes. The degeneracy between these SFHs is unfortunately large for most DLAs. It is only broken for DLAs with specific abundance patterns, namely with high -enhancements, high metallicities, and/or low N/ ratios. This is the case of three DLAs among the nine in our sample. For the six DLAs with degenerated SFHs, we assume the favored SFH is the one for which the related model reproduces the abundance patterns with the minimum (see Paper I and Table 2). We can, however, note that the main results discussed in the following two sub-sections hold despite the degeneracy.
Let’s place the derived DLA properties in the global context of high-redshift galaxies and let’s compare them with the properties of emission-selected galaxies.
5.1 Age distribution
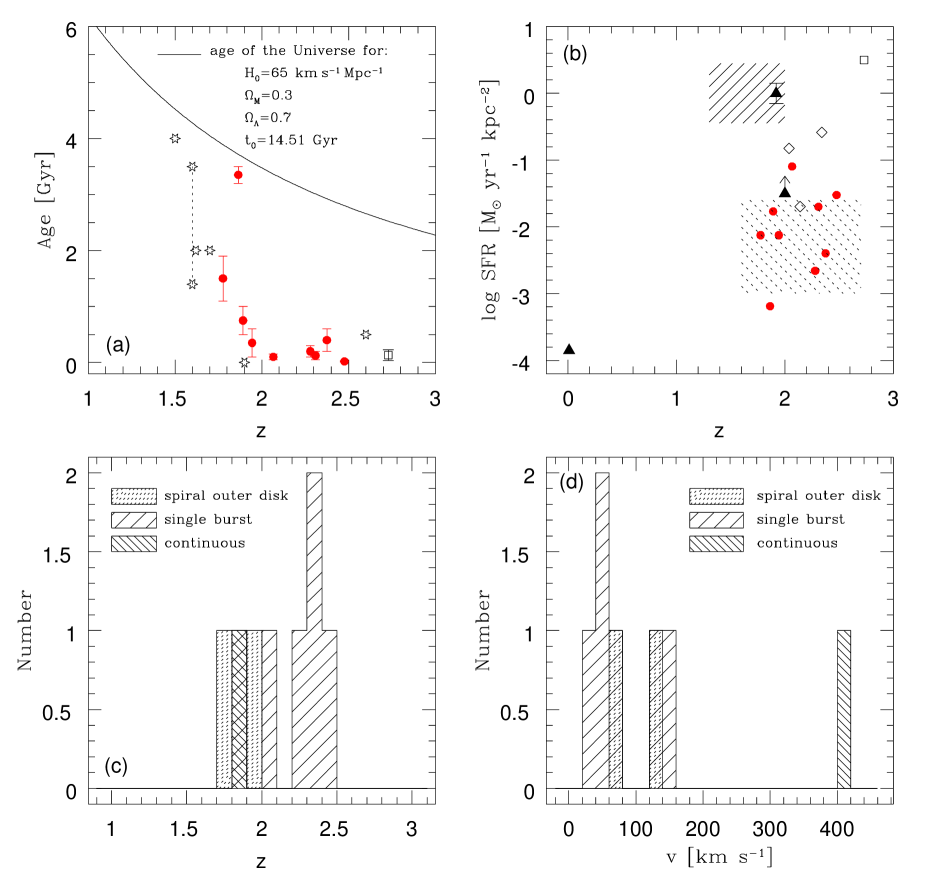
In Fig. 9 (a) we show the age distribution as a function of redshift for our nine DLA galaxies (circles), for six emission-selected galaxies (stars) which age was derived from the analysis of their integrated spectra (Bruzual 2002), and for the Lyman-break galaxy (LBG) MS 1512cB58 (square; Pettini et al. 2000b, 2002). MS 1512cB58 has age properties representative of the LBG population at , estimated to be typically between Myr (see Iwata et al. 2005).
The DLA galaxies show a large spread in age from a few tens of Myr up to a few Gyr. The oldest object is the DLA toward Q B2230+02 with an age larger than 3.2 Gyr. Interestingly, the age of this object, observed at , suggests that galaxies were already forming stars at . The same spread in age is also observed for the emission-selected galaxies at similar redshifts. We can note that the age distribution of high-redshift galaxies is in agreement with the age limit of the Universe defined by the adopted cosmological model at the epoch of observation, but it shows a trend of a steeper age decrease with redshift than the age decrease of the Universe. This could be due to a selection bias toward the brightest, strongest star forming and hence possibly the youngest emission-selected galaxies at high redshift that may not be representative of the galaxy population as a whole at . However, the DLA galaxies selected in absorption are independent of such a selection bias, and they also show a strong trend toward a very young age of a few hundred Myr for galaxies observed at , much lower than the age of the Universe at the epoch of observation. This suggests relatively low redshifts of formation () for most galaxies observed at high redshift.
We investigated different possible correlations between the age derived for the DLA galaxies in our sample and their H i column density and metallicity properties (see the left panels in Fig. 10). No trend is observed as a function of the neutral gas content, while we could have expected a decrease of the H i gas with the galaxy age increase due to the gas consumption during the star formation. On the other hand, a trend of metallicity evolution with the age of the DLA galaxies seems to be observed. However, due to the low number statistics, this correlation mainly relies on one single measurement made for the DLA toward Q B2230+02 with the highest age and metallicity. But, this measurement is very reliable, since this object is one of the rare DLA galaxies where star formation history and age were determined in a straightforward way; no degeneracy problem was encountered (see Sect. 4.5). Such a correlation between age and metallicity may simply be explained as the result of the metal gas enrichment of a galaxy with time. However, if we consider DLA galaxies with the same star formation history, for instance only DLAs characterized by a single burst star formation history (dwarf irregular bursting models), we can note that the metallicity is, indeed, on average dependent on the age of the galaxy, but it also depends on the star formation efficiency of the burst. This is illustrated in the right-bottom panel of Fig. 10 by the tentative correlation between the SFR and metallicity observed for DLAs with a single burst SFH.

5.2 Star formation rate distribution
The star formation rates per unit area derived for the nine DLA galaxies in our sample are between M⊙ yr-1 kpc-2. These values are in very good agreement with the SFRs obtained by Wolfe et al. (2003a), M⊙ yr-1 kpc-2, for six DLAs in the redshift interval . Wolfe et al. (2003a) yet used a very different technique to determine the DLA SFRs based on the measure of the cooling rate of these galaxies assessed by the strength of C ii∗ 1335 absorption. The heating rate is then obtained by equating it to the cooling rate, which hence constrains the DLA star formation rate, since massive stars forming out of neutral gas emit FUV radiation that heats the gas. This shows that the DLA galaxies seem really to have moderate to low star formation rates, on average similar to the SFR per unit area of the Milky Way Galaxy estimated to M⊙ yr-1 kpc-2 (Kennicutt 1998). The recent work by Wild et al. (2007) on Mg ii-selected DLAs at, however, lower redshifts also confirms these results. Indeed, from the detection of the [O ii] nebular emission line in 3461 Mg ii absorbers, they derived an average SFR per unit area of M⊙ yr-1 kpc-2.
In Fig. 9 (b) we compare the DLA star formation rates per unit area (circles) with the SFRs obtained for other high-redshift galaxies detected in emission: the star-forming galaxies from the Gemini Deep Deep Survey (dashed-shaded area; Savaglio et al. 2004), the LBG MS 1512cB58 (square), and three -ray burst (GRB) host galaxies (diamonds)666The GRB 00926 at (Fynbo et al. 2002), the GRB 011211 at (Fynbo et al. 2003), and the GRB 021004 at (Jakobsson et al. 2005).. The SFR of MS 1512cB58 is representative of the average star formation rate of LBGs which have values between M⊙ yr-1 (Pettini et al. 1998; Kobulnicky & Koo 2000; Iwata et al. 2005; Reddy et al. 2006). This clearly shows that the DLA galaxies have star formation rates several orders of magnitude (10 to 1000 times) lower than the SFRs measured in other high-redshift galaxies. Only the SFRs of GRB hosts777Called also sometimes GRB-DLA galaxies, since they are characterized by high H i column densities as the DLAs and exhibit damped Ly profiles in their optical afterglow spectra. seem to overlap with DLAs with the higher SFRs.
Why are the DLA galaxies so different from other known high-redshift galaxies ? There is clearly a strong selection bias toward the more luminous and hence toward the stronger star forming galaxies in the sample of high-redshift emission-selected galaxies. Hence, in a way the emission-selected galaxies are atypical galaxies. The selection of DLA galaxies is, on the contrary, largely independent of their luminosity and star formation properties. They should thus be representative of the whole galaxy population and should account for both the weak and strong star forming galaxies. The predominant identification of weak star-forming galaxies with DLAs may hence reflect three indirect effects: (i) high mass and high SFR galaxies are rare in the early Universe, therefore a galaxy sample based on the covering fraction of the sky (cross-section times number) will generally lead to the detection of lower mass and lower SFR galaxies; (ii) dust obscuration biases the sample against metal-rich DLA galaxies, i.e. against dustier and stronger star forming galaxies which could obscure the background quasar (this bias is still strongly debated, however; see e.g. Ellison et al. 2001; Vladilo & Péroux 2005); and (iii) all galaxies have larger cross-section at larger radii, such that DLA sightlines tend to avoid the centers of galaxies. This implies that DLA absorptions mostly select the external (less active in terms of star formation) regions of galaxies as supported by theoretical studies of Mathlin et al. (2001). Although the latter effects certainly contribute, we expect the dominant effect is the former: DLAs sample the broad distribution of galaxies at high redshift, a distribution dominated by low masses and low star formation rates.
We finally compare the DLA SFRs obtained from absorption properties with the few DLAs for which the emission counterpart was detected and allowed a direct SFR estimation (filled triangles in Fig. 9 (b)). That concerns the DLA toward Q B22061958 at (e.g. Weatherley et al. 2005), the DLA SBS 1543+593 at toward HS 1543+5921 (Schulte-Ladbeck et al. 2005), and the DLA toward PKS 045802 at (Møller et al. 2004). Interestingly, the DLA SFRs inferred from emission show a very large dispersion, much larger than the dispersion observed in the SFRs derived from absorption properties; with, in particular, the DLA galaxy toward Q B22061958 which reaches a SFR per unit area comparable to the median SFR of emission-selected galaxies. The question which comes immediately in mind and deserves a paper on itself is: is the SFR of the DLA toward Q B22061958 atypical ? This DLA must in a certain way be exceptional, since, despite large observational efforts with at least 20 DLAs at high redshift investigated, emission from the associated galaxies is generally too weak to be detected (see also Wolfe et al. 2004, for a discussion). If this DLA is not atypical, this would have one major implication: the DLAs would hence very likely sample galaxies with a wide range of star formation efficiencies and may thus cover a much larger part of the luminosity function than expected from the SFR distribution derived from absorption only. This is supported by the work of Zwaan et al. (2005) at . Based on 21 cm column density maps of about 400 galaxies, covering all Hubble types and a wide range of luminosities, they showed that the distribution of luminosities of the galaxies producing DLAs is nearly flat from to .
We investigated again different possible correlations between this time the star formation rates per unit area obtained for the DLA galaxies in our sample and their H i column densities and metallicities (see the right panels in Fig. 10). No clear correlation is observed. Wolfe et al. (2003b) considered the same quantities and also found no correlation between the SFRs and the H i column densities. They argue that such a correlation should, however, exist resembling the Kennicutt relation found in nearby disk galaxies (Kennicutt 1998). The lack of this correlation may in our work be due to the fact that with the absorption technique we do not sample the global SFR per unit area and the global H i column density of the galaxy. The values we get are sampled over a transverse dimension corresponding to the linear dimension of the quasar, i.e. about 1 pc. A dependence of metallicity on the SFR is also expected. Wolfe et al. found marginal evidence for such a correlation. We also observe a tentative correlation when considering only the DLA galaxies with the same star formation history, namely those characterized by a single burst star formation history (dwarf irregular bursting models). This is due to the fact that for these objects we have a more direct evidence of star formation feedback leading to higher metallicities in presence of bursts with higher star formation efficiencies.
5.3 Star formation history distribution
Three different star formation histories, referred as spiral outer disk (episodic bursting SFH), dwarf irregular bursting star formation (single burst SFH), and dwarf irregular continuous star formation (continuous SFH), were identified as reproducing the DLA abundance patterns (see Sect. 3). In Figs. 9 (c) and (d), we show the distributions of the star formation histories of the DLA galaxies studied as a function of redshift and velocity width of the low-ionization absorption-lines, respectively. The goal is to investigate possible trends of specific star formation histories with redshift and the mass of the DLA galaxies. We want, however, to underline that both the uncertainty existing for most DLAs relative to the degeneracy of their best star formation history and the low number of analyzed objects do not allow to draw any statistically significant conclusions. The discussion below thus is still preliminary.
The distribution of star formation histories as a function of redshift seems to show a trend of finding more galaxies with a star formation history typical of dwarf irregulars with a bursting star formation regime toward high redshifts, . This trend again supports the first effect mentioned in Sect. 5.2 which implies that one has a higher probability to encounter younger and less evolved galactic structures with lower masses, experiencing their first bursts of star formation, toward higher redshifts. In their study of galactic morphologies in the Hubble Deep Field North and South as a function of redshift, Conselice et al. (2005) found a clear decline of the number of spirals at . It is thus not surprising to find only a few DLA galaxies two out of nine at having a star formation history typical of spiral galaxies. According to the hierarchical theory of galaxy formation, these dwarf DLA galaxies at may represent the building blocks constituting the spiral galaxies at . This is also strongly supported by a straightforward mass argument which shows that the mass density in DLAs at is much larger than the mass density in dwarfs today (Prochaska et al. 2005).
We then examined the distribution of star formation histories as a function of the velocity width of the low-ionization lines, likely related to the mass of DLA galaxies. Indeed, it was recently suggested that the observed correlation between the metallicity and the velocity width of the low-ionization lines in DLAs reveals the existence of a mass-metallicity correlation, with the velocity width being a mass indicator of these galaxies (Wolfe & Prochaska 1998; Péroux et al. 2003; Ledoux et al. 2006). Here, one would expect a trend of finding more galaxies with a star formation history typical of spiral outer disks toward high masses. No such a trend is observed, the two DLAs with a spiral outer disk star formation history do not have particularly large velocity widths relative to the six DLAs with a star formation history typical of dwarf irregulars with a bursting star formation. The DLA galaxy with the largest velocity width has in fact a star formation history typical of a dwarf irregular with a continuous star formation. The star formation history is in the case of this DLA toward Q B2230+02 very reliable, since it is one of the rare DLAs which star formation history determination is not degenerated (see Sect. 4.5). Interestingly, this galaxy is also very old with an age longer than 3.2 Gyr. As a consequence, the high mass of the galaxy may be explained as a requirement to keep the star formation on-going during such a long time.
6 Summary and concluding remarks
This paper presents the star formation properties of a sample of nine DLA galaxies at . They were obtained thanks to a new technique developed in Paper I. This technique consists of inferring the star formation history and the age of DLA systems from a detailed comparison of their intrinsic abundance patterns (free from dust depletion and ionization effects) with chemical evolution models. Comprehensive sets of elemental abundances are hence required. Our sample of DLAs fulfills this requirement and, we believe, is a sample representative of the average DLA galaxy population. Our results are the first step toward a possible connection between DLA galaxies and other galaxy populations identified in deep imaging surveys with the aim of obtaining a global picture of high-redshift objects. We obtained the following constraints on the DLA galaxies.
(1) Are the DLA abundance patterns consistent with a single class of star formation history ? The answer is no. The star formation history was unambiguously constrained for three DLAs, and the results clearly show that both a continuous and a single burst star formation history typical of local dwarf irregular galaxies are demanded. For the six other DLAs, the star formation history is degenerate between these two SFHs, but characterized by different star formation burst parameters, and the episodic bursting SFH typical of the Milky Way type spiral outer disks. Among the burst parameters which were investigated, only strong star formation bursts with an efficiency Gyr-1 which predict a far too high -enhancement at low and high metallicities ([Si/Fe] at [Fe/H] ) are ruled out by the observed DLA abundance patterns. Otherwise, the full range of dwarf irregular bursting models with efficiencies between 0.1 and 4.2 Gyr-1 and a relatively short burst duration between 0.02 and 0.2 Gyr do satisfy the various DLA abundance patterns. Similarly, continuous star formation histories characterized by weak star formation efficiencies with values ranging from 0.03 to 0.1 Gyr-1 do agree with the DLA abundance patterns. However, the spiral inner disk models with a continuous star formation history but characterized by a 10 times stronger star formation efficiency cannot be ruled out, although DLAs intersecting the inner regions of galaxies should be rare. Consequently, the abundance patterns show that DLA objects do not represent a single class of galaxy population, but sample galaxies with a variety of star formation histories. Their common characteristic is that all are weak star forming galaxies.
When adopting the star formation histories related to the models which reproduce the abundance patterns with the minimal , we do find only two DLA galaxies (each at ) in our sample of nine objects with a star formation history typical of spiral galaxies. The distribution of the DLA star formation histories as a function of redshift shows in fact a trend of finding more galaxies with a star formation history typical of dwarf irregulars with a bursting star formation toward high redshifts, . Because DLA galaxies are selected solely on their gas cross-section (i.e. independently of their luminosities), this trend, if confirmed, indicates, that less evolved galactic structures, experiencing their first bursts of star formation and having low masses, are more common toward higher redshifts. This is further supported by the line profile velocity width, age, and star formation rate distributions of the DLA galaxies.
(2) Are the DLA abundance patterns consistent with a single age ? The answer is no again. The DLA galaxies in our sample show a large spread in age from a few tens of Myr up to a few Gyr. The extremities of the spread, 20 Myr and Gyr respectively, correspond to well established ages of the two galaxies whose star formation histories are unambiguously constrained. DLAs with -enhanced abundance patterns are associated with young objects, since the -enhancement is a signature of short-lived massive stars and thus of a recent burst of star formation. Solar over iron-peak element ratios, in contrast, are associated with old objects, due to the time necessary for the release of iron-peak elements by Type Ia SNe and the need of an inefficient, continuous star formation. The oldest DLA in our sample is observed at and has an estimated age larger than 3.2 Gyr. It thus nicely indicates that galaxies were already forming at .
The general trend which comes out from the DLA age distribution as a function of redshift is a much steeper age decrease with redshift than the age decrease of the Universe. This is in agreement with the age distribution of emission-selected galaxies. A higher proportion of very young galaxies thus seem to populate the high redshift Universe at . This suggests relatively low redshifts of formation () for most galaxies observed at high redshift.
(3) Are the DLA abundance patterns consistent with a single star formation rate ? Although the results indicate a spread of two orders of magnitude, this is relatively small in comparison with the large range of known star formation rates in galaxies. The derived DLA star formation rates per unit area have values between M⊙ yr-1 kpc-2, in agreement with the SFRs obtained by Wolfe et al. (2003a) and Wild et al. (2007) using different techniques. In comparison with the SFRs of emission-selected galaxies at high redshift, they are 10 to 1000 times lower. Only the SFRs of GRB host galaxies seem to overlap with DLAs.
Why are the DLA galaxies so different from other high-redshift objects ? The emission-selected galaxy samples are known to be biased toward the more luminous and hence the stronger star forming galaxies. But what about DLAs, why do they, on the contrary, preferentially select weak star forming galaxies ? This is likely the result of three indirect effects: (i) high mass and high SFR galaxies are rare in the early Universe, therefore a galaxy sample based on gas covering-fraction of the sky (i.e. the DLA sample), will result in many galaxies with lower masses and lower SFRs; (ii) dust obscuration may bias the sample against metal-rich and strong star forming DLA galaxies; and (iii) the cross-section selection implies that DLA sightlines tend to mostly select the external, less active regions of galaxies. We expect the dominant effect is the former: DLAs sample the broad distribution of galaxies at high redshift, and thus this distribution is dominated by young proto-galactic structures with low masses and low SFRs.
At this stage, to improve our knowledge of the star formation properties of DLA galaxies, we really need a large sample of DLAs with detections of their emission counterparts. Only the direct conjunction of absorption and emission properties of DLA galaxies will bring a major step in: the comprehension of their link with both present-day and other high-redshift galaxies; the determination of their contribution to the star formation rate density of the Universe; and the proper probe of the galactic chemical evolution.
Acknowledgements.
The authors wish to thank everyone working at ESO/Paranal for the high quality of UVES spectra obtained in service mode. We are, in addition, very grateful to Cristina Chiappini and Art Wolfe for helpful discussions and advises. M.D.-Z. and F.C. acknowledge a grant from ESO Office for Science for a visit to ESO Garching to work on the analysis of the data. J.X.P. is supported by NSF CAREER grant (AST-0548180).References
- Adelberger et al. (2004) Adelberger, K. L., Steidel, C. C., Shapley, A. E., Hunt, M. P., Erb, D. K., Reddy, N. A., & Pettini, M. 2004, ApJ, 607, 226
- Annibali et al. (2003) Annibali, F., Greggio, L., Tosi, M., Aloisi, A., & Leitherer, C. 2003, AJ, 126, 2752
- Bradamante et al. (1998) Bradamante, F., Matteucci, F., & D’Ercole, A. 1998, A&A, 337, 338
- Bruzual (2002) Bruzual, G. A. 2002, Revista Mexicana de Fisica, [astro-ph/0202178]
- Calura et al. (2003) Calura, F., Matteucci, F., & Vladilo, G. 2003, MNRAS, 340, 59
- Calura & Matteucci (2004) Calura, F., & Matteucci, F. 2004, MNRAS, 350, 351
- Calura & Matteucci (2006) Calura, F., & Matteucci, F. 2006, ApJ, 652, 889
- Chen et al. (2005) Chen, H.-W., Prochaska, J. X., Weiner, B. J., Mulchaey, J. S., & Williger, G. M. 2005, ApJ, 629, L25
- Chiappini et al. (1997) Chiappini, C., Matteucci, F., & Gratton, R. 1997, ApJ, 477, 765
- Chiappini et al. (1999) Chiappini, C., Matteucci, F., Beers, T. C., & Nomoto, K. 1999, ApJ, 515, 226
- Chiappini et al. (2003) Chiappini, C., Matteucci, F., & Meynet, G. 2003, A&A, 410, 257
- Conselice et al. (2005) Conselice, C. J., Blackburne, J. A., & Papovich, C. 2005, ApJ, 620, 564
- Cora et al. (2003) Cora, S. A., Tissera, P. B., Lambas, D. G., & Mosconi, M. B. 2003, MNRAS, 343, 959
- Dessauges-Zavadsky et al. (2004) Dessauges-Zavadsky, M., Calura, F., Prochaska, J. X., D’Odorico, S., & Matteucci, F. 2004, A&A, 416, 79 [Paper I]
- Dessauges-Zavadsky et al. (2006) Dessauges-Zavadsky, M., Prochaska, J. X., D’Odorico, S., Calura, F., & Matteucci, F. 2006, A&A, 445, 93 [Paper II]
- Ellison et al. (2001) Ellison, S. L., Yan, L., Hook, I. M., Pettini, M., Wall, J. V., & Shaver, P. 2001, A&A, 379, 393
- François et al. (2004) François, P., Matteucci, F., Cayrel, R., Spite, M., Spite, F., & Chiappini, C. 2004, A&A, 421, 613
- Fynbo et al. (2002) Fynbo, J. P. U., Møller, P., Thomsen, B., Hjorth, J., Gorosabel, J., Andersen, M. I., et al. 2002, A&A, 388, 425
- Fynbo et al. (2003) Fynbo, J. P. U., Jakobsson, P., Møller, P., Hjorth, J., Thomsen, B., Andersen, M. I., et al. 2003, A&A, 406, L63
- Herbert-Fort et al. (2006) Herbert-Fort, S., Prochaska, J. X., Dessauges-Zavadsky, M., Ellison, S. L., Howk, J. C., Wolfe, A. M., & Prochter, G. E. 2006, PASP, 118, 1077
- Hou et al. (2001) Hou, J. L., Boissier, S., & Prantzos, N. 2001, A&A, 370, 23
- Howk & Sembach (1999) Howk, J. C., & Sembach, K. R. 1999, ApJ, 523, L141
- Iwata et al. (2005) Iwata, I., Inoue, A. K., & Burgarella, D. 2005, A&A, 440, 881
- Izotov et al. (2001) Izotov, Y. I., Shaerer, D., & Charbonnel, C. 2001, ApJ, 549, 878
- Jakobsson et al. (2005) Jakobsson, P., Bjørnsson, G., Fynbo, J. P. U., Jóhannesson, G., Hjorth, J., Thomsen, B., et al. 2005, MNRAS, 362, 245
- Jimenez, Bowen & Matteucci (1999) Jimenez, R., Bowen, D. V., & Matteucci, F. 1999, ApJ, 514, 83
- Kennicutt (1998) Kennicutt, R. C. Jr. 1998, ARA&A, 36, 189
- Kobulnicky & Koo (2000) Kobulnicky, H. A., & Koo, D. C. 2000, ApJ, 545, 712
- Kunth et al. (1995) Kunth, D., Matteucci, F., & Marconi, G. 1995, A&A, 297, 634
- Le Brun et al. (1997) Le Brun, V., Bergeron, J., Boissé, P., & Deharveng, J. M. 1997, A&A, 321, 733
- Ledoux et al. (2006) Ledoux, C., Petitjean, P., Fynbo, J. P. U., Møller, P., & Srianand, R. 2006, A&A, 457, 71
- Levshakov et al. (2002) Levshakov, S. A., Dessauges-Zavadsky, M., D’Odorico, S., & Molaro, P. 2002, ApJ, 595, 696
- Lu et al. (1996) Lu, L., Sargent, W. L. W., Barlow, T. A., Churchill, C. W., & Vogt, S. S. 1996, ApJS, 107, 475
- Mathlin et al. (2001) Mathlin, G. P., Baker, A. C., Churches, D. K., & Edmunds, M. G. 2001, MNRAS, 321, 743
- Matteucci & François (1989) Matteucci, F., & François, P. 1989, MNRAS, 239, 885
- Matteucci (2001) Matteucci, F. 2001, The Chemical Evolution of the Galaxy, Astrophysics and Space Science Library, vol.253, Dordrecht: Kluwer Academic Publisher
- Meynet & Maeder (2002) Meynet, G., & Maeder, A. 2002, A&A, 381, L25
- Møller et al. (2004) Møller, P., Fynbo, J. P. U., & Fall, S. M. 2004, A&A, 422, 33
- Nomoto et al. (1997a) Nomoto, K., Hashimoto, M., Tsujimoto, T., Thielemann, F. K., Kishimoto, N., Kubo, Y., & Nakasato, N. 1997a, Nucl. Phys. A, 616, 79
- Nomoto et al. (1997b) Nomoto, K., Iwamoto, K., Nakasato, N. T., et al. 1997b, Nucl. Phys. A, 621, 467
- Péroux et al. (2003) Péroux, C., Dessauges-Zavadsky, M., D’Odorico, S., Kim, T.-S., & McMahon, R. G. 2003, MNRAS, 345, 480
- Petitjean et al. (2000) Petitjean, P., Srianand, R., & Ledoux, C. 2000, A&A, 364, L26
- Pettini et al. (1994) Pettini, M., Smith, L. J., Hunstead, R. W., & King, D. L. 1994, ApJ, 426, 79
- Pettini et al. (1998) Pettini, M., Kellogg, M., Steidel, C. C., Dickinson, M., Adelberger, K. L., & Giavalisco, M. 1998, ApJ, 508, 539
- Pettini et al. (2000a) Pettini, M., Ellison, S. L., Steidel, C. C., Shapley, A. E., & Bowen, D. V. 2000a, ApJ, 532, 65
- Pettini et al. (2000b) Pettini, M., Steidel, C. C., Adelberger, K. L., Dickinson, M., & Giavalisco, M. 2000b, ApJ, 528, 96
- Pettini et al. (2002) Pettini, M., Rix, S. A., Steidel, C. C., Adelberger, K. L., Hunt, M. P., & Shapley, A. E. 2002, ApJ, 569, 742
- Prochaska & Wolfe (1999) Prochaska, J. X., & Wolfe, A. M. 1999, ApJS, 121, 369
- Prochaska et al. (2001) Prochaska, J. X., Wolfe, A. M., Tytler, D., et al. 2001, ApJS, 137, 21
- Prochaska et al. (2002) Prochaska, J. X., Howk, J. C., O’Meara, J. M., et al. 2002, ApJ, 571, 693
- Prochaska & Wolfe (2002) Prochaska, J. X., & Wolfe, A. M. 2002, ApJ, 566, 68
- Prochaska et al. (2003) Prochaska, J. X., Howk, J. C., & Wolfe, A. M. 2003, Nature, 423, 57
- Prochaska et al. (2005) Prochaska, J. X., Herbert-Fort, S., & Wolfe, A. M. 2005, ApJ, 635, 123
- Rao et al. (2003) Rao, S. M., Nestor, D. B., Turnshek, D. A., Lane, W. M., Monier, E. M., & Bergeron, J. 2003, ApJ, 595, 94
- Recchi et al. (2001) Recchi, S., Matteucci, F., & D’Ercole, A. 2001, MNRAS, 322, 800
- Recchi et al. (2002) Recchi, S., Matteucci, F., D’Ercole, A., Tosi, M. 2002, A&A, 384, 799
- Reddy et al. (2006) Reddy, N. A., Erb, D. K., Steidel, C. C., Shapley, A. E., Adelberger, K. L., & Pettini, M. 2006, ApJ, in press [astro-ph/0507264]
- Romano et al. (2005) Romano, D., Chiappini, C., Matteucci, F., & Tosi, M. 2005, A&A, 430, 491
- Russell & Dopita (1992) Russell, S. C., & Dopita, M. A. 1992, ApJ, 384, 508
- Salpeter (1955) Salpeter, E. E. 1955, ApJ, 121, 161
- Savage & Sembach (1996) Savage, B. D., & Sembach, K. R. 1996, ARA&A, 34, 279
- Savaglio et al. (2000) Savaglio, S., Panagia, N., & Stiavelli, M. 2000, in ASP Conf. Ser. Vol. 215, Cosmic Evolution and Galaxy Formation: Structure, Interactions, and Feedback, ed. J. Franco, L. Terlevich, O. Lopez-Cruz, & I. Aretxaga, 65
- Savaglio et al. (2004) Savaglio, S., Glazebrook, K., Abraham, R. G., Crampton, D., Chen, H.-W., McCarthy, P. J. P., Jorgensen, I., et al. 2004, ApJ, 602, 51
- Scalo (1986) Scalo, J. M. 1986, FCPh, 11, 1
- Schulte-Ladbeck et al. (2005) Schulte-Ladbeck, R. E., König, B., Miller, C. J., Hopkins, A. M., Drozdovsky, I. O., Turnshek, D. A., & Hopp, U. 2005, ApJ, 625, 79
- Sofia & Jenkins (1998) Sofia, U. J., & Jenkins, E. B. 1998, ApJ, 499, 951
- Steidel et al. (1996) Steidel, C. C., Giavalisco, M., Pettini, M., Dickinson, M., & Adelberger, K. L. 1996, ApJ, 496, L17
- Steidel et al. (2003) Steidel, C. C., Adelberger, K. L., Shapley, A. E., Pettini, M., Dickinson, M., & Giavalisco, M. 2003, ApJ, 592, 728
- Steidel et al. (2005) Steidel, C. C., Adelberger, K. L., Shapley, A. E., Erb, D. K., Reddy, N. A., & Pettini, M. 2005, ApJ, 626, 44
- van den Hoeck & Groenwegen (1997) van den Hoeck, L. B., & Groenwegen, M. A. T. 1997, A&AS, 123, 305
- Viegas (1995) Viegas, S. M. 1995, MNRAS, 276, 268
- Vladilo (1998) Vladilo, G. 1998, ApJ, 493, 583
- Vladilo et al. (2001) Vladilo, G., Centurión, M., Bonifacio, P., & Howk, J. C. 2001, ApJ, 557, 1007
- Vladilo (2002a) Vladilo, G. 2002a, A&A, 391, 407
- Vladilo (2002b) Vladilo, G. 2002b, ApJ, 569, 295
- Vladilo & Péroux (2005) Vladilo, G., & Péroux, C. 2005, A&A, 444, 461
- Weatherley et al. (2005) Weatherley, S. J., Warren, S. J., Møller, P., Fall, S. M., Fynbo, J. U., & Croom, S. M. 2005, MNRAS, 358, 985
- Wild et al. (2007) Wild, V., Hewett, P., & Pettini, M. 2007, MNRAS, in press [astro-ph/0611083]
- Wolfe et al. (1986) Wolfe, A. M., Turnshek, D. A., Smith, H. E., & Cohen, R. D. 1986, ApJS, 61, 249
- Wolfe & Prochaska (1998) Wolfe, A. M., & Prochaska, J. X. 1998, ApJ, 494, L15
- Wolfe et al. (2003a) Wolfe, A. M., Prochaska, J. X., & Gawiser, E. 2003a, ApJ, 593, 215
- Wolfe et al. (2003b) Wolfe, A. M., Gawiser, E., & Prochaska, J. X. 2003b, ApJ, 593, 235
- Wolfe et al. (2004) Wolfe, A. M., Howk, J. C., Gawiser, E., Prochaska, J. X., & Lopez, S. 2004, ApJ, 615, 625
- Zwaan et al. (2005) Zwaan, M. A., van der Hulst, J. M., Briggs, F. H., Verheijen, M. A. W., & Ryan-Weber E. V. 2005, MNRAS, 364, 1467