The origin of the molecular emission around the southern hemisphere Re 4 IRS – HH 188 region
Abstract
Context. We present SEST observations of the molecular environment ahead of the southern Herbig-Haro object 188 (HH 188), associated with the low-mass protostar Re 4 IRS. We have also used the SuperCosmos H survey to search for H emission associated with the Re 4 IRS – HH 188 region.
Aims. The aim of the present work is to study the properties of the molecular gas and to better characterize this southern star forming region.
Methods. We mapped the HCO+ 3–2 and H13CO+ 1–0 emission around the YSO and took spectra of the CH3OH 20–10 A+ and 2-1–1-1 E and SO 65–54 towards the central source. Column densities are derived and different scenarios are considered to explain the origin of the molecular emission.
Results. HCO+ arises from a relatively compact region around the YSO; however, its peak emission is displaced to the south following the outflow direction. Our chemical analysis indicates that a plausible scenario is that most of the emission arises from the cold, illuminated dense gas ahead of the HH 188 object. We have also found that HH 188, a high excitation object, seems to be part of a parsec scale and highly collimated HH system. Re 4 IRS is probably a binary protostellar system, in the late Class 0 or Class I phase. One of the protostars, invisible in the near-IR, seems to power the HH 188 system.
Key Words.:
ISM: individual: HH 188 — ISM: abundances — ISM: clouds — ISM: molecules — Radio lines: ISM — Stars: formation1 Introduction
Re 4 is an optical reflection nebula, also classified as a cometary globule (Reipurth Reipurth81 (1981)), in the dark cloud listed as No. 109 by Sandqvist (Sandqvist77 (1977)). This cloud is located within the Gum Nebula at a distance of pc. Spectroscopical observations in the optical of the nebula (Graham Graham86 (1986)) shows a very red continuum emission and some absorption (Na I D) and emission lines, mainly SII, H, OI. The emission line strengths resemble those of the low-excitation HH objects. Re 4 is associated with a low–mass protostar. Emission associated with the protostar or its dense circumstellar environment is detected from near–IR (2MASS J08205824-4934456), mid and far IR (IRAS 081944925) through to millimeter wavelengths (Graham Graham86 (1986); Reipurth et al. Reipurth93 (1993); Dent et al. Dent98 (1998)). The protostar (hereafter Re 4 IRS) has a bolometric luminosity of 30 L⊙ (Cohen & Schwartz Cohen87 (1987)). There is a star located only northeast of Re 4 and detected also in the near–IR (2MASS J08205862-4934443). Its optical spectroscopic profile suggests that is a K5 V foreground star (Graham Graham86 (1986)). Re 4 IRS is associated with a Herbig-Haro object, HH 188, which appears as a series of few knots extending about 10′′ south of the Re 4 nebulosity (Graham Graham86 (1986)). The optical spectra of these knots show emission in SII, H, OI and NaII.
VLT near–IR observations show that the Re 4 reflection nebulosity extends further away from the protostar with a S–like morphology, blue in the south, red in the north, probably indicating that the northern lobe is further from us and more embedded in the parent cloud (Zinnecker et al. Zinnecker99 (1999)). This peculiar shape is possibly tracing excavated cavities by the outflow associated with HH 188. The VLT images show hints of what appear to be a binary jet emanating from the obscured centre, with an offset angle between the two jets of 5–10∘ (Zinnecker et al. Zinnecker99 (1999)).
In this paper we present SEST observations of the extended molecular emission around Re 4 IRS and HH 188 as well as complementary data taken from public optical/near-IR data. In § 2 we describe the observations. In § 3 we describe the results of the observations and we analyze the molecular emission around Re 4 and HH 188. In § 4 we describe the search for possible new HH objects associated with HH 188 by using the H SuperCosmos survey. In § 5 we discuss the properties of Re 4 IRS, HH 188 and its association with a larger HH system. We also discuss the different possibilities for the origin of the molecular emission. In § 6 we summarize our findings.
2 Observations
The observations were carried out in January 10 and 11 2003 with the SEST 15m radio telescope at La Silla (Chile). We used the dual receiver capability of the telescope to observe two molecular lines simultaneously, one at 3 mm and the other at 1 mm: hence we observed simultaneously the HCO+ 3–2 and H13CO+ 1–0 as well as the SO 65–54 and CH3OH 20–10 A+. We used the High Resolution Acousto-Optic Spectrometer, which provided a spectral resolution of 0.14 and 0.05 km s-1 at 3 and 1 mm, respectively (the 1 mm data was smoothed to a resolution of km s-1 to increase the signal-to-noise ratio). The observations were taken using the frequency switching mode, which gives a bandwidth of 120 and 30 km s-1 at 3 and 1 mm, respectively . For the HCO+ and H13CO+ lines we did a grid of 26 points, with a cellsize of 20′′, covering an area of around Re 4 IRS. The SO and CH3OH were only observed towards the IR source. Table 1 lists the lines observed, their frequencies, the SEST FWHM (full width at half maximum) beam size for these frequencies, the spectral resolution of the data and the noise in units of main beam temperature. Average system temperatures during the observations were about 150, 180, 170, 600 K at 86, 97, 220 and 267 GHz, respectively. Main beam efficiency at these same frequencies were 0.75, 0.72, 0.52 and 0.42.
|
||||||||||||||||||||||||||||||||||||||||||||
-
a
These spectra included also the 2-1–1-1 E line.

3 Results and Analysis
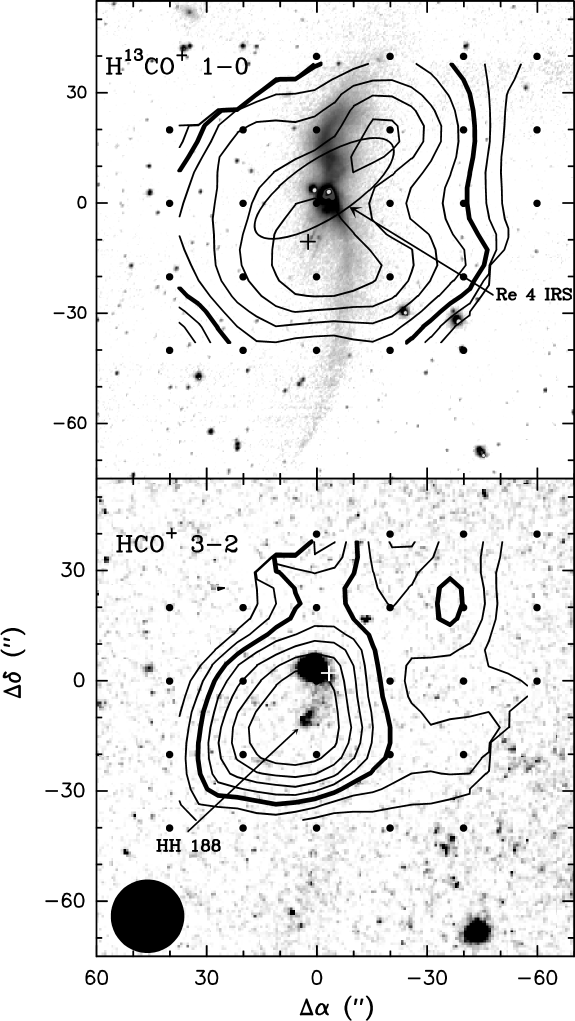
Figure 1 shows the integrated emission map of the HCO+ 3–2 and H13CO+ 1–0 transitions. Figure 2 shows the spectra of the HCO+ isotopes as well as those of the SO and CH3OH lines. Table 5 shows the results of Gaussian fits to the spectra at four different positions. The emission appears to be relatively compact around Re 4 IRS. From the HCO+ 3–2 map, which has the highest angular resolution (), the FWHM contour has a diameter of , which implies a deconvolved size of or 0.09 pc (assuming that the emission arises from a single gaussian component). The peak of the HCO+ 3–2 emission is near HH 188, approximately at the offset position, i. e. (J2000) and (J2000).
From the spectra (see Figure 3 and Table 5) one can see that the lines are narrow, with a width of to 0.8 km s-1 for the H13CO+ line, which is optically thin, and that there are no significant velocity gradients along the region ( km s-1). The HCO+ 3–2 spectra do not show self-absorption. Redshifted self-absorption in optically thick lines can be a signature of infall motions (e.g., Zhou et al. Zhou93 (1993); Rawlings & Yates Rawlings01 (2001)).

The column densities were derived in the following manner: for the SO and CH3OH we assumed optically thin emission and an excitation temperature of 10 K. For the HCO+, we first convolved the HCO+ 3–2 emission with a Gaussian to obtain a final beam size of , the angular resolution of the H13CO+ spectra. Then, the HCO+ 3–2 and H13CO+ 1–0 optical depth were derived from the line ratio of the H13CO+ to the convolved HCO+ spectra at the positions given in Table 5 and assuming a 12C to 13C ratio of 63 (Langer & Penzias Langer93 (1993)). An excitation temperature of 7 K was adopted for the HCO+ lines, which is the typical value found for this molecule in the illuminated condensations ahead of HH objects (Girart et al. Girart02 (2002); Viti et al. Viti06 (2006)). We find that the H13CO+ line is optically thin, , whereas the HCO+ line optically thick, . The column density of the HCO+ is derived from both the original and the convolved HCO+ 3–2 spectra, assuming LTE for the aforementioned excitation temperature and correcting for the optical depth (see Table 2).
In order to derive the fractional abundances we first estimate the total molecular hydrogen column density from the dust emission. We used the dust measured with the SEST at 1.3 mm (therefore at a similar angular resolution of our SO and HCO+ observations) by Reipurth et al. (Reipurth93 (1993)), Jy. By adopting a dust opacity of cm2 g-1 (Ossenkopf & Henning Ossenkopf94 (1994)), a gas–to–mass ratio of 100 and a dust temperature of 35 K (Reipurth et al. Reipurth93 (1993)), the beam averaged column density of the molecular hydrogen is cm-2. Thus, the fractional abundances of SO and HCO+are SO and [HCO+]. For the CH3OH, we first assume that the CH3OH and HCO+ trace the same gas. In this case, the column density ratio of these two species will be the same at 57′′ (the angular resolution of the CH3OH spectra) and at . From here, the derived fractional abundance is [CH3OH].
|
||||||||||||||||||||||||||||||||||||||||||||||
-
a
stands for . Column density units in cm-3. Abundances derived assuming H cm-3.
-
b
Beam averaged column density for a beam of
-
c
Beam averaged column density for a beam of
4 Inspection of the H SuperCosmos survey
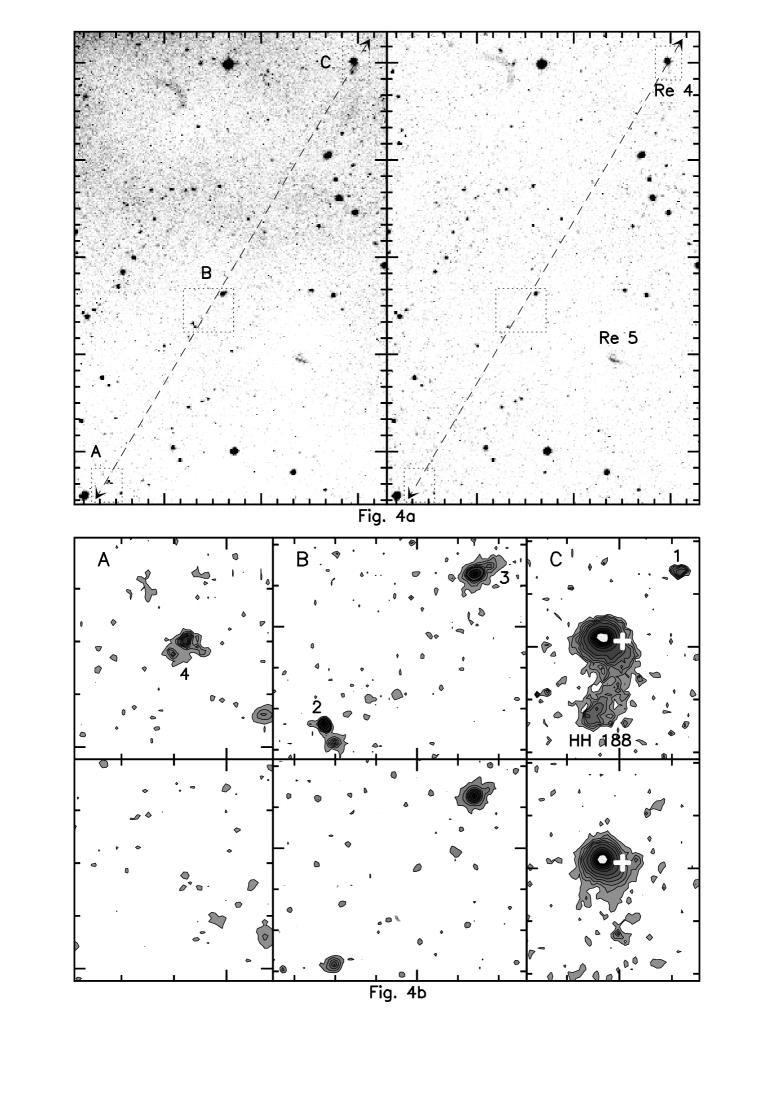
We have examined the H SuperCosmos survey in a region of around HH 188 in order to check for possible HH–like objects that may be associated to this region. Figure 4 shows the narrow band image centered at the H image and the red broad band continuum image. We have found several knots of pure H emission. Table 3 shows the position, distance and the position angle with respect to Re 4 IRS (see § 5.1). Around Re 4 IRS there is a compact (a size of ) counterpart of HH 188 northwest of the infrared source. This knot and HH 188 are separated by with a position angle of 148.9∘. Southeast of HH 188 we have found three other relatively compact knots () of pure H emission. Object 2 is close to a star (). However, an inspection of the 2MASS catalogue shows that this star has colors, and , indicating that it is a main sequence star. This suggests that the H emission is not related with the star. The five H objects, including HH 188, appear very well aligned (see Fig. 4) with a position angle of . We checked the 2MASS catalogue and neither of these sources have emission in the near-IR. The lack of red continuum and near-IR emission suggests that these objects are probably HH objects, apparently forming part of the same system and associated with HH 188.
|
-
a
Distance and position angle with respect to the driving source, Re 4 IRS, which is assumed to lie between HH-like object 1 and HH 188 (see § 5.1).
5 Discussion
5.1 Re 4 IRS and the HH 188 system
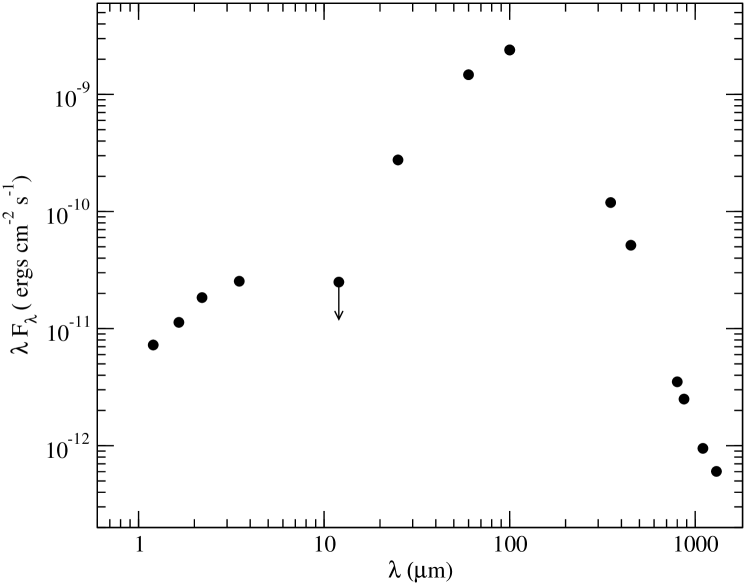
Figure 5 shows the spectral energy distribution (SED) of the driving source of HH 188, Re 4 IRS.
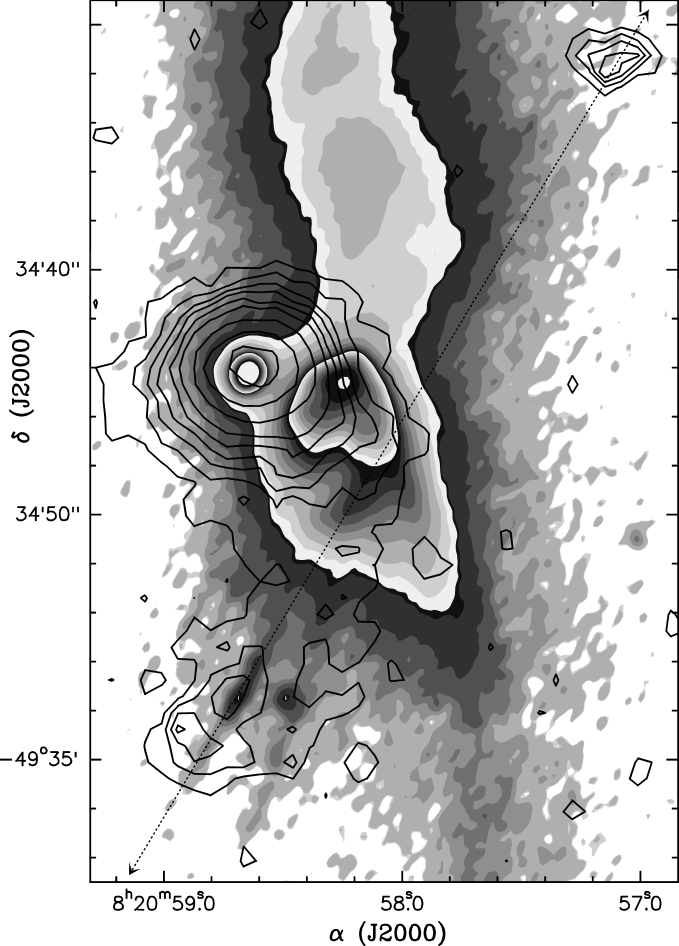
Whitney et al. (Whitney03 (2003)) carried out detailed radiative transfer models of protostellar envelopes, showing the expected SED and the near-IR morphology for different inclination angles and evolutionary stages. By using the Re 4 IRS’s SED and the color composite image obtained by Zinnecker et al. (Zinnecker99 (1999)) we found that this YSO is possibly a late Class 0 or Class I object, with an inclination angle of roughly . Graham & Heyer (Graham89 (1989)) pointed out that the near-IR emission associated with Re 4 IRS has a cometary structure (see Fig. 6), which indicates that is tracing the scattered stellar light arising from the cavity created by the outflow. Comparing the images at , , , , the cometary structure appears to be displaced to the northwest at increasing wavelength (Graham & Heyer Graham89 (1989)). Taking into account that at increasing wavelengths the emission arises closer to the YSO, then the most reliable position of the source is from the Ks band: from the Zinnecker et al. (Zinnecker99 (1999)) image, the position of Re 4 IRS is (J2000) and (J2000) (with a position uncertainty of : Correia, private communication).
Figure 6 shows that the near-IR emission associated with Re 4 IRS is not perfectly aligned with HH 188 and the H knot 1: these two form a position angle of 149∘, whereas the Ks emission peak of Re 4 IRS has position angle of 158∘ and 140∘ with HH 188 and the H knot 1, respectively. This suggests that the powering source of the HH 188 system should be located roughly few arcsecs west of near-IR peak emission. A tentative position for the powering source can be obtained assuming that it is located equidistantly between HH 188 and the H 1, that is: (J2000) and (J2000). This is west of the Re 4 IRS position derived previously from the Ks image. Table 3 shows the distance and position angle of the different H knots with respect to this tentative position: all the H knots are very well aligned with respect to this position with a position angle of . In addition, as can be seen in Figure 6, one of the two jets detected by Zinnecker et al. (Zinnecker99 (1999)) coincides with HH 188 and is also well aligned with the direction of the HH 188 system. Thus, as already suggested by Zinnecker et al. (Zinnecker99 (1999)), it seems that Re 4 IRS is a binary system. The protostar powering the HH 188 system is possibly a very embedded object, too faint in the near-IR to be detected. On the other hand, the protostar associated with the near-IR cometary-like emission could be the powering source of the other jet detected in the Ks image (see Fig. 6).
The different H knots aligned with HH 188 and Re 4 IRS span over a length of 10′ or 1.2 pc in projection. The two brightest spots are the two farthest and southernmost objects, 4 and 5 from Table 3. The properties of the HH 188 can be derived from the spectroscopical observations obtained by Graham (Graham86 (1986)): Table 5 of that paper gives the relative intensities (with respect to H) of the different emission lines detected (SII, H, OI and NaII). From the SII/H and SII /SII lines ratios we estimate that HH 188 is a high excitation object with a high electron density (n(e-)2000 cm-3). For the other knots further observations are required to characterize their properties.
5.2 The origin of the HCO+ emission
The HCO+ 3–2 peak is close to HH 188 and offset by to the southeast with respect to the peak position of Ks emission from Re 4 IRS. If, instead we use the tentative position of the HH 188 system’s driving source, the offset is . This offset between the HCO+ emission and the protostar is comparable to the beam diameter of the HCO+ map, so it is significative.
The fractional abundances derived in Section 3 assume that the emission comes from the central source, as we derived the H2 column density from the dust measurement at 1.3 mm that peaks at Re 4 IRS. However, the properties of the molecular emission that we see i.e (i) a displacement to the southeast close to HH 188, (ii) no significant velocity gradients, and (iii) narrow line widths, suggest that the molecular gas comes, at least partly, from an unperturbed dynamically or quiescent region. Nevertheless, because the angular resolution of our observations is not high enough to spatially resolve the IR and HH objects, we can not easily determine where the molecular emission comes from. Hence below we qualitatively investigate different possibilities.
At first we consider the most straightforward possibility that the emission comes from the dense circumstellar envelope around the protostar Re 4 IRS. If we assume that the SO and HCO+ come from the cold, outer envelope around the protostar, then their abundances are a factor of respectively lower and higher with respect to the average value in the sample of Class 0 and I low mass protostars studied by Jørgensen et al. al. (Jorgensen04 (2004)), but still within the range of derived values. The CH3OH is expected to be significantly enhanced in the warm, inner envelopes ( K) around low mass protostars (Maret et al. Maret05 (2005); Jørgensen et al. Jorgensen05 (2005)). Our observations of CH3OH around Re 4 IRS yield an abundance higher than the range of values for the outer envelopes given by Maret et al. (Maret05 (2005)) but much lower than the values found for the inner envelopes. The low CH3OH line width ( km s-1) and the non-detection of the 20–10 E transition in Re 4 IRS discards the inner envelope origin: in the Maret et al. (Maret05 (2005)) sample, the line widths are always larger than 1 km s-1, with several cases where the line widths are few km s-1, and the 20–10 E transition should have been detected for densities higher than few times cm-3. Therefore, our observations suggests that a significant fraction of the CH3OH emission does not arise from the envelope around the IRAS protostar. In fact in other star forming regions, quiescent methanol emission has been detected significantly offset from the protostars and not too far from shocks (Palau et al. Palau07 (2007); Girart et al. Girart07 (2007)).
These concerns led us to take into consideration alternative scenarios for the origin of at least a significant fraction of the observed molecular emission. It could be that most of the molecular emission arises from the interface along the HH 188 jet with the ambient cloud: in low-mass star forming regions, observations of enhanced HCO+ toward several Class 0 objects can indeed be interpreted as coming from the walls of the outflow cavity (Hogerheijde et al. Hogerheijde98 (1998); Rawlings et al. Rawlings00 (2000); Redman et al. Redman04 (2004)). It is not unreasonable to assume that highly turbulent interfaces may be present in all environments where HH jets interact with the surrounding molecular cloud. Such interfaces have been shown to be characterized by a chemistry that is quite distinct in nature from that of typical dense cores and would not be achieved by any modification of conventional cold-cloud chemistry (Lim et al. Lim01 (2001); Rawlings & Hartquist Rawlings97 (1997)). However, if the emission were coming from an interface one would expect larger ( 1 km s-1) linewidths.
|
-
a
The uncertainty of these ratios is approximately 30%
Another possibility is whether the emission arises from the cold, illuminated, gas ahead of the HH 188 object: quiescent, cold, molecular condensations have been found ahead of several HH objects in enhanced emission of HCO+ (e.g. Rudolph & Welch Rudolph88 (1988); Torrelles et al. Torrelles92 (1992); Girart et al. Girart05 (2005)) and can be explained as the result of photochemistry generated by UV radiation from the HH shock which leads to evaporation of icy mantles on dust grains in small density enhancements (e.g. Viti & Williams Viti99 (1999)). In favour of this scenario it is important to point out that the SII/H lines ratio estimated in HH 188 is similar to the one derived for HH 34 (Morse et al. Morse92 (1992)). HH 34, as well as other high-excitation objects, is known to have apparently illuminated dense molecular gas. Recently Viti et al. (Viti06 (2006)) presented a molecular survey ahead of several HH objects and found that the typical density, temperature, and line widths of such clumps are 105-106 cm-2, 10-20 K, and 0.4-1.5 km s-1 respectively; the derived ranges of column densities for HCO+, CH3OH and SO were respectively: 51012–21014, 31013–41014, and 81012–91013 cm-2. The observed column densities around IRAS 081944925 are indeed consistent with these ranges. This together with the fact that the HCO+ peak is displaced with respect to the IRS source and the line widths of the emission lines are of the same order as those from the molecular emission detected ahead of all the HH objects in the survey make this scenario a plausible one. It is then interesting to compare the ratio of column densities derived here with those from the objects in the survey by Viti et al. (Viti06 (2006)) and with HH 2, whose complex interaction with its surroundings has been extensively studied (Girart et al. Girart02 (2002); Viti et al. Viti03 (2003); Lefloch et al. Lefloch05 (2005); Girart et al. Girart05 (2005)). We list these ratios in Table 4. The reason for using ratios rather than individual column densities is to make the comparisons independent of the telescope. Both ratios indicate that if the molecular emission is indeed coming from the quiescent gas ahead of the HH object then it is closer in characteristics to HH 2 than HH 1 and HH 34. The region surrounding HH 2 is very complex: for this comparison we chose to use the ratios derived from the densest (and closer to the HH 2) part of the region that Girart et al. (2005) interpret as being quiescent and directly illuminated by the UV coming from HH 2 (measured to be 40 Habing, see Molinari & Noriega-Crespo Molinari02 (2002)). Hence, if this scenario is correct, the gas we observe around HH 188 has a density of 105 cm-3, and a temperature of K.
Finally, we consider the possibility that the background radiation from the Gum Nebula is the source of the UV radiation that is altering chemically the molecular gas in a similar way as the HH object. The Gum Nebula shows diffuse and extended H and radio emission, which suggests that it has also associated significant UV radiation generated by OB stars and/or by and old supernova remnant (e.g. Woermann, Gaylard & Otrupcek Woermann0 (2000)). In order to consider this possibility we checked the SHASSA H survey (Gaustad et al. Gaustad01 (2001)). The Sandqvist 109 molecular cloud (which includes the Re 4 IRS region) is at a distance of from the brightest H emission regions of the Gum nebula. The background H emission around Re 4 IRS regions is about 2 to 3 times weaker than these bright regions. We have also checked the SHASSA survey around two other high excitation HH objects with irradiated dense molecular clumps, HH 2 and HH 34, both in the Orion star forming region, where there is also diffuse H emission. The level of diffuse H emission around these two objects is similar to the level in the Re 4 IRS region. HH 34 (Viti et al. Viti06 (2006)) and in particular HH 2 (Girart et al. Girart05 (2005)) exhibit molecular emission that has been succesfully modelled using the UV radiation–driven chemistry scenario. Although the possibility that the diffuse UV radiation contributes to the illumination of the molecular condensation can not be ruled out, the close spatial connection of the molecular emission with the HH objects indicates that the main source of UV radiation comes from the HH objects.
6 Summary
In this paper we presented maps of the region around Re 4 IRS in HCO+ (3-2) and H13CO+ (1-0), as well as observations in SO (65–54) and CH3OH (20-10 A+) of the central position. We find that the HCO+ emission is quite compact around the protostar but its peak is displaced to the southeast close to the Herbig-Haro object HH 188. All the lines are narrow ( 0.7 km s-1) and HCO+ does not show any sign of infall. Column densities were derived assuming LTE conditions.
We have also checked the SuperCosmos H survey and have found several knots of pure H emission very well aligned with HH 188 and forming an apparent parsec scale HH system. The driving source of this system is possibly an embedded protostar invisible in the near-IR. We tentatively estimate that it is located about west of the Ks emission peak. The protostar illuminating the near-IR cometary–like nebula is possibly the exciting source of a faint jet. Thus, Re 4 IRS, a late Class 0 or Class I object, seems to be a binary system, as suggested by Zinnecker et al. Zinnecker99 (1999).
We attempt a very simple chemical analysis of the molecular emission in order to shed light on its origin. We consider four scenarios as the possible origin of the emission: the circumstellar envelope around the protostar; an interface along the HH 188 jet with the ambient cloud; the quiescent, cold, illuminated gas ahead of the HH 188 jet; illumination by the diffuse Gum Nebula emission. The derived column densities, as well as the narrowness of the linewidths and the morphology of the HCO+ emission are in agreement with the third scenario making it a plausible one, although it is still possible that there is contribution from the outer cold envelope around the protostar.
These observations have shown that the Re 4 IRS–HH 188 would make an interesting southern target for future ALMA studies of star forming regions.
Acknowledgements.
We thank H. Zinnecker and S. Correia for providing the VLT Ks image. JMG acknowledges support by MCyT grant AYA2005-08523-C03-02. SV acknowledges individual financial support from a PPARC Advanced Fellowship. JMG and SV acknowledge support by a joined Royal Society and CSIC travel grant. This publication makes use of data products from the Two Micron All Sky Survey, which is a joint project of the University of Massachusetts and the Infrared Processing and Analysis Center/California Institute of Technology, funded by the National Aeronautics and Space Administration and the National Science Foundation.References
- (1) Cohen, M., & Schwartz, R. D. 1987, ApJ, 316, 311
- (2) Dent, W. R. F., Matthews, H. E., & Ward-Thompson, D. 1998, MNRAS, 301, 1049
- (3) Gaustad, J. E., McCullough, P. R., Rosing W., & Van Buren, D. 2001, PASP, 113, 1326
- (4) Girart, J. M., Viti, S., Williams, D. A., Estalella, R., & Ho, P. T. P. 2002, A&A, 388, 1004
- (5) Girart, J. M., Viti, S., Estalella, R., Williams, D. A., 2005, A&A, 439, 601
- (6) Girart, J. M., et al. 2007, in preparation
- (7) Graham, J. A. 1986, ApJ, 302, 352
- (8) Graham, J. A., & Heyer, M. 1989, PASP, 101, 573
- (9) Hogerheijde, M. R., van Dishoeck, E. F., Blake, G. A., & van Langevelde, H. J. 1998, ApJ, 502, 315
- (10) Jørgensen, J. K., Schöier, F. L., & van Dishoeck, E. F. 2004, A&A, 416, 603
- (11) Jørgensen, J. K., Schöier, F. L., & van Dishoeck, E. F. 2005, A&A, 437, 501
- (12) Langer, W. D. & Penzias, A. A. 1993, ApJ, 408, 539
- (13) Lefloch, B., Cernicharo, J., Cabrit, S., & Cesarsky, D. 2005, A&A, 433, 217
- (14) Lim, A. J., Rawlings, J. M. C., & Williams, D. A. 2001, A&A, 376, 336
- (15) Maret, S., Ceccarelli, C., Tielens, A. G. G. M., et al. 2005, A&A, 442, 527
- (16) Molinari, S., & Noriega–Crespo, A. 2002, AJ, 123, 2010
- (17) Morse, J. A., Hartigan, P., Cecil, G., Raymond, J. C., & Heathcote, S. 1992, ApJ, 399, 231
- (18) Ossenkopf, V., & Henning, T. 1994, A&A, 291, 943
- (19) Palau, A., Estalella, R., Girart, J. M., et al. 2007,A&A, 465, 219
- (20) Parker, Q. A., et al. 2005, MNRAS, 362, 689
- (21) Rawlings, J. M. C., & Hartquist, T. W. 1997, ApJ, 487, 672
- (22) Rawlings, J. M. C., Taylor, S. D., & Williams, D. A. 2000, MNRAS, 313, 461
- (23) Rawlings, J.M.C., & Yates, J.A. 2001, MNRAS, 326, 1423
- (24) Redman, M. P., Rawlings, J. M. C., Yates, J. A., & Williams, D. A. 2004, MNRAS, 352, 243
- (25) Reipurth, B. 1981, A&AS, 44, 379
- (26) Reipurth, B., Chini, R., Krugel, E., Kreysa, E., & Sievers, A. 1993, A&A, 273, 221
- (27) Rudolph, A., & Welch, W. J., 1988, ApJ, 326, L31
- (28) Sandqvist, A. 1977, A&A, 57, 467
- (29) Torrelles, J. M., Rodriguez, L. F., Canto, J., et al. 1992, ApJ, 396, L95
- (30) Viti, S. & Williams, D. A. 1999, MNRAS, 310, 517
- (31) Viti, S., Girart, J. M., Garrod, R., Williams, D. A., & Estalella, R. 2003, A&A, 399, 187
- (32) Viti, S., Girart, J. M., & Hatchell, J. 2006, A&A, 449, 1089
- (33) Whitney, B. A., Wood, K., Bjorkman, J. E., & Cohen, M. 2003, ApJ, 598, 1079
- (34) Woermann, B., Gaylard, M. J., & Otrupcek, R. 2000, MNRAS, 315, 241
- (35) Zhou, S., Evans, N. J., II, Koempe, C., & Walmsley, C. M. 1993, ApJ, 404, 232
- (36) Zinnecker, H., Krabbe, A., McCaughrean, M. J., et al. 1999, A&A, 352, L73
|
||||||||||||||||||||||||||||||||||||||||||||||||||||||||||||||||||||||||||||||||||||||||||||
-
a
The three methanol lines were fitted simultaneously