Dynamics of quantum spin liquid and spin solid phases in IPA-CuCl3 under field.
Abstract
Inelastic and elastic neutron scattering is used to study spin correlations in the quasi-one dimensional quantum antiferromagnet IPA-CuCl3 in strong applied magnetic fields. A condensation of magnons and commensurate transverse long-range ordering is observe at a critical filed T. The field dependencies of the energies and polarizations of all magnon branches are investigated both below and above the transition point. Their dispersion is measured across the entire 1D Brillouin zone in magnetic fields up to 14 T. The critical wave vector of magnon spectrum truncation [Masuda et al., Phys. Rev. Lett. 96, 047210 (2006)] is found to shift from at to for . A drastic reduction of magnon bandwidths in the ordered phase [Garlea et al., Phys. Rev. Lett. 98, 167202 (2007)] is observed and studied in detail. New features of the spectrum, presumably related to this bandwidth collapse, are observed just above the transition field.
pacs:
75.10.Jm, 75.25.+z, 75.50.EeI Introduction
Recent years were marked by substantial progress in the study of gapped quantum-disordered antiferromagnets (AFs) in external magnetic fields. The most prominent common feature is the destruction of the non-magnetic spin liquid ground state and the emergence of a long-range AF ordered phase at some critical field . Such quantum phase transitions can often be viewed as a condensation of magnons. The Zeeman effect drives the energy of a particular gapped magnon to zero at the AF wave vector, whereupon they are macroscopically incorporated in the ground state. By now, the phenomenon has been observed and studied experimentally in numerous prototype materials. In spin systems with relevant magnetic anisotropy, such the Haldane spin chain compound NDMAP,Honda et al. (1997); Zheludev et al. (2003, 2004) the model bond-alternating chain NTENP,Narumi et al. (2001); Hagiwara et al. (2005) or the spin-dimer system Cs3Cr2Br9,Grenier et al. (2004); Ziman et al. (2005) the transition is of an Ising universality class,Affleck (1991) and the high-field ordered phase is gapped. More recent work focused on materials described by Heisenberg or XY (axially symmetric) Hamiltonians: 3D-interacting dimers in TlCuCl3,Ruegg et al. (2003) the quasi-2D network PHCC,Stone et al. (2006), the square lattice bilayer BaCu2Si2O,Sebastian et al. (2005) and the material NiCl2-4SC(NH2)2.Zapf et al. (2006) Here the transition can be viewed as a Bose-Einstein Condensation (BEC) of magnons,Giamarchi and Tsvelik (1999) despite the ongoing controversy regarding such a nomenclature.Mills (2007) Correspondingly, the high field ordered phase remains gapless.
In all the diverse cases, due to the soft-mode nature of the phase transition, the key to the underlying physics is in understanding the spin excitations on either side of the phase boundary. Until recently, of the more isotropic materials, only in TlCuCl3 has the spectrum been studied in sufficient detail. Unfortunately, recent data indicates that the transition in this compound is actually not BEC, and that the high field spectrum is gapped, due to Dzyaloshinski-Moriya type anisotropySirker et al. (2005) and magnetoelastic effects.Johannsen et al. (2005) In a recent short paper we reported neutron scattering studied of magnetic excitations in the spin ladder IPA-CuCl3, where the transition is an almost exact realization the BEC case.Garlea et al. (2007) In fact, any long-range properties, such the emergence of a gapless collective Goldstone mode beyond the transition point, appear to be fully consistent with original model of Giamarchi and Tsvelik.Giamarchi and Tsvelik (1999) Interestingly, the transition was also found to dramatically affect short-range spin correlations and excitations near the magnetic zone boundary. This phenomenon was attributed to AF long-range order violating discrete translational symmetry. Such a spontaneous symmetry breaking is absent in either the conventional BEC, or in magnon condensation transitions in NTENP, TlCuCl3 and many other spin gap systems.
The present paper is a report on extensive high-field neutron scattering studies of IPA-CuCl3. In addition to providing more details on the previous experiments and data analysis procedures, we focus on a number of new results. Among these are a study of polarizations of magnetic excitations, observation of certain unusual features of the spectrum just beyond the transition point, a study of the effect of long-range ordering on single-magnon spectrum termination,Masuda et al. (2006) and a measurement of magnon dispersion at the highest attainable field of 14.5 T.
IPA-CuCl3 crystallizes in a triclinic space group with Å, Å, Å, , , and .Manaka et al. (1997) As discussed in detail in Ref. Masuda et al., 2006, the key features of the structure are ladders of Cu2+ ions that run along the crystallographic axis, and approximately parallel to the plane. Spin correlations are ferromagnetic on the ladder rung, but antiferromagnetic along the legs. The thus-formed effective chain has a Haldane gapHal of meV,Manaka et al. (1997); Masuda et al. (2006) seen at the 1D AF zone-center , where is integer. Due to weak interactions between ladders in the plane, the gap varies between meV at (global dispersion minimum) and meV at . Interactions between ladders along the axis are negligible, due to entirely non-magnetic sheets of organic molecules in-between. At low temperatures IPA-CuCl3 goes through a field-induced AF ordering that manifests itself in a lambda specific heat anomaly and the appearance of non-zero uniform magnetization.Manaka et al. (1998) The transition occurs at T, T and T, in fields applied along the crystallographic , and axes, respectively. This anisotropy effect is fully accounted for by the anisotropy of the -tensor for Cu2+ in this system: and .Manaka et al. (1998); Manaka2007
II Experimental
In this work we summarize the results of several separate series of neutron scattering experiments on deuterated single-crystal IPA-CuCl3 samples. Measurements on the SPINS cold-neutron spectrometer at the NIST Center for Neutron Research (NCNR) were performed on an assembly of 20 single crystals of total mass 3g, mounted with the crystallographic axis vertical, and the reciprocal space plane accessible for measurements (Setup I). The mosaic of the assembly was somewhat irregular, with a FWHM of 4.5∘. Scattered neutrons were analyzed at 3.7 meV by a pyrolitic graphite PG analyzer in horizontal monochromatic-focusing mode, used in combination with a BeO filter. A 120’ radial collimator was installed between sample and analyzer. A magnetic field of up to 11.5 T was applied along the axis. A dilution refrigerator maintained sample temperature at 100 mK. In Setup II the sample was mounted with the axis vertical (along the applied field) and the plane open to scattering. An 80’ collimation was used in front of the sample, and only 5 out of 11 analyzer blades were focused on the detector. Experiments in Setup III were performed at the V2-FLEX 3-axis spectrometer at HMI. A smaller crystal assembly of approximate mass 1 g was mounted with the axis vertical in a 14.5 T magnet. The data were collected at 70 mK, with no dedicated collimation devices in the neutron beam, a PG filter after the sample, and a focusing PG (002) analyzer tuned to 3.7 meV. A 15 Tesla magnet was used in Setup IV, where the data were taken at mK on a 3g sample mounted with the -axis vertical on the IN-14 cold-neutron 3-axis spectrometer at ILL. Sample mosaic was about 4∘ FWHM. Scattered neutrons were analyzed at 2.9 meV by a focusing PG (002) analyzer with a Be filter. A 60’ beam collimator was used in front of the sample.
In addition to these 3-axis data, the discussion below will involve time-of-flight (TOF) spectra previously collected using the Disk Chopper Spectrometer at NIST (Fig. 1 of Ref. Garlea et al., 2007). The sample in this experimental Setup V was mounted with the axis vertical, parallel to the applied field. Incident neutron energy was fixed at 6.7 meV. Finally, diffraction data were taken on the D23 lifting counter diffractometer, at ILL, using a monochromatic beam with (Setup VI). The measurements were carried out on a 3.2 x 2.3 x 8.5 mm3 deuterated single crystal specimen. For this experiment we used a 12 T vertical field superconducting magnet with a dilution insert.
III Results
III.1 Field-induced AF long range order
III.1.1 Order parameter and phase diagram
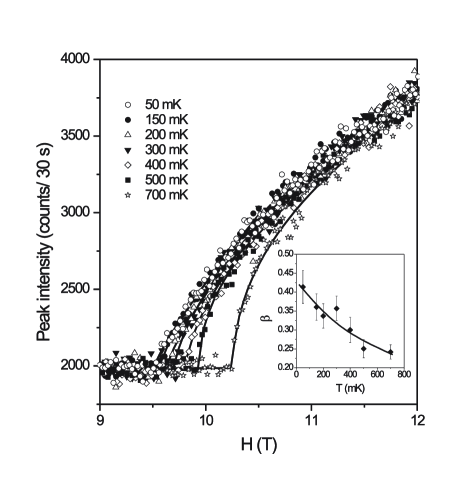
The main manifestation of the field-induced transition in IPA-CuCl3 is the onset of commensurate transverse long-range AF order. The high-field ordered phase is characterized by new Bragg reflections of type , with , and -integers.Garlea et al. (2007). The magnetic structure at T applied along the direction was determined from 48 independent Bragg intensities measured using Setup VI. The AF ordered moment of was found to be oriented almost parallel to the crystallographic direction. As expected, the two spins on each ladder rung are parallel to each other. The field dependencies of the peak intensity measured at several temperatures are shown in the main panel of Fig. 1 (symbols). The order parameter critical index is defined as , where is the ordered AF staggered moment, and the magnetic Bragg intensity scales as . In Ref. Garlea et al., 2007 we demonstrated that power law fits over a progressively shrinking field range at mK yield close to . In the present work, power-law fits were performed over a fixed field range of 1 T above at each temperature, and are plotted in solid lines in Fig. 1. The inset shows the thus measured temperature evolution of . This critical exponent rapidly decreases upon heating, approaching the value at elevated temperatures. It appears that with both the fitting range and temperature approaching zero, will indeed approach the Mean Field value of , as expected for a BEC-type transition.Giamarchi and Tsvelik (1999); Matsumoto et al. (2002)
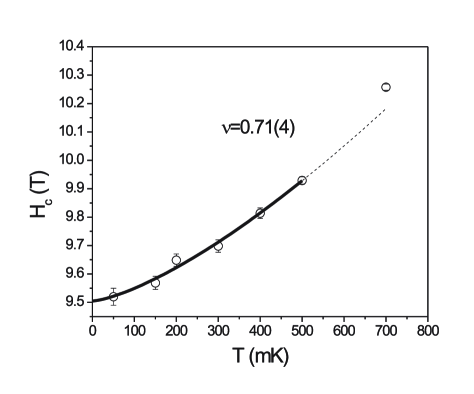
Another characteristic of the phase transition is the critical index , defined as . The measured temperature dependence of the transition field is shown in Fig. 2. A power law fit to this experimental phase boundary gives . This value is close to expected for a 3D BEC of magnons,Giamarchi and Tsvelik (1999) but should be regarded with some caution. Indeed, the density of data points available at is barely sufficient for an accurate estimate.
III.2 Model dynamic structure factor
Before discussing the results of inelastic measurements, we shall introduce an analytical model magnetic neutron scattering cross section for IPA-CuCl3 for use in the data analysis. A simple formula that accurately describes the dispersion of the degenerate magnon triplet at was discussed in Ref. Masuda et al., 2006:
| (1) | |||||
The parameters were previously determined experimentally: meV, meV and meV. Equation 1 follows the structural periodicity of the spin ladder: wave vectors with -integer and - half-integer are not, in general, equivalent. For AF spin correlations is the 1D zone-center, while the zone boundary is located at or . Apart from the gap , an important parameter is the velocity, that we defined as
| (2) | |||||
In an external field the triplet spectrum is split due to Zeeman effect. For the dispersion relation for the -th magnon branch with a field-dependent gap can be written as:
| (3) |
Here we assume that the field only induces an overall energy shift, without affecting the shape of the dispersion curve. Such behavior is indeed consistent with experiment (see below), and reflects the fact that the Zeeman term commutes with the Heisenberg spin Hamiltonian.
The dynamic neutron cross section for each mode was written as:
| (4) |
Here is the magnetic form factor for Cu2+ and is the overall intensity of mode . The latter implicitly includes the mode’s structure factor , the polarization factors for magnetic scattering of unpolarized neutrons, as well as the appropriate components of the -tensor. The parameters of the model are the gap energies and, at each given wave vector, the intensities for each magnon branch.
Equation 4 was also used to describe excitations in the high field phase. However, due to the onset of AF long-range order that doubles the structural period, at and become equivalent wave vectors, and the 1D zone-boundary is shifted to or . In this regime the dispersion relation for the -th branch was written as:
| (5) |
The parameters are the gap energies , velocities , and, at any given wave vector, the intensities of each mode.
III.3 Spin hydrodynamics
Inelastic data collected near the 1D AF zone-centers defined by half-integer values of provide information on the field dependence of the gap energies and the polarizations of excitations.
III.3.1 Gap energies
A representative raw constant- scan measured at the 1D AF zone-center using Setup III at T is plotted in Fig. 3 in solid symbols. The background was measured at several fields as an average of scans at and . Since no field dependence of the background was detected, it was further averaged to include all experimental fields (open symbols in Fig. 3) and fit to a Gaussian centered at zero energy transfer plus a constant (solid line). The resulting function was then subtracted from all scans measured at the particular wave vector transfer. A similar procedure was applied to constant- data at other wave vectors, or to those collected using most other experimental setups.
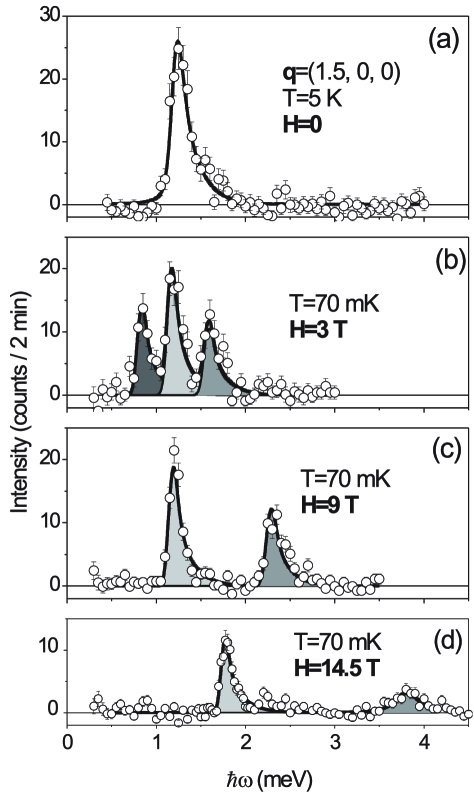
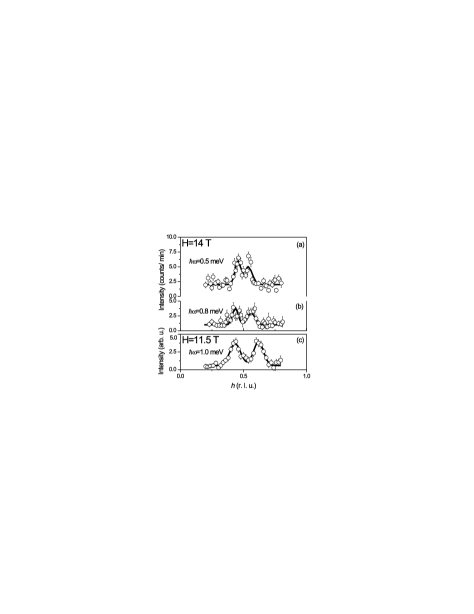
Background-subtracted scans collected at using Setup III at various fields applied along the axis are shown in Fig. 4(a–d). As expected, the single peak seen at splits into three components at higher fields. The gap in the lower-energy mode extrapolates to zero at T. Close to and above the critical field only two of the three peaks remain visible. In contrast with the previously studied anisotropic Haldane gap compound NDMAP, the gap in the lower-energy mode does not re-open above .

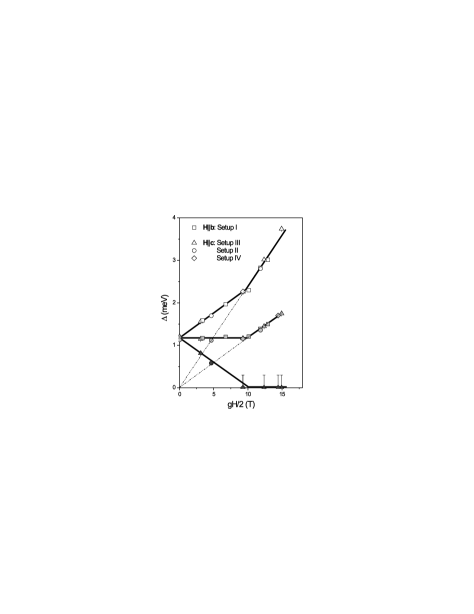
Very similar data at equivalent wave vectors were collected using Setup I for , and for using Setup II (Fig. 5) and Setup IV. In all cases, individual scans were analyzed using the model cross section described in the previous section. Eq. 4 was numerically convoluted with the 4-dimensional resolution function of the 3-axis spectrometer, calculated in the Popovici approximation. At , Eq. 5 was utilized whenever the entire dispersion relation of each mode was measured, and thus both and could be independently determined (see below). In cases where the data collection was restricted to the 1D AF zone-center, Eq. 9 was utilized instead, and only the gap energies and intensities were varied. For Eq. 9 was used in all cases. Typical fits are shown in solid lines in Figs. 4 and 5. In Fig. 4 the shaded areas represent partial contribution of each of the three members of the magnon triplet. The field dependencies of gap energies deduced from fits to the data collected using all experimental conditions are summarized in Fig. 6. In order to compensate for the -tensor anisotropy, the abscissa in actually shows the reduced field value .
III.3.2 Goldstone mode
As mentioned above, at the gap in the lower mode in IPA-CuCl3 does not re-open. However, this does not mean that the excitation itself disappears as, for instance, in the dimerized chain system NTENP.Hagiwara et al. (2005); Regnault2006 In IPA-CuCl3 the lower mode persists above the critical field, but remains gapless, to within experimental resolution. As discussed in Ref. Garlea et al., 2007, this excitation becomes the Goldstone mode associated with the spontaneous breaking of rotational symmetry due to magnetic ordering. It is best observed in -scans at low energy transfers, as shown in Fig. 7. Here panels (a) and (b) display 3-axis data collected using Setup IV. The solid lines are fits using Eq. 5 with , and assuming a constant background. Figure 7(c) shows a cut through the TOF data of setup V taken between 0.8 meV and 1.2 meV energy transfer. The solid lines are empyrical Gaussian fits. From this analysis we obtain the spin wave velocities of the Goldstone mode meV and meV, for T and T applied along the axis, respectively.
III.3.3 Intensities and polarizations of excitations
Since magnetic interactions along the crystallographic axis are totally negligible, all wave vectors with the same values of and can be considered equivalent. In other words, the -dependence of magnetic scattering is fully decoupled from the energy dependence. Polarization information can be deduced from a comparison of constant- scans collected at different yet equivalent wave vectors, thanks to neutrons being only scattered by fluctuations of spin components perpendicular to the momentum transfer.
To take advantage of this selectivity, we compared scans collected at three equivalent 1D zone-centers, separated by roughly in reciprocal space. In Setups I and III the data were taken at (Fig. 4), to complement the scans measured with Setup II at and (Fig. 5). These wave vectors form angles of , , and with the crystallographic axis, respectively. Experimentally, for all geometries, the intensity of all gapped magnons remains constant as long as , but decreases above the transition field. The intensity of the central magnon branch, deduced from model cross section fits to constant- scans, is plotted against field in Fig. 8(a). The data were normalized to the intensity of the single inelastic peak seen at .
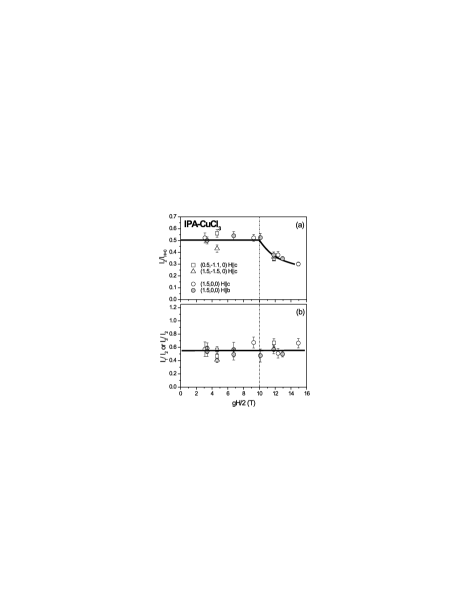
To within experimental statistics, the measured intensities of all visible gapped magnons remain proportionate at all three wave vectors in all fields. The corresponding intensity ratios are plotted in Fig. 8(b). In all cases the central mode remains roughly twice as strong the upper and lower ones, and half as strong as the unresolved triplet peak at . For this qualitative picture is consistent with expectations. Indeed, the central mode is linearly polarized along the direction of applied field (-axis). It contributes equally to scattering at all wave vectors in the scattering plane. The upper and lower modes are expected to have circular polarization with . The contribution of each one is evenly split between and . If is chosen along the scattering vector, only the contribution is detected, resulting in a two-fold reduction of intensity compared to linear polarization. A ratio of slightly larger than is due to the anisotropy of the -tensor in IPA-CuCl3. The magnetic neutron cross section for a given spin polarization is proportional to the square of the corresponding -factor, which accounts for an enhancement of scattering in the plane. A somewhat surprising experimental result is that the intensity ratio of the upper and central modes remains unchanged in the BEC phase. This behavior suggests that in experimentally accessible field, even at where rotational symmetry around the axis broken by long range ordering, the intermixing of states with different polarization is not particularly large.
III.4 Spin dynamics away from the zone-center
III.4.1 Magnon dispersion curves
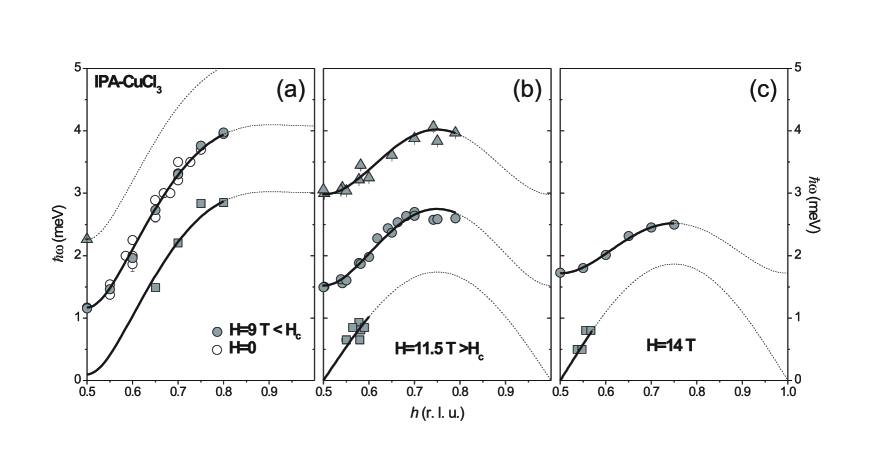
The dispersion of magnons across the Brilloin zone was measured in a series of constant- scans. The data were taken at T, T and T using Setups IV and V. Due to geometric limitations on accessible energy transfers at different wave vectors, the dispersion relation of only the middle and lower modes were measured in 3-axis experiments. These data were analyzed using the model cross section described previously. A semi-global fitting approach was implemented. Separate intensity prefactors were used for each individual scan, but the same dispersion relation was applied to all scans simultaneously at each field. The results of these fits is shown in solid lines in Fig. 9(a,c). Symbols represent fits to individual scans. In Fig. 9(a) open symbols are data from Ref. Masuda et al., 2006, collected at . For Fig. 9(b), constant- cutouts from the 2-dimensional TOF data were fit to Gaussian profiles. The resulting dispersion relation (symbols) was then analyzed using Eq. 5 (solid lines). The key parameters of the fits are summarized in Table 1. In all panels, a transition to dotted lines indicate that either the area is outside the experimental scan range or that no identifiable magnon peak was detected.
| T | T | T | |
|---|---|---|---|
| 0.10(8) meV | 0 (fixed) | 0 (fixed) | |
| 1.17 meV (fixed) | 1.52(5) meV | 1.72(2) meV | |
| 2.26(2) meV | 2.98(2) meV | – | |
| 2.9 meV (fixed) | 1.74(3) meV | 1.86(2) meV | |
| 2.9 meV (fixed) | 2.29(6) meV | 1.84(3) meV | |
| 2.9 meV (fixed) | 2.67(4) meV | – |
III.4.2 Spectrum termination
One of the main findings of Ref. Masuda et al., 2006 was the discovery of an abrupt truncation of the magnon branch in IPA-CuCl3 at a critical wave vector , . This phenomenon was attributed to 2-magnon decay, in analogy with 2-particle decay of rotons in liquid 4He. Similar physics was observed in the quasi-2D system PHCC.M. B. Stone (2006) Further theoretical studiesZhitomirsky (2006); Kolezhuk and Sachdev (2006) showed that in one dimension the effect of 2-particle decay is particularly dramatic, and always leads to a total removal of the single-particle pole from the wave vector-energy domain of the 2-particle continuum. One of the goals of the present work was to learn how the spectrum termination in IPA-CuCl3 is affected by an external magnetic field, particularly above .
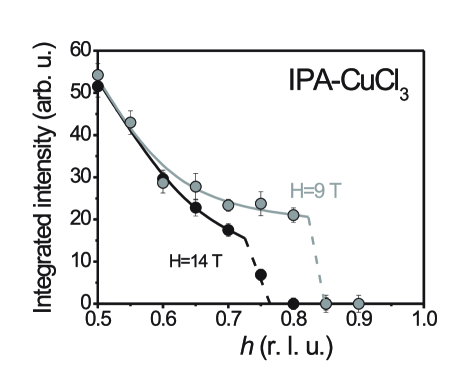
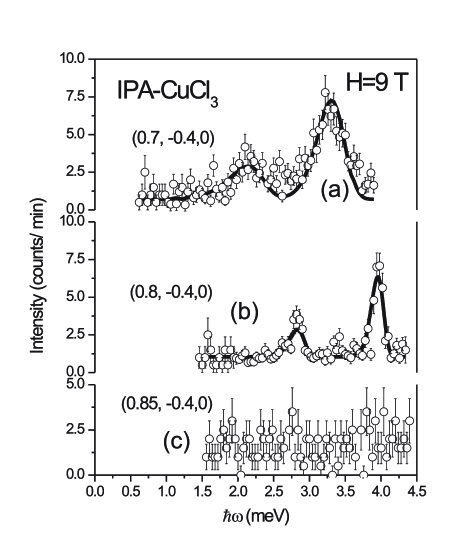
In Fig. 10 we show a series of raw constant- scans collected using Setup IV near the maximum of the measured dispersion, at T (just below the critical field). For , two peaks corresponding to the middle and lower magnon branches are clearly visible (Fig. 10a,b). The 3rd magnon is outside the scan range. The solid lines are fits using the model cross section given by Eqs. 4 and 9, convoluted with the spectrometer resolution. Both magnon peaks abruptly vanish at , as shown in Fig. 10c. This behavior is quantified by the plot of the fitted intensity of the middle magnon branch, corrected for the magnetic form factor, against in Fig. 11 (grey symbols). We conclude that at T the spectrum termination is exactly the same as in zero field. Indeed, the trends visualized in Figure 10 are very similar to those shown for in Fig. 2(c,d) of Ref. Masuda et al., 2006.
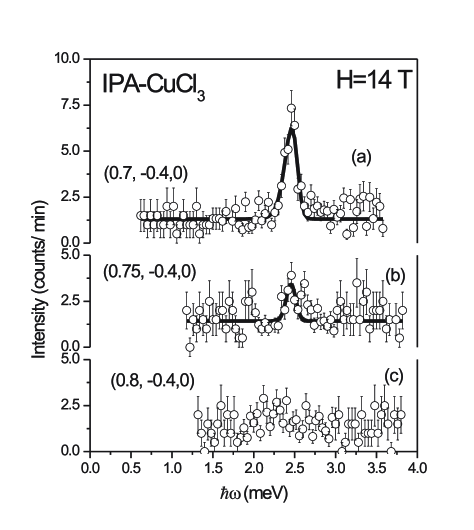
The spectrum termination picture abruptly changes above the critical field. Figure 12 shows the -dependence of constant- scans collected at T using Setup IV. Only the “middle” branch of magnons is visible, but does not extend beyond , , which in the high field phase is the new 1D magnetic zone boundary. The corresponding -dependence of integrated magnon intensity is shown in Fig. 11 in solid circles.
In Fig. 12a, note that at the observed peak is much narrower than those seen at T (Fig. 10a). This, is entirely an effect of experimental wave vector resolution. All observed width are in fact instrumental at all fields. The narrow peak at T is due to that is close to the new zone-boundary, so that the local slope of the dispersion curve is shallow (Eq. 5). In contrast, at , is still far from where the dispersion levels out, and the local slope is steep (Eq. 9). A steep slope leads to a broader peak, due to poor wave vector resolution, and a relatively good energy resolution. Similar arguments explain why at T at (Fig. 10b) the magnons appear narrower than and .
III.4.3 Bandwidth collapse
A very important result reported in Ref. Garlea et al., 2007 is the drastic reduction of the bandwidth of the middle (and, probably, top) magnon branch at high fields. From Fig. 9a we see that there is practically no change in the dispersion of the middle magnon branch between and T, which means that the bandwidth collapse occurs only at . The bandwidth continues to decrease in the entire accessible field range in the high-field state, from 2.9 meV at T to as little at 0.8 meV at T.
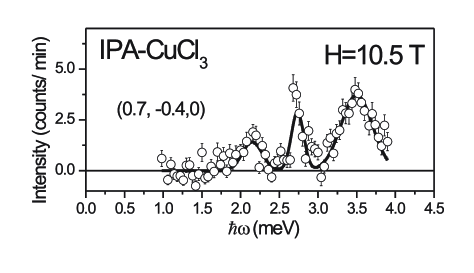
A surprising finding is that between and T the change of the spectrum of the central magnon is not continuous. In fact, there appears to be a field range in which large-bandwidth and low-bandwidth “versions” of the middle excitation branch co-exist. This is illustrated by Fig. 13 that shows a scan taken at in an T external field. There clearly are three peaks in this scan. The two broad peaks can be associated with the two highly dispersive magnons seen below at T (Fig. 10a). At the same time, the sharp peak resembles that corresponding to the middle mode at higher fields (Fig. 12a).
The two versions of the middle magnon branch apparently coexist even at T, though the highly dispersive component is considerably weakened. This can be inferred from the false color plot of the TOF data in Fig. 1 of Ref. Garlea et al., 2007, where a portion of the middle mode seems to continue all the way to 4 meV as , even as a stronger component levels off at 2.7 meV. Due to poor experimental resolution, low intensity, and a clear dominance of the narrow-bandwidth component, it is not possible to clearly identify the more dispersive component in constant- cut-outs at this field. At T this excitation seems to have totally disappeared, and only the narrow-bandwidth component is detected.
IV Discussion
The behavior of spin correlations in IPA-CuCl3 under field can be summarized as follows.
1) At the system remains non-magnetic. All the way to the critical field the three lower-energy magnon branches are exact replicas of the degenerate magnon at , but are shifted in energy due to Zeeman effect, according to the spin projection that they carry: . This behavior is fully consistent with the Zeeman term commuting with the Heisenberg Hamiltonian, and the ground state being an singlet.
2) To within experimental accuracy, the critical properties of the transition at and are those of BEC in a dilute Bose gas. This is exactly what theory predicts in the case of ideal axially symmetry.Giamarchi and Tsvelik (1999); Matsumoto et al. (2002) As the softening magnons condense in the ground state at , the initial rotational symmetry of the system is spontaneously broken by the emerging AF long range order. This process is fully equivalent to the formation of a conventional Bose-Einstein condensate, where it is the gauge symmetry that is being spontaneously violated by the macroscopic phase of the condensate’s wavefunction. In our case, at the density of magnons is strictly zero for , and vanishingly small just above the transition. The phenomenon is then accurately described in the limit of negligible quasiparticle interactions. Deviations from this model become apparent with increasing temperature, due to a thermal excitation of magnons and a finite magnon density at the transition point. Experimentally, this thermal effect is particularly strong for the order-parameter critical index that decreases rapidly with temperature.
3) The BEC nature for the phase transition is consistent with the observed behavior of long-wavelength excitations near the AF point at . The lower of the three magnons becomes the Goldstone mode, associated with the symmetry breaking. To within experimental resolution it remains gapless at all fields above . The intensity of this mode is decreased significantly compared to that below the transition field. At the gap in the middle magnon branch begins to increase linearly. Simultaneously, the rate of increase for the gap in the upper mode doubles. The intensities of both the middle and upper modes are suppressed with increasing field, while the velocities of all three excitation branches progressively decrease.
This behavior is similar to that of other gapped quantum magnets undergoing field-induced ordering transitions, such as the dimer compound TlCuCl3, Ruegg et al. (2003) the material Cs3Cr2Br9,Grenier et al. (2004) or the Haldane spin chain system NDMAP.Zheludev et al. (2003, 2004) The key difference, of course, is that in those systems where magnetic anisotropy is present, the transition is of an Ising, rather than BEC universality class, and the lower mode re-acquires a gap in the ordered phase.Affleck (1991) Field-theoretical descriptions of gapped spin chainsAffleck (1990, 1991), as well as a bond-operator treatment of the coupled-dimer model,Matsumoto et al. (2002) attribute the changes of magnon gaps and velocities to an admixture of the higher-energy triplet modes to the ground state. This interpretation can be extended to our case of coupled spin ladders. In particular, at rotational symmetry is broken by the staggered moment, and ceases to be a good quantum number for quasiparticles. The polarizations of all magnon branches must become mixed. The Goldstone mode is thus distinct from the magnon at , just as the two gap modes above the condensate can no longer be identified with and quasiparticles at low fields. For the accessible range of magnetic fields, this polarization mixing in IPA-CuCl3 can not be too strong though, as it was not directly detected in our polarization studies. This is undoubtedly due to the fact that even at T the ordered moment is still far from its saturation value. On the other hand, the method used is, admittedly, not the most accurate one: small shifts in polarization will be easier to detect in future polarized neutron experiments.
4) Short wave length spin dynamics of IPA-CuCl3 at is rather complex. The Goldstone mode is not visible at higher energy transfers, away from the zone-center, presumably due to its low intensity. The middle magnon branch is actually replaced by two excitations that merge at the zone-center, but are distinct near the zone-boundary. One of these retains the steep dispersion relation seen at . This component progressively weakens with increasing field and practically vanishes at T. Simultaneously, the 2nd component gains in intensity. It has a much shallower dispersion, and entirely dominates at high fields. The bandwidth of this component progressively decreases with increasing : the gap at the zone-center increase, and zone-boundary energy goes down. The limited data that has been accumulated on the 3rd (highest-energy) magnon branch suggest that it’s behavior is similar to that of the middle mode.
In our previous brief report the drastic restructuring of the excitation spectrum above was attributed to a spontaneous breaking of a discrete microscopic symmetry at the transition point.Garlea et al. (2007) Unlike in a conventional BEC transition that breaks a continuous symmetry, the transition in IPA-CuCl3 in addition to that doubles the magnetic structural period. The result is a folding of the Brillouin zone and an opening of anticrossing gaps at the new zone boundaries (, , and equivalent positions), where each branch interacts with its own replica from an adjacent zone. This, in turn, leads to an abrupt reduction of the zone-boundary energy for the visible (lower) segments of the gapped magnons. The additional breaking of translational symmetry is not an inherent property of all magnon condensation transition, but specific to IPA-CuCl3 and select other systems. For example, in the dimer material TlCuCl3 the periodicity of the magnetically ordered state is the same as that of the underlying crystal lattice.Ruegg et al. (2003) Correspondingly, the changes in the excitation spectrum at the transition pointMatsumoto et al. (2002) are continuous and much less drastic than in IPA-CuCl3.
The doubling of the ground state’s translational periodicity is also the primary cause for the shift of the critical wave vector of spectrum termination at . As discussed in detail in Ref. Masuda et al., 2006, at the magnon branch is truncated at a point beyond which two-particle decay becomes allowed by energy and momentum conservation. The particular shape of the magnon dispersion curve in IPA-CuCl3 is such that the critical wave vector is . Even though the magnon energies shift at , the termination point for each branch remains unchanged in that regime. Due to conservation of spin projection, the magnon, for example, can only decay into quasiparticles with and . Since both the initial and final states are eigenstates of the Zeeman term, none of the matrix elements are affected by the applied field. Moreover, the Zeeman shifts for the decay products are opposite and fully cancel each other, so any energy and momentum conservation requirements remain as at . Similarly, below the field has no effect on the decay of the particles.
This picture has to change qualitatively at . The breaking of rotational symmetry in the ground state removes the conservation requirement. It is easy to see that in this case 2-particle decay becomes possible at any wave vector beyond the new zone-boundary , so that . The final state is a combination of the same type of magnon with a smaller wave vector, and a Goldstone mode.
Certain important details regarding the short wavelength spin dynamics of IPA-CuCl3 above the critical field are currently not understood. In particular, we have no obvious explanation for the apparent co-existence of wide- and narrow-bandwidth magnons just above . Further theoretical studies of the problem are clearly in order.
V Conclusion
To date, most studies of field-induced ordering transitions in quantum magnets were focused on long wave length spin correlations. Indeed, these properties are directly relevant to the phase transition itself. However, it appears that a lot is to be learned and understood about short wavelength spin correlations as well. This is particularly true when field-induced BEC of magnons is accompanied by a breaking of discrete translational symmetry, as in IPA-CuCl3.
Acknowledgements.
Research at ORNL was funded by the United States Department of Energy, Office of Basic Energy Sciences- Materials Science, under Contract No. DE-AC05-00OR22725 with UT-Battelle, LLC. T. M. was partially supported by the US - Japan Cooperative Research Program on Neutron Scattering between the US DOE and Japanese MEXT. The work at NIST is supported by the National Science Foundation under Agreement Nos. DMR-9986442, -0086210, and -0454672.References
- Honda et al. (1997) Z. Honda, K. Katsumata, H. A. Katori, K. Yamada, T. Ohishi, T. Manabe, and M. Yamashita, J. Phys.: Condens. Matter 9, 3487 (1997).
- Zheludev et al. (2003) A. Zheludev, Z. Honda, C. Broholm, K. Katsumata, S. M. Shapiro, A. Kolezhuk, S. Park, and Y. Qiu, Phys. Rev. B 68, 134438 (2003).
- Zheludev et al. (2004) A. Zheludev, S. M. Shapiro, Z. Honda, K. Katsumata, B. Grenier, E. Ressouche, L.-P. Regnault, Y. Chen, P. Vorderwisch, H.-J. Mikeska, et al., Phys. Rev. B 69, 054414 (2004).
- Narumi et al. (2001) Y. Narumi, M. Hagiwara, M. Kohno, and K. Kindo, Phys. Rev. Lett. 86, 324 (2001).
- Hagiwara et al. (2005) M. Hagiwara, L. P. Regnault, A. Zheludev, A. Stunault, N. Metoki, T. Suzuki, S. Suga, K. Kakurai, Y. Koike, P. Vorderwisch, et al., Phys. Rev. Lett. 94, 177202 (2005).
- (6) L.-P. Regnault, A. Zheludev, M. Hagiwara and A. Stunault, Phys. Rev. B 73, 174431 (2006).
- Grenier et al. (2004) B. Grenier, Y. Inagaki, L. Regnault, A. Wildes, T. Asano, Y. Ajiro, E. Lhotel, C. Paulsen, T. Ziman, and J. Boucher, Phys. Rev. Lett. 92, 177202 (2004).
- Ziman et al. (2005) T. Ziman, J. P. Boucher, Y. Inagaki, and Y. Ajiro, J. Phys. Soc. Jpn. 74 Suppl., 119 (2005).
- Affleck (1991) I. Affleck, Phys. Rev. B 43, 3215 (1991).
- Ruegg et al. (2003) C. Ruegg, N. Cavadini, A. Furrer, H.-U. Gudel, K. Kramer, H. Mutka, A. Wildes, K. Habicht, and P. Vorderwisch, Nature 423, 62 (2003).
- Stone et al. (2006) M. B. Stone, C. Broholm, D. H. Reich, O. Tchernyshev, P. Vorderwisch, and N. Harrison, Phys. Rev. Lett. 96, 257203 (2006).
- Sebastian et al. (2005) S. E. Sebastian, P. A. Sharma, M. Jaime, N. Harrison, V. Correa, L. Balicas, N. Kawashima, C. D. Batista, and I. R. Fisher, Phys. Rev. B 72, 100404(R) (2005).
- Zapf et al. (2006) V. S. Zapf, D. Zocco, B. R. Hansen, M. Jaime, C. D. Batista, M. Kenzelmann, C. Niedermayer, A. Lacerda, and A. Paduan-Filho, Phys. Rev. Lett. 96, 077204 (2006).
- Giamarchi and Tsvelik (1999) T. Giamarchi and A. M. Tsvelik, Phys. Rev. B 59, 11398 (1999).
- Mills (2007) D. L. Mills, Phys. Rev. Lett. 98, 039701 (2007).
- Sirker et al. (2005) J. Sirker, A. Wei e, and O. P. Sushkov, J. Phys. Soc. Jpn. 74 Suppl., 129 (2005).
- Johannsen et al. (2005) N. Johannsen, A. Vasiliev, A. Oosawa, H. Tanaka, , and T. Lorenz, Phys. Rev. Lett. 95, 017205 (2005).
- Garlea et al. (2007) V. O. Garlea, A. Zheludev, T. Masuda, H. Manaka, L.-P. Regnault, E. Ressouche, B. Grenier, J.-H. Chung, Y. Qiu, K. Habicht, et al., Phys. Rev. Lett. 98, 167202 (2007).
- Masuda et al. (2006) T. Masuda, A. Zheludev, H. Manaka, L.-P. Regnault, J.-H. Chung, and Y. Qiu, Phys. Rev. Lett. 96, 047210 (2006).
- Manaka et al. (1997) H. Manaka, I. Yamada, and K. Yamaguchi, J. Phys. Soc. Jpn. 66, 564 (1997).
- (21) F. D. M. Haldane, Phys. Lett. 93A, 464 (1983); Phys. Rev. Lett. 50, 1153(1983).
- Manaka et al. (1998) H. Manaka, I. Yamada, Z. Honda, H. A. Katori, and K. Katsumata, J. Phys. Soc. Jpn. 67, 3913 (1998).
- (23) H. Manaka, K. Masamoto, and S. Maehata, J. Phys. Soc. Jpn. 76, 023002 (2007).
- Matsumoto et al. (2002) M. Matsumoto, B. Normand, T. M. Rice, and M. Sigrist, Phys. Rev. Lett. 89, 077203 (2002).
- M. B. Stone (2006) T. H. C. L. B. D. H. R. M. B. Stone, I. A. Zaliznyak, Nature 440, 190 (2006).
- Zhitomirsky (2006) M. Zhitomirsky, Phys. Rev. B 73, 100404 (2006).
- Kolezhuk and Sachdev (2006) A. Kolezhuk and S. Sachdev, Phys. Rev. Lett. 96, 087203 (2006).
- Affleck (1990) I. Affleck, Phys. Rev. B 41, 6697 (1990).