A Catalog of Absorption Lines in Eight HST/STIS E230M Quasar Spectra ††thanks: Based on observations obtained with the NASA/ESA Hubble Space Telescope, which is operated by the Space Telescope Science Institute (STScI) for the Association of Universities for Research in Astronomy, Inc., under NASA contract NAS5D26555.
Abstract
We have produced a catalog of line identifications and equivalent width measurements for all absorption features in eight ultraviolet echelle quasar spectra. These spectra were selected as having the highest signal-to-noise among the HST/STIS spectra obtained with the E230M grating. We identify 56 metal-line systems toward the eight quasars, and present plots of detected transitions, aligned in velocity-space. We found that about 1/4 - 1/3 of the features in the Ly forest region, redward of the incidence of the Ly forest, are metal lines. High ionization transitions are common. We see both O VI and C IV in 88 – 90% of the metal-line systems for which the spectra cover the expected wavelength. Si III is seen in 58%, while low ionization absorption in C II, Si II, and/or Al II is detected in 50% of the systems for which they are covered. This catalog will facilitate future studies of the Ly forest and of metal-line systems of various types.
keywords:
intergalactic medium – quasars: absorption lines.1 Introduction
The most important chemical transitions for quasar absorption line systems at low redshift (e.g., 1) still lay in the ultra-violet spectral range. A limited number of the most UV-bright quasars have been observed with the Hubble Space Telescope (HST)/ Space Telescope Imaging Spectrograph (STIS), which has provided a detailed view of absorption systems along the lines of sight. These data are available from the Multimission Archive at Space Telescope (MAST). However, in order to compile statistics of absorbers or to study particular systems, it is necessary to identify the spectral features. This can be complicated, particularly in the Ly forest region, and when the available spectral coverage is limited.
In the course of our studies of the Ly forest and metal-line systems we have studied in detail eight of the highest quality HST/STIS spectra, obtained with the E230M grating. In this paper we present these spectra with a list of absorption features and our suggested line identifications. In particular, metal-line system identifications are necessary in order to remove contaminants from the Ly forest. In a recent paper (Kirkman et al., 2007), we measured statistics of absorption in the Ly forest at using 74 low resolution HST/FOS quasar spectra. As a check, and particularly to assess our ability to separate metal lines from the forest, we also used the available higher resolution E230M HST/STIS spectra. In the present paper, we present the relevant data and line identifications which were used in that paper. We expect that this catalog will facilitate future studies of metal-line absorption systems as well as of the Ly forest.
Our catalog includes damped Ly absorbers (DLAs), Lyman limit systems, and Ly forest clouds. The DLA and Lyman limit systems are expected to have strong Mg II absorption (Rao & Turnshek, 2000; Churchill et al., 2000), while the Ly forest clouds may have weak Mg II and other low ionization transitions detected (such as Si II and C II) (Narayanan et al., 2005). Some Ly forest clouds have detected C IV and/or O VI, without associated low ionization absorption (Tripp et al., 2000; Savage et al., 2002; Milutinović et al., 2006). The catalog that we will present will allow for future studies of the various types of absorbers.
In § 2 we describe HST/STIS quasar spectra and our reduction and continuum fitting procedures. We also outline our line detection and measurement algorithms and line identification strategies. The normalized echelle spectra are presented in § 3, along with a brief description of metal-line systems detected toward each quasar. System plots, showing all detected transitions for each system, are also presented there. In § 4 we present a general summary of the systems presented in this catalog.
2 Data and Methods
We selected the eight quasars observed with the HST/STIS E230M grating which had a signal to noise ratio, , over a reasonable fraction of the spectrum. These HST/STIS E230M spectra have a resolution , with two pixels per resolution element. Our sample is biased towards quasars that have Lyman limit systems, since most of the STIS observations were conducted in order to study those particular known systems in detail.
Several settings are possible covering different wavelength ranges. For seven of the eight quasars in our sample, - Å is covered. The quasars and the relevant observational details are listed in Table 1. Specifically, this table lists quasar redshifts, wavelength coverage, per pixel at 2350 Å and 2750 Å, primary investigator for the original observation, and proposal ID.
The data were reduced using the STIS pipeline (Brown et al., 2002). They were combined by simple weighting by exposure time (as in Narayanan et al. (2005)), rather than by, e.g., inverse variance methods that are often employed. A bias could be introduced by the latter method, since pixels with smaller counts would be weighted more heavily. This bias is significant only in cases such as these STIS spectra, where individual exposures have very small , and is not typically important for reduction of ground-based high resolution echelle spectra.
Wavelengths were corrected to the heliocentric reference frame. When the same quasar was observed multiple times, there was often a small shift in wavelength between the spectra, due to the intentional shifting of the echelle angle of the instrument. In this case, we chose not to smooth the data by interpolating, but instead chose wavelength bins from one exposure and combined the flux from other exposures into the nearest bin. This results in a slightly decreased effective resolution. Continuum fits used the standard IRAF SFIT task.111IRAF is distributed by the National Optical Astronomy Observatories, which are operated by AURA, Inc., under contract to the National Science Foundation.
Features were objectively identified by searching for an unresolved line at each pixel (as employed in Schneider et al. (1993)), and applying a criterion for detection. However, we found by inspection that some of these formal detections are not likely to be real. In some cases, only 1 pixel had significant absorption, and in other cases it appeared that correlated noise biased the measurement. Features that are broad and shallow can be 5 and yet look unconvincing because they are sensitive to the continuum level. Such spurious features, estimated to be 10% of the total number of detections, were eliminated from consideration. We define a feature as all the pixels around a 5 detection that have not recover to the continuum after smoothing the spectra using an equation on p.56 of Schneider et al. (1993). This definition means that many features are clearly blends of well separated lines, and hence a feature can have more than one identification, each of which may be secure because they refer to different blended lines. Wavelength that we give for a feature is the flux-weighted central value, the mean of the wavelengths where the smoothed flux drops below the continuum, with weighting for the fraction of the photons that are absorbed at each pixel.
We attempted to identify all features in each of the quasar spectrum, and the transitions that were identified one or more times are listed with their vacuum wavelengths and oscillator strengths in Table 2. For our line identification we used the following procedure:
-
1.
Examine the spectrum at the expected positions of possible Galactic lines, and mark all possible detections.
-
2.
Search for the strong resonant doublet transitions: Mgii , Siiv , Civ , Nv , and Ovi . In addition to these, we also search for low ionization gas through the combination C II and Si II , which can be used in place of Mgii when the latter is not covered (Narayanan et al., 2005; Milutinović et al., 2006).
-
3.
Check positions of other transitions that could be detected for systems found through the doublet search, including the Lyman series lines. If a system is ambiguous with the doublet alone, Ly and other Lyman series lines were used to assess its reality.
-
4.
Having completed these steps, all features that remain without plausible identifications are considered to be Lyman series lines.
-
5.
Begin by assuming that the highest order Lyman series line is the correct identification and search for all of the stronger (lower order) Lyman series lines corresponding to the same redshift. If reasonable ratios are found, mark these as possible identifications. Otherwise continue assessing the possible identifications of the feature in question until reaching Ly.
-
6.
If no identification, including a Ly identification, is plausible the feature is left unidentified.
-
7.
If more than one identification is reasonable (or if there is likely to be a blend for which more than one system contributes significantly), this is noted.
3 Results
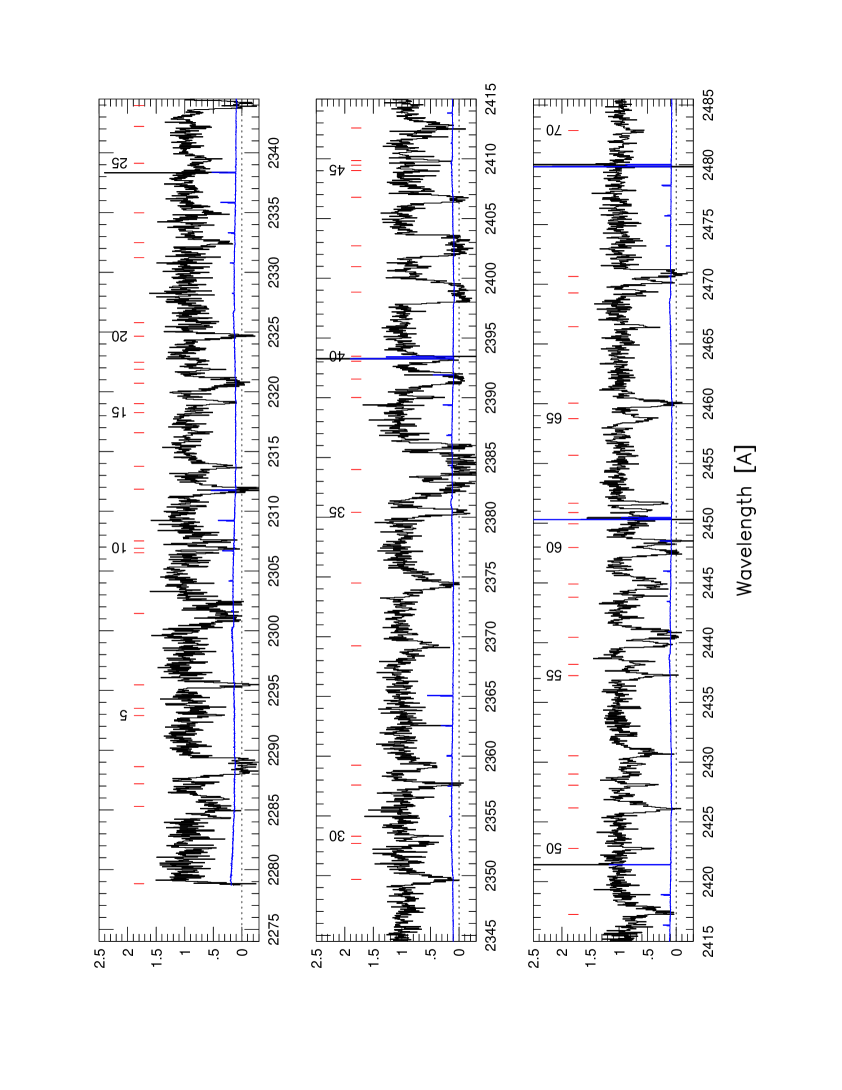
Figure 1a is a sample of a portion of the normalized spectrum of PG, shown in the printed version. We present all other normalized quasar spectra in Figures 1b–8d (see the complete version), which are available electronically at http://www.blackwellpublishing.com/products/. Similarly, our listings of line identifications are presented electronically in Table 3, with some sample listings appearing in the printed version. In this table, quasars are ordered by right ascension and features by increasing wavelength within a given quasar entry. In Table 3 we list, for each feature that we did not reject as unconvincing, the observed vacuum wavelength (), the observed frame equivalent width and error ( and ()), and the significance level (; observed equivalent width/ error in equivalent width). It also gives our favored line identification for each feature (transition and redshift) along with notes that indicate alternative and/or additional identifications. If the identification cannot be confirmed with another line, or is uncertain for some other reason, a ”?” is listed after the preferred transition ID. We do not give column densities since there are best done on a system by system basis using velocity plots to ensure that the columns for different ions are representative of the same gas.
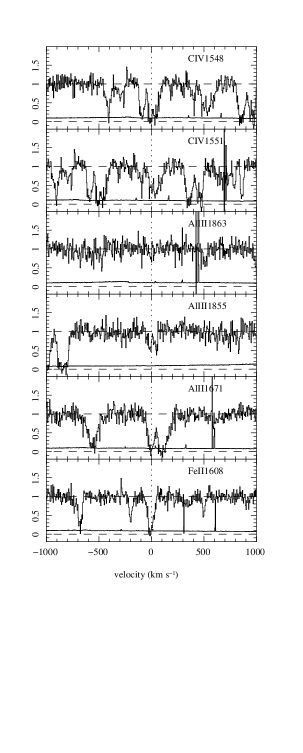
The following subsections present the eight quasars along with discussion of noteworthy metal-line systems found in their spectra. Figure 9 presents an example “system plot” for the system toward PG. The transitions detected at for all of the metal-line systems are plotted in velocity space in the electronic versions of Figures 9–64 (see the complete version). The quasar emission redshifts, taken from the NASA/IPAC Extragalactic Database, are listed in the heading of each subsection.
3.1 PG0117+213 ()
This quasar was studied as part of the Quasar Absorption Line Key Project, using G270H grating of HST/Faint Object Spectrograph (FOS), with resolution of =1300. Jannuzi et al. (1998) found possible metal-line systems at , 0.9400, 0.9676, 1.0724, 1.3389, 1.3426 and 1.3868. They also found tentative suggestions of metal-line systems at and 1.4952. Mg II is detected in a Keck/HIRES spectrum at , 0.7290, 1.0480, 1.3250 and 1.3430 (Churchill & Vogt, 2001; Churchill et al., 1999), and these five systems were modeled (including constraints from this STIS coverage) by Masiero et al. (2005).
Jannuzi et al. (1998) observed this quasar with HST/STIS to facilitate a statistical study of the Ly forest. This spectrum covers the Ly forest over almost all of its wavelength coverage, blueward of Å. The Ly line is covered blueward of Å, Ly blueward of Å, and Ly blueward of Å. There is also limited redshift coverage of higher order Lyman series lines. Along this line of sight are five Mg II absorbers. One of them is a DLA, two are strong Mg II absorbers, and the other two are multiple-cloud, weak Mg II absorbers. Three certain, and two possible O VI systems are also detected. The metal-line systems toward this quasar are plotted in Figures 9–18.
- z = 0.5764. —
-
The system is a strong Mg II absorber. Based upon only a low resolution HST/FOS spectrum, obtained in spectropolarimetry mode (Koratkar et al., 1998), it is not clear whether this is a DLA or whether it has multiple undamped components (Rao & Turnshek, 2000). In the HST/STIS spectrum, Civ are detected, but both transitions suffer from blending. The C IV is blended in its blue component with Ly from a system at . An unidentified blend appears on the red wing of C IV and its blueward component also has a small contribution from Si II at . Aliii is detected, but the blueward member has a blend to its blue, probably with Ly. Strong Al II is detected, as is Fe II . The strong feature redward of Al II is probably Ly at . In addition to Mg II and Mg I, Ca II and Ti II were detected in the Keck/HIRES spectrum (Masiero et al., 2005).
- z = 0.7290. —
-
The unusual multiple-cloud, weak Mg II absorber at is detected only in Al II and C II in the HST/STIS spectrum. Civ is covered at a high sensitivity, yet it is not detected to a rest-frame equivalent width limit of Å. This makes it “C IV–deficient”, possibly indicative of a low level of star formation so that a corona would be weak or absent in its very red, barred spiral galaxy host (Masiero et al., 2005).
- z = 1.0480. —
-
The system was found not to have metal lines detected in the low resolution HST/FOS spectrum. The detections of Si II, C II, Si III, Siiv in the HST/STIS spectrum are consistent with those limits. Unfortunately, the STIS spectrum does not cover Civ , which would provide useful constraints on the system’s physical conditions. Based upon photoionization modeling (Masiero et al., 2005) it would appear that there is a significant blend with Si III , which is most likely Ly.
- z = 1.3250. —
-
The system is just above the borderline to qualify as a strong Mg II absorber. It has six weak components in Mgii spread over km s-1 (Churchill & Vogt, 2001). There is a partial Lyman limit system detected in an HST/FOS spectrum (Jannuzi et al., 1998). In the HST/STIS spectrum Si II and C II are detected from the strongest four of these six components. Si III 1207 is also detected over the full velocity range, but it suffers from a blend with Galactic Mg II to the blue. There may also be blends redward of this, based upon the photoionization models (Masiero et al., 2005), but we were unable to provide identifications besides possible Ly. Unfortunately, Civ , which was detected in the HST/FOS spectrum (Jannuzi et al., 1998), is not covered in the STIS spectrum. There is a possible weak detection of N V 1239 but it cannot be confirmed using N V 1243 because it is in a noisy part of the spectrum. A strong Ovi is detected, but O VI is blended to the red with Ly from the system at , and to the blue with possible Ly. Also, O VI must have a blend, at least on the red wing of its strong component, since that profile is too strong relative to O VI at that velocity. This blend could be O VI from the system. If so, these systems would be “line-locked”.
- z = 1.3390. —
-
We find the evidence for metal lines in the system to be inconclusive. Ly is not detected in the redward portion range of the possible C III feature, so not all of that absorption can be C III at this redshift. Two components of Si III are possible, but they do not align perfectly with the minima of the C III profile and cannot be confirmed in any other way. Also, Ovi may be detected. The alignment is reasonably good, though the feature redward of the O VI component is likely to be O VI from the system at .
- z = 1.3430. —
-
The system is also just at the border between strong and multiple-cloud weak Mg II absorption. Like the system, it has a partial Lyman limit break in the HST/FOS spectrum (Jannuzi et al., 1998). Ly and Ly are detected in the HST/STIS spectrum along with C II, Si II, N II, C III. There is a feature at the expected position of N III , which appears to be too strong relative to the other transitions in this system (Masiero et al., 2005). We believe this feature could be Ly at . C IV is not covered in the STIS spectrum, but strong C IV absorption is detected in the FOS spectrum. Nv appears to be detected, but the N V transition is blended, probably with Ly at .
- z = 1.4242. —
-
There is an O VI system, with detected Ly, Ly, and Ly at .
- z = 1.4463. —
-
Another weak, broad O VI doublet at is also detected in C III and Si III, as well as in Ly. The feature in the Si III panel, at km s-1, is at least partially Si II at (as is the stronger feature to its red).
- z = 1.4478. —
-
At the Lyman series is detected down to Ly, which is the last member covered in the HST/STIS spectrum. There is a possible O VI doublet at this redshift, but the feature at the position of O VI transition does not match the profile of that at the position of O VI .
- z = 1.5088. —
-
The O VI system at is another example of associated O VI absorption that appears slightly redward of the quasar emission redshift. It is detected in Ly and Ly. The Ly shows the same components as O VI, but clearly has a blend to the red, probably with Ly. Ly is heavily blended with C IV from the system. C III is also detected in three components, though the blueward one is affected by a data defect.
3.2 HE0515-4414 ()
This quasar was observed with HST/STIS by Reimers et al. (2003) in order to study a sub-DLA at , for which they also have optical coverage. Their study of this system, particularly focused on molecular hydrogen, is published as Reimers et al. (2003). In addition, Reimers et al. (2003) and Levshakov et al. (2003) report on six O VI systems along the line of sight (at , 1.416, 1.602, 1.674 and 1.697), based upon the HST/STIS spectrum in conjunction with VLT/UVES data. Ly is covered over the entire HST/STIS spectrum, Ly up to Å, and Ly is covered up to Å. There is more limited coverage of all other Lyman series transitions down to the Lyman limit of the quasar.
The HST/STIS spectrum is dominated by the sub-DLA at and its many detected metal and molecular hydrogen transitions. In addition, there is one C IV system, four definite O VI systems, and three possible O VI systems. A couple of these O VI systems are associated. System plots for this quasar are given in Figures 19–27.
- z = 0.9406. —
-
A two component C IV doublet is detected at , which also has Ly and Si III detected. Si IV is also probably detected in the redward component, but this can’t be confirmed because Si IV is blended with an unknown line, probably Ly.
- z = 1.1508. —
-
The sub-DLA at is a very complex system, spanning km s-1 for absorption in many low ionization transitions. It has many molecular hydrogen lines detected. Our identifications for the molecules follow exactly those of Reimers et al. (2003). The saturated region of the sub-DLA profile spans km s-1. A separate component at km s-1 is likely also to be Ly, but with no associated metals in the HST/STIS spectrum. Many neutral species of C I and N I are detected in a single, narrow component at km s-1, presumably associated with the bulk of the H I. Features at other velocities seen in the neutral transitions panels in Figure 20 are not related to this system (see line identifications in Table 3). O I is blended with Ly at , and cannot be measured, and no other strong O I transitions are covered. Many singly ionized transitions are detected for the system, both in the km s-1 component and at many other velocities to the blue. These match the Mg II and Fe II from the VLT/UVES spectrum (Levshakov et al., 2003). Strong Si III absorption is detected in many components, spanning the full velocity range. Siiv is detected as well, but there appears to be significant blending with Si IV , because Si IV is much weaker at some velocities. Civ is also detected in the VLT/UVES spectrum. Nv is covered, but not detected, and Ovi is not covered.
- z = 1.3849. —
-
An O VI doublet detected in the HST/STIS spectrum at has its member blended to the blue with Ly at . Civ is detected at the same redshift in the VLT/UVES spectrum (Levshakov et al., 2003). The corresponding, relatively weak (unsaturated) Ly line lies blueward of a larger saturated Ly feature. C III may also be detected.
- z = 1.4163. —
-
There is a possible O VI system at , as reported by Levshakov et al. (2003), however neither member of the O VI doublet aligns with the Ly and Ly, which are also detected in the STIS spectrum. There could be C III associated with this system, but it is badly blended with a probable Ly line, thus its alignment cannot be verified. Therefore, there is not convincing evidence for detected metals in this system.
- z = 1.6020. —
-
The O VI system at is well aligned and is detected in Ly and Ly in the HST/STIS spectrum. Ly, and possibly C IV, is detected in the VLT/UVES spectrum (Levshakov et al., 2003).
- z = 1.6668. —
-
There is a possible O VI system at , though its identity is somewhat uncertain. O VI is blended with a possible Ly line, such that the profiles of the doublet members cannot be compared. Ly is not detected at the position, however Ly is detected, with about the same profile shape and equivalent width as the O VI. Thus, this could be a fairly typical associated O VI absorber.
- z = 1.6736. —
-
There is an O VI system at detected in the HST/STIS spectrum. O VI is blended to the red with a possible Ly line. Ly is detected, as are higher order Lyman series lines, but the latter are blended with other transitions (see Table 3). Civ and Ly are detected in the VLT/UVES spectrum (Levshakov et al., 2003).
- z = 1.6971. —
-
The associated O VI absorber at also has C III and probably S VI detected. Levshakov et al. (2003) also detected Ly, Siiv , Civ , and Nv in their VLT/UVES spectrum. The Ly profile is not black, again a signature of associated O VI absorbers.
- z = 1.7358. —
-
A possible O VI system at cannot be confirmed by other features in the HST/STIS spectrum. Although Ly is covered, it is blended with Galactic Mg II . If real, this system would be significantly redshifted relative to the emission redshift of the quasar.
3.3 PG1206+459 ()
This quasar was observed by HST/FOS as part of the Quasar Absorption Line Key Project, but they had difficulty in identifying many of the lines due to uncertain continuum fitting (Jannuzi et al., 1998). They found evidence for an extensive metal-line system separated into subsystems at , 0.9277 and 0.9342, even at low resolution. Churchill et al. (1999) modeled this system based on the HST/FOS data, along with Keck/HIRES data (Churchill & Vogt, 2001). Ding et al. (2003) refined these models once the HST/STIS spectra were available.
Churchill et al. (1999) observed this quasar with HST/STIS to facilitate a detailed study of the systems at . The HST/STIS spectrum covers the Ly forest blueward of Å, but does not cover any higher order Lyman series lines. There are only three metal-line systems found in the HST/STIS spectrum: the extensive metal-line system at mentioned above, a C IV system, and an associated N V system. Figure 28–32 presents system plots for these metal-line systems, detected toward PG.
- z = 0.7338. —
-
There is a weak C IV doublet at . The C IV is blended with Si IV from the subsystem at , and also to the red with an unknown blend, probably Ly. The large feature blueward of the C IV transition is Si IV at . Mg II is not detected in the Keck/HIRES spectrum, nor any other low ionization transitions in the HST/STIS spectrum. However, the system is confirmed by Ly in the HST/FOS spectrum.
- z = 0.9254. —
-
The complex metal-line system at is spread over more than km s-1. Ding et al. (2003) separated it into three systems at (System A), (System B), and (System C). They suggest that these systems are produced by three different galaxies in a group. System A, at , has detected C II, Si III, Siiv , Civ , and Nv in the HST/STIS spectrum. Many other transitions, including Ovi and Lyman series lines, were detected in the HST/FOS spectrum. Si IV is blended with C IV from the C IV system. Ly is saturated and covers the entire velocity range between this system and System B.
- z = 0.9276. —
-
System B, at , produces a partial Lyman limit break in the HST/FOS spectrum. It is detected in several transitions of Si II, C II, Si III, Siiv , Civ , and Nv . Galactic Fe II is blended with the red wing of the Ly profile. C II is blended to the red with an unidentified line, probably Ly. The feature redward of Si IV is C IV from the system. C IV is self-blended, with the C IV from System A superimposed on the C IV from System B.
- z = 0.9343. —
-
System C, at is unusual in its high velocity relative to the main system, System B. For this system, which would be considered a single-cloud, weak Mg II absorber if isolated from the other systems, is detected in Ly, Si II, C II, Si III, Siiv , and Civ . N V is blended with N V from System B, but N V is not detected in a clean part of the spectrum. Again, O VI and various other transitions are detected in the HST/FOS spectrum.
- z = 1.0281. —
-
The N V system at is almost certainly intrinsic judging by its broad profile and the “non-black” Ly line, evidence for partial covering. No other metals are detected besides the N V.
3.4 PG1241+176 ()
This was also a quasar studied for the Quasar Absorption Line Key Project (Jannuzi et al., 1998), and a Keck/HIRES spectrum was obtained by Churchill & Vogt (2001). Particular Mg II systems, with optical and UV coverage, were studied in Churchill et al. (2000). The , 0.5584 and 0.8954 systems were modeled in detail by Ding et al. (2005).
This quasar was observed with HST/STIS by Churchill et al. in order to provide constraints on the physical conditions in Mg II absorbers. Ly forest lines appear in HST/STIS spectrum quasar spectrum blueward of 2763 Å, and the Ly forest is covered blueward of 2332 Å. We find evidence for six metal-line systems: one strong Mg II absorber, two weak Mg II absorbers, one weak C IV, and two associated O VI absorbers. The system plots for these metal-line systems are shown in Figures 33–38.
- z = 0.5507. —
-
Jannuzi et al. (1998) found a metal-line system at with strong C IV detected. This system corresponds to a strong Mg II absorber detected in a Keck/HIRES spectrum (Churchill & Vogt, 2001), which also has detected Ca II, Fe II, and Mg I. In the HST/STIS spectrum, we also find Fe II , Al II , and Civ . There is a detection of Al II at km s-1, which coincides with a satellite component of Mgii in the Keck/HIRES spectrum (Ding et al., 2005).
- z = 0.5584. —
-
For the multiple-cloud, weak Mg II absorber at , Civ was detected in the HST/STIS spectrum, but no low ionization transitions were detected, though Al II , Aliii , and Si II were covered.
- z = 0.7577. —
-
A possible weak C IV doublet at cannot be confirmed, since Ly is not covered in the HST/STIS or in the previous HST/FOS spectrum.
- z = 0.8954. —
-
The single-cloud, weak Mg II absorber at has detected Ly, Si III , Si IV , and Civ . The Si IV is affected by a blend. Although there is a detection at the position of Si II , Ding et al. (2005) note that this may be a blend, since it is difficult to explain the strength of this feature in comparison to the weaker Mgii lines.
- z = 1.2152. —
- z = 1.2717. —
-
Jannuzi et al. (1998) found a strong associated O VI absorber at in their HST/FOS spectrum, for which Ly and Ly were also detected. In the higher resolution HST/STIS spectrum, we confirm these detections, but do not find any other associated absorption. The relatively weak Ly, as compared to Ovi is characteristic of a class of associated O VI absorbers (Ganguly et al., 2007, in preparation).
3.5 PG 1248+401 ()
This quasar was studied by the HST Quasar Absorption Line Key Project using G190H and G270H spectra obtained with FOS (Jannuzi et al., 1998), who found metal-line systems at , 0.7660, 0.7732 and 0.8553. The latter two systems correspond to strong Mg II absorbers, modeled by Ding et al. (2005) based on Keck/HIRES data (Churchill & Vogt, 2001) and the HST/STIS spectrum presented here. Another system, at , with only Civ and Ly detected, was discussed in Milutinović et al. (2006).
Churchill et al. (1999) obtained a spectrum of this quasar with HST/STIS in order to provide constraints on the physical conditions in the two strong Mg II absorbers along the line of sight. In the HST/STIS spectrum, the Ly forest is only covered up to a wavelength of Å, and higher order Lyman series lines are not covered. We find evidence for two strong Mg II and two weak C IV systems in the HST/STIS spectra. These systems are shown in Figures 39–45.
- z = 0.3946. —
-
Al II and Al III 1855 are the only prominent transitions from the possible system that are covered in the HST/STIS spectrum. Although there is a detection at the position of Al II , the lack of detected Aliii and the lack of detection of Civ in the FOS spectrum leads us to question the reality of this system. Thus we prefer an identification of the feature at Å as Ly.
- z = 0.5648. —
-
A C IV doublet is found at in the HST/STIS spectrum. It is confirmed by a Ly detection in the G190H HST/FOS spectrum (Jannuzi et al., 1998). The weak feature at the expected position of Si II is unlikely to be Si II because of the absence of the stronger Si II transition in the FOS spectrum.
- z = 0.6174. —
-
There is a very weak possible C IV doublet at in the HST/STIS spectrum, however the alignment is not perfect. Also, there is no Ly detected in the FOS spectrum to a rest frame equivalent width limit of Å.
- z = 0.7011. —
-
The C IV absorption system at is confirmed by a Ly detection in the FOS spectrum, but there are no additional detections in the HST/STIS spectrum.
- z = 0.7728. —
-
The strong Mg II system at has detected Al II , Si II and Si II, C II , Siiv , and Civ in the STIS E230M spectrum. O I may be detected in the strongest low ionization component, but the spectrum is very noisy in that region.
- z = 0.7760. —
- z = 0.8545. —
-
The strong Mg II system at has detected Si II , C II , Siiv , Civ , and Nv . Kinematically, this system is interesting, with satellite components in low ionization gas (offset km s-1 from the main absorption) having corresponding, broader C IV absorption.
3.6 CSO ()
This quasar was previously studied through G190H and G270H HST/FOS spectra (Bahcall et al., 1996), but only three metal-line systems were indicated, at , 0.6606 and 1.0022. The coincides with a strong Mg II absorber (Churchill & Vogt, 2001), and it was modeled by Ding et al. (2005).
The HST/STIS spectrum was obtained in a program (P.I. Churchill) to facilitate a study of the Mg II absorber. This spectrum covers the Ly forest up to a wavelength of Å, and does not cover any Ly lines.
- z = 0.6611. —
-
Besides Galactic absorption, in the HST/STIS E230M spectrum, we detect metal-line absorption from only the system at , which corresponds to a full Lyman limit break seen in a HST/FOS G160L spectrum (Bahcall et al., 1993, 1996). A system plot is shown in Figure 46. From this system we find Al II , Si II , and Civ . Si IV is not detected. In fact, the C IV absorption at the velocity of the low ionization absorption is relatively weak, and this system classifies as “C IV–deficient” (Ding et al., 2005). The strongest C IV absorption is km s-1 redward of the strongest low ionization component. Jannuzi et al. (1998) note a complex of Ly lines ranging from to . They found no metals associated with this complex in the low resolution HST/FOS spectrum. We note that with the STIS data, it is possible to set a stronger limit, with a rest frame equivalent width limit .
3.7 PG ()
This was one of the HST QSO Absorption Line Key Project quasars, and its HST/FOS G270M spectrum was presented in Bahcall et al. (1996). In that spectrum, three extensive metal-line systems are present at , 0.9908 and 1.0417. Also, there are possible C IV doublets at , 0.6540, 0.6790 and 0.7796, and a possible O VI doublet at . In a Keck/HIRES optical spectrum, strong Mg II absorption is detected from the system, and weak Mg II absorption from the , 0.9060 and 1.0417 systems (Churchill & Vogt, 2001; Churchill et al., 1999; Charlton et al., 2003). Weak Mg II is also detected at in the optical spectrum (Churchill et al., 1999). The three single-cloud, weak Mg II absorbers at , 0.9056 and 0.6534 were modeled by Charlton et al. (2003), the multiple-cloud, weak Mg II absorber at by Zonak et al. (2004), and the strong Mg II absorber at by Ding et al. (2003).
Two programs contribute different wavelength coverage of this quasar with HST/STIS. Burles (1997, HST Proposal ID #7292) observed the quasar in order to measure the primordial D/H ratio. Jannuzi et al. (1998) provided redward coverage in order to conduct a detailed study of the Ly forest. In the HST/STIS spectra, Ly is covered up to Å, Ly up to Å, and Ly in the small region up to Å. There is detected absorption from the strong Mg II absorber, and from the four weak Mg II absorbers mentioned above. There are also several possible C IV systems and a possible O VI system, as well as an interesting “C III/Si III-only” system. There is a possible intrinsic N V system and an associated O VI system observed toward this quasar as well. We report on these systems here, and shown system plots in Figures 47–56.
- z = 0.2854. —
-
We can only tentatively claim a C IV doublet at . The C IV and C IV profiles match reasonably well, but C IV may be a bit too strong at some velocities, and there is no coverage of transitions that could confirm this identification. This could relate to a blend with the C III from the system (see below).
- z = 0.6513. —
-
There is also a probable, narrow C IV doublet at . The C IV transition is blended with C IV from the system. If this is real, it is unusual in the weakness of Ly relative to C IV. A weak, narrow N V doublet may also be detected.
- z = 0.6535. —
-
The HST/STIS spectrum shows weak absorption in several low and intermediate transitions related to the single-cloud, weak Mg II absorber. The C IV has two components redward of the dominant low ionization absorption, and Si IV is weaker but has similar kinematics.
- z = 0.8182. —
-
The single-cloud, weak Mg II absorber at has detected Si II, C II, Si IV, and C IV absorption, all centered at the same velocity as the Mg II. Si III is blended with Ly from a system at , and is apparent as a small depression in the red wing of that feature.
- z = 0.9056. —
-
For another single-cloud, weak Mg II absorber at , Ly, Ly, C II, Si II, Si IV, C IV, N V, and O VI are detected in the HST/STIS spectrum. The coverage of N V and O VI is unusual for single-cloud, weak Mg II absorbers and is important for considerations of the phase structure of these objects.
- z = 0.9645. —
-
There is an interesting system detected in the HST/STIS spectrum at . Most of the common metal transitions have good coverage, but only C III and Si III are detected. Ly and Ly confirm the reality of this system.
- z = 0.9904. —
-
The C IV-deficient, strong Mg II absorber at has detections in the HST/STIS spectrum of the first four Lyman series lines, O I, and a variety of singly to triply ionized transitions, including relatively weak C IV absorption. N V and O VI are covered, but not detected. The Ly line is detected, but suffers from a blend to the blue with H I from the system at . This system is of interest because the higher ionization transitions appear redward of the lower ionization transitions, indicating a density gradient across the system (Ding et al., 2005).
- z = 1.0415. —
-
The multiple-cloud, weak Mg II system has a partial Lyman limit break detected in a HST/STIS G230M spectrum. The higher order Lyman series lines are detected down to the break in the HST/STIS E230M spectrum, though past H I they suffer badly from blending with the Lyman series lines from the system. Metal lines are detected in Si II, C II, Si III, Si IV, and O VI from each of two subsystems. The low ionization transitions are centered at different velocities than the high ionization transitions. C III is also detected, but may be blended with the possible C IV doublet at . C IV is detected in a low resolution HST/FOS spectrum, but is redward of the HST/STIS coverage.
- z = 1.1408. —
-
There is a possible O VI absorber at , however its O VI transition is too strong relative to the O VI transition. Although Ly, Ly, and Ly are detected at this velocity, their relative strengths are also inconsistent, perhaps due to unknown blends.
- z = 1.3413. —
-
An O VI doublet is detected from a system at , which is slightly redward of . It is confirmed by a very weak Ly detection, but Ly is badly blended and provides no additional constraint. This is another example of an associated O VI system (e.g. Ganguly et al. (2007, in preparation)).
3.8 PG ()
The E230M observation of this quasar with HST/STIS was proposed by Burles et al. (1997, HST Proposal ID #7292) to facilitate a study of the deuterium to hydrogen ratio in a system at (Kirkman et al., 2001). An HST/STIS G230M spectrum was also obtained, covering the Lyman series for this system (Kirkman et al., 2001). Earlier, this quasar was observed as part of the HST Quasar Absorption Line Key Project. Jannuzi et al. (1998) found metal-line systems at , 1.0323 and 1.0872.
In the HST/STIS spectrum, Ly is covered up to Å, Ly up to Å, and Ly up to Å. All Lyman series lines are covered below Å. In addition to the system, for which this observation was obtained, we find evidence for four definite and two possible O VI absorbers. These systems are all shown in Figures 57–64.
- z = 0.7011. —
-
The Lyman limit system has Ly and Si III detected in the HST/STIS spectrum. Weak C II also appear to be detected, consistent with the weak Mg II absorption that Kirkman et al. (2001) found in a HIRES/Keck spectrum. Civ and Siiv are covered, but not detected.
- z = 0.8928. —
-
An O VI absorber is found at in the STIS spectrum, accompanied by detections of Si III, Ly, and Ly. Jannuzi et al. (1998) also found C III in a low resolution HST/FOS spectrum.
- z = 1.0065. —
-
Another O VI system is detected at in the HST/STIS spectrum. Ly and Ly are also detected, confirming this O VI doublet.
- z = 1.0318. —
-
A stronger O VI absorber is detected at , corresponding to the system found by Jannuzi et al. (1998). In the HST/STIS spectrum the first five Lyman series lines are detected, along with C III, Nv , and Ovi .
- z = 1.0507. —
-
There is a feature detected (just above ) at the position of O VI for a system at with detected Ly and Ly absorption. The O VI is not detected, even at , so it is uncertain whether there are detected metals for this system.
- z = 1.0548. —
-
The system, with Ly, Ly, Ly, and Ly detected in the HST/STIS spectrum, appears to be an O VI absorber, with weak C III absorption. The O VI doublet cannot be confirmed because the O VI member is blended with Ly at .
- z = 1.0867. —
-
There is an associated system with , detected in Ly, Ly, and Ly. The Ly profile has a black, saturated region at this redshift. The component has detections in C III and Si III.
- z = 1.0874. —
-
There is also a non-black component at . This system detected Ovi , and resembles many other associated O VI systems.
4 Summary of Systems
This paper presents a catalog that is useful for investigations of metal-line systems and the Ly forest in eight of the highest S/N-ratio E230M spectra from the HST/STIS archive. We have identified a total of 56 metal-line systems (with at least one metal line detected) toward the eight quasars listed in Table 1, as presented in Figures 9–64. For key transitions, Table 4 tabulates in how many of the 56 systems a given transition was covered and in how many it was detected. We must caution that clearly these numbers apply only to this particular dataset and are highly dependent on the detection limits of the spectra, to the exact wavelength coverage, and to biases toward certain kinds of quasars for the sample. In this sample of eight quasars, there may be a preference toward strong low ionization absorbers, since many of them were chosen for a program to study the C IV associated with Mg II absorption (see Table 1).
Nonetheless, it is useful to note from Table 4 that for about half of the 56 systems we have coverage of the C IV and O VI doublets, and that in those cases these high ionization transitions were detected % of the time. Intermediate ionization transitions such as C III 977 and Si III 1207 were also covered about half the time, and were detected in 50%/58% of the sight lines, respectively. C II 1335 is also covered for about half of the systems, and was detected 56% of the time, while Si II 1260 was only detected in 36% of the sightlines for which it was covered. We conclude that almost all 1 1.7 metal-line systems have high ionization absorption detected, but that only half have detected low ionization absorption. These numbers are consistent with the findings of Milutinović et al. (2006), that half of all C IV absorbers at low redshift have detected low ionization absorption (sometimes weak), and that the other half do not. This is not surprising since the samples used for these studies have considerable overlap.
Studies of the statistics of the Ly forest can be significantly affected by metal lines in the forest. With our catalog we are able to give an indication of the level of contamination by metal lines in the forest. Specifically, we scanned the wavelength regions of our catalog that are in the Ly forest of the quasar, but are redward of the Ly forest. Table 1 lists how many Ly lines and how many metal lines were detected in this region for each quasar. It also shows that 9-10 of the features detected in the E230M quasar spectra are actually Galactic absorption. We conclude that of the Ly forest lines detected toward each of the quasars (redward of the Ly forest), 20-33% of the lines in the Ly forest are actually metal lines. This ”contamination” is significant enough that it is important to remove it before computing the statistics of the Ly lines, and is clearly itself a complicated function of redshift.
Acknowledgments
We acknowledge support from NASA under grant NAG5-6399 NNG04GE73G and by the National Science Foundation under grant AST 04-07138. J. R. M. and R. S. L. were partially funded by the NSF Research Experience for Undergraduates (REU) program. DT and DK were supported in part by STScI grants HST-AR-10688 and HST-AR-10288. SB was supported by the NSF/REU program in the summer of 2005.
References
- Bahcall et al. (1996) Bahcall J. N., et al., 1996, ApJ, 457, 19
- Bahcall et al. (1993) Bahcall J. N., et al., 1993, ApJS, 87, 1
- Brown et al. (2002) Brown, T., et al. 2002, HST STIS Data Handbook, version 4.0, ed. B. Mobasher (Baltimore; STScI)
- Charlton et al. (2003) Charlton, J. C., Ding, J., Zonak, S. G., Churchill, C. W., Bond, N. A., & Rigby, J. R. 2003, ApJ, 589, 311
- Churchill et al. (2000) Churchill, C. W., Mellon, R. R., Charlton, J. C., Jannuzi, B. T., Kirhakos, S., Steidel, C. C., & Schneider, D. P. 2000, ApJS, 130, 91
- Churchill et al. (1999) Churchill, C. W., Rigby, J. R., Charlton, J. C., & Vogt, S. S. 1999, ApJS, 120, 51
- Churchill & Vogt (2001) Churchill, C. W., & Vogt, S. S. 2001, AJ, 122, 679
- Ding et al. (2005) Ding, J., Charlton, J. C., & Churchill, C. W. 2005, ApJ, 621, 615
- Ding et al. (2003) Ding, J., Charlton, J. C., Churchill, C. W., & Palma, C. 2003a, ApJ, 590, 746
- Ding et al. (2003) Ding J., Charlton J. C., Bond N. A., Zonak S. G., Churchill C. W., 2003b, ApJ, 587, 551
- Ganguly et al. (2007, in preparation) Ganguly R. et al., 2007, in preparation
- Jannuzi et al. (1998) Jannuzi B. T., et al., 1998, ApJS, 118, 1
- Kirkman et al. (2007) Kirkman, D., Tytler, D., Lubin, D., & Charlton, J. 2007, MNRAS, 376, 1227
- Kirkman et al. (2001) Kirkman, D., et al. 2001, ApJ, 559, 23
- Koratkar et al. (1998) Koratkar A., Antonucci R., Goodrich R., Storrs A., 1998, ApJ, 503, 599
- Levshakov et al. (2003) Levshakov S. A., Agafonova I. I., Reimers D., Baade R., 2003, A&A, 404, 449
- Masiero et al. (2005) Masiero, J. R., Charlton, J. C., Ding, J., & Churchill, C. W. 2005, ApJ, 623, 57
- Milutinović et al. (2006) Milutinović N., Rigby J. R., Masiero J. R., Lynch R. S., Palma C., Charlton J. C., 2006, ApJ, 641, 190
- Narayanan et al. (2005) Narayanan, A., Charlton, J. C., Masiero, J. R., & Lynch, R., 2005, ApJ, 632, 92
- Rao & Turnshek (2000) Rao, S. M., & Turnshek, D. A., 2000, ApJS, 130, 1
- Reimers et al. (2003) Reimers D., Baade R., Quast R., Levshakov S. A., 2003, A&A, 410, 785
- Savage et al. (2002) Savage, B. D., Sembach, K. R., Tripp, T. M., & Richter, P., 2002, ApJ, 564, 631
- Schneider et al. (1993) Schneider, D. P., et al. 1993, ApJS, 87, 45
- Tripp et al. (2000) Tripp, T. M., Savage, B. D., & Jenkins, E. B. 2000, ApJ, 534, L1
- Verner et al. (1996) Verner, D. A., Verner, E. M., & Ferland, G. J. 1996, ADNDT, 64, 1
- Zonak et al. (2004) Zonak, S. G., Charlton, J. C., Ding, J. & Churchill, C. W. 2004, ApJ, 606, 196
| QSO ID | PI | Proposal ID | b | c | d | |||||
|---|---|---|---|---|---|---|---|---|---|---|
| 2382 Å | 2796 Å | (Å) | (Å) | |||||||
| PG 0117+210 | 1.491 | 8.5 | 14.2 | Jannuzi | 8673 | 2278.7 | 3117.0 | 104 | 31 | 10 |
| HE 0515-4414 | 1.713 | 8.1 | 22.0 | Reimers | 8288 | 2274.8 | 3118.9 | 63 | 13 | 9 |
| PG 1206+459 | 1.160 | 8.4 | 15.4 | Churchill | 8672 | 2277.1 | 3116.4 | 85 | 33 | 9 |
| PG 1241+176 | 1.273 | 5.2 | 20.0 | Churchill | 8672 | 2276.9 | 3066.0 | 62 | 20 | 10 |
| PG 1248+401 | 1.030 | 8.1 | 9.6 | Churchill | 8672 | 2276.7 | 3107.7 | 41 | 14 | 10 |
| CSO 873e | 1.022 | 8.0 | 10.4 | Churchill | 8672 | 2278.4 | 3119.2 | 26 | 3 | 8 |
| PG 1634+706 | 1.334 | 19.8 | 28.5 | Jannuzi/Burles | 8312/7292 | 1860.7 | 3117.0 | 121 | 33 | 18 |
| PG 1718+481 | 1.083 | 15.9 | … | Burles | 7292 | 1848.4 | 2672.7 | 81 | 15 | 14 |
a per pixel at 2382 Å and 2796 Å, b Total number of absorption features between Ly and Ly emission lines of quasar, c Number of identified metal absorption features between Ly and Ly emission lines of quasar, d Number of Galactic metal absorption features in entire observed wavelength region, e Coordinate of this quasar: RA: 13:19:56.3 Dec: +27:28:09 (J2000.0).
| Transition | a | Oscillator Strengtha |
|---|---|---|
| (Å) | ||
| Ly | 1215.6701 | 0.416400 |
| H I1026 | 1025.7223 | 0.079120 |
| H I972 | 972.5368 | 0.029000 |
| H I950 | 949.7431 | 0.013940 |
| H I938 | 937.8035 | 0.007799 |
| H I931 | 930.7483 | 0.004814 |
| H I926 | 926.2257 | 0.003183 |
| H I923 | 923.1504 | 0.002216 |
| H I921 | 920.9631 | 0.001605 |
| H I919 | 919.3514 | 0.00120 |
| C I1158 | 1157.910 | 0.021780 |
| C I1189 | 1188.833 | 0.016760 |
| C I1277 | 1277.245 | 0.096650 |
| C I1329 | 1328.833 | 0.058040 |
| C II1036 | 1036.3367 | 0.1231 |
| C II1335 | 1335.31 | 0.127 |
| C II1336b | 1335.6627 | 0.01277 |
| C III977 | 977.020 | 0.7620 |
| C IV1548 | 1548.195 | 0.190800 |
| C IV1551 | 1550.770 | 0.095220 |
| N I1134b | 1134.1653 | 0.01342 |
| N I1135 | 1134.9803 | 0.04023 |
| N I1201 | 1200.7098 | 0.04423 |
| N II1084 | 1083.990 | 0.1031 |
| N V1239 | 1238.821 | 0.157000 |
| N V1243 | 1242.804 | 0.078230 |
| O VI1032 | 1031.927 | 0.132900 |
| O VI1038 | 1037.616 | 0.066090 |
| Mg I2853 | 2852.964 | 1.810000 |
| Mg II2796 | 2796.352 | 0.6123 |
| Mg II2803 | 2803.531 | 0.3054 |
| Al II1671 | 1670.787 | 1.880000 |
| Al III1855 | 1854.716 | 0.539000 |
| Si II990 | 989.873 | 0.133000 |
| Si II1190 | 1190.416 | 0.250200 |
| Si II1193 | 1193.290 | 0.499100 |
| Si II1195 | 1194.500 | 0.623300 |
| Si II1260 | 1260.422 | 1.007000 |
| Si II1304 | 1304.370 | 0.147300 |
| Si II1527 | 1526.707 | 0.11600 |
| Si III1207 | 1206.500 | 1.660000 |
| Si IV1394 | 1393.755 | 0.528000 |
| Si IV1403 | 1402.770 | 0.262000 |
| P II1153 | 1152.818 | 0.236100 |
| S II1251 | 1250.584 | 0.005453 |
| Cr II2056 | 2056.254 | 0.1403 |
| Cr II2062 | 2062.234 | 0.1049 |
| Cr II2066 | 2066.161 | 0.06982 |
| Mn II2577 | 2576.877 | 0.3508 |
| Mn II2594 | 2594.499 | 0.2710 |
| Mn II2606 | 2606.461 | 0.1927 |
| Fe I2524 | 2523.608 | 0.279000 |
| Fe II1608 | 1608.4449 | 0.055450 |
| Fe II2250 | 2249.8768 | 0.00182 |
| Fe II2261 | 2260.7805 | 0.00244 |
| Fe II2344 | 2344.214 | 0.109700 |
| Fe II2374 | 2374.4612 | 0.02818 |
| Fe II2383 | 2382.765 | 0.3006 |
| Fe II2587 | 2586.650 | 0.064570 |
| Fe II2600 | 2600.1729 | 0.22390 |
| Zn II2063 | 2062.664 | 0.252900 |
a These numbers are from Verner et al. (1996).
| # | Line ID | z | Notes | ||||
|---|---|---|---|---|---|---|---|
| PG () | |||||||
| 1 | 2278.83 | 0.21 | 0.02 | 9.5 | H I972 | 1.3430 | |
| 2 | 2285.29 | 0.97 | 0.04 | 25.7 | C III977 | 1.3390 | |
| 3 | 2287.19 | 0.11 | 0.02 | 6.3 | Ly ? | 0.8814 | |
| 4 | 2288.62 | 1.62 | 0.03 | 49.4 | C III977 | 1.3430 | Probable blend with Ly at =0.8026 ? |
| 5 | 2292.90 | 0.14 | 0.02 | 7.9 | Ly ? | 0.8861 | |
| 6 | 2293.51 | 0.14 | 0.02 | 6.8 | Ly ? | 0.8866 | |
| 7 | 2295.47 | 0.47 | 0.02 | 21.4 | H I938 | 1.4478 | |
| 8 | 2301.45 | 1.31 | 0.05 | 28.4 | Ly ? | 0.8932 | Reddest component is H I950 at =1.4242 |
| 9 | 2306.53 | 0.05 | 0.01 | 4.2 | Ly ? | 0.8973 | |
| 10 | 2306.91 | 0.20 | 0.01 | 13.9 | C II1335 | 0.7290 | |
| 11 | 2307.52 | 0.18 | 0.02 | 11.8 | C II1335 | 0.7290 | |
| 12 | 2311.85 | 0.76 | 0.04 | 21.2 | H I1026 | 1.2543 | |
| 13 | 2313.76 | 0.51 | 0.02 | 20.9 | Ly ? | 0.9033 | |
| 14 | 2316.57 | 0.09 | 0.01 | 6.0 | Ly ? | 0.9056 | |
| 15 | 2318.26 | 0.04 | 0.01 | 5.5 | Ly ? | 0.9070 | Small contribution from N III989 at =1.3430 |
| 16 | 2319.01 | 0.38 | 0.02 | 17.5 | Ly ? | 0.9076 | |
| 17 | 2320.72 | 0.83 | 0.03 | 33.0 | H I972 | 1.3866 | |
| 18 | 2321.88 | 0.11 | 0.01 | 9.3 | H I931 | 1.4949 | |
| 19 | 2322.47 | 0.13 | 0.02 | 6.9 | Ly ? | 0.9104 | |
| 20 | 2324.65 | 0.46 | 0.02 | 21.8 | H I950 | 1.4478 | |
| 21 | 2325.78 | 0.06 | 0.01 | 5.5 | Ly ? | 0.9132 | |
| 22 | 2331.23 | 0.04 | 0.01 | 3.0 | H I972 | 1.3983 | |
| 23 | 2332.47 | 0.37 | 0.02 | 16.4 | H I972 | 1.3983 | |
| 24 | 2334.98 | 0.19 | 0.02 | 10.1 | Ly ? | 0.9207 | |
| 25 | 2339.13 | 0.40 | 0.03 | 12.7 | H I938 | 1.4949 | |
| 26 | 2342.22 | 0.08 | 0.01 | 5.5 | Ly ? | 0.9267 | |
| 27 | 2343.96 | 0.77 | 0.02 | 35.2 | Fe II2344 | 0 | |
| 28 | 2349.69 | 0.53 | 0.02 | 24.8 | Fe II2374 | 0 | |
| 29 | 2352.69 | 0.14 | 0.02 | 9.0 | Ly ? | 0.9353 | |
| 30 | 2353.30 | 0.08 | 0.02 | 5.2 | H I972 | 1.4242 | |
| 31 | 2357.58 | 0.38 | 0.02 | 16.9 | Ly ? | 0.9393 | |
| 32 | 2359.25 | 0.34 | 0.03 | 13.5 | Ly ? | 0.9407 | |
| 33 | 2369.23 | 0.35 | 0.02 | 18.1 | H I950 | 1.4949 | Blend to the red with C III977 at =1.4242 |
| 34 | 2374.49 | 0.99 | 0.03 | 31.7 | Fe II2374 | 0 | |
| 35 | 2380.41 | 0.66 | 0.02 | 27.7 | H I972 | 1.4478 | |
| Transition | #cova | #detb | Detection Ratec |
|---|---|---|---|
| (%) | |||
| C II1335 | 27 | 15 | 56 |
| C III977 | 26 | 13 | 50 |
| C IV1548 | 26 | 23 | 88 |
| N II1084 | 31 | 1 | 3 |
| N V1239 | 37 | 9 | 24 |
| O VI1032 | 30 | 27 | 90 |
| Al II1671 | 18 | 7 | 39 |
| Al III1855 | 10 | 2 | 20 |
| Si II1260 | 36 | 13 | 36 |
| Si III1207 | 36 | 21 | 58 |
| Si IV1394 | 26 | 13 | 50 |
| Fe II1608 | 22 | 2 | 9 |
a Number of systems in which transition is covered, b Number of systems in which transition is detected, c Probability that transition is detected at for system in which it is covered.