11email: mkrumpe@aip.de
RBS1423 - a new QSO with relativistic reflection from an ionised disk††thanks: Based on observations obtained with XMM-Newton, an ESA science mission with instruments and contributions directly funded by ESA Member States and NASA.
Abstract
Aims. We present the analysis and results of a 20 ks XMM-Newton observation of RBS1423.
Methods. X-ray spectral analysis is used to establish a significantly broadened relativistic iron K line from a highly ionised disk.
Results. A QSO at was considered to be the optical counterpart of this ROSAT Bright Survey X-ray source. Based on the improved XMM-Newton source position we identified a QSO as optical counterpart to RBS1423. The 0.2-12 keV X-ray luminosity of this radio-quiet QSO is . The XMM-EPIC spectra are well described by a power law with a significantly broadened iron K line. Disk line models for both Schwarzschild and Kerr black holes require hydrogen-like iron ions to fit the measured line profile. Significant ionisation of the reflection disk is confirmed by model fits with ionised disk models, resulting in an ionisation parameter .
Key Words.:
Galaxies: active – Quasar: general – X-ray individual: RBS14231 Introduction
The X-ray spectra of Seyfert type I galaxies and radio quiet quasi stellar objects (QSOs) are generally dominated by a power law component which is often accompanied by a softer component below 1 keV (“soft excess”, Arnaud et al. 1985). An iron fluorescence line at 6.4 keV was first observed in OSO-8 spectra of Centaurus A (Mushotzky et al. 1978). It was found to be a common feature in the X-ray spectra of AGN by the GINGA satellite (Nandra & Pounds 1994). With the higher spectral resolution of the ASCA satellite, very broad emission features were discovered in the X-ray spectra of a few nearby Seyfert galaxies (e.g. MCG-6-30-15, Tanaka et al. 1995; NGC 3783, George et al. 1998). These features are usually interpreted as iron K fluorescence originating from reflection by the innermost parts of the AGN accretion disk, where they are broadened by gravitational redshift and relativistic motion. With the launch of XMM-Newton and CHANDRA higher quality spectra became available, which in many cases confirmed the relativistic reflection scenario (e.g. for MCG-6-30-15, Wilms et al. 2001, NGC 3516, Turner et al. 2002). While the relativistically broadened iron lines are now found in large fraction among the local, low luminosity Seyfert galaxies (Nandra et al. 2006, Guainazzi, Bianchi, & Dovčiac 2006), detections in higher luminosity Seyfert galaxies and QSOs e.g., E1821+643 (Jimenéz-Bailón et al. 2007), 3C109 (Miniutti et al. 2006), or Q0056-363 (Porquet & Reeves 2003) are still rare. The low number of detections in luminous QSOs is partly due the small number of bright, low redshift, luminous QSOs. On the other hand, it has been shown that the equivalent width of narrow iron K emission lines is anti-correlated with X-ray luminosity (Iwasawa & Taniguchi 1993). This so-called X-ray Baldwin effect has also been found for the equivalent widths of relativistically broadened iron lines (Nandra et al. 1997). In a sample of 38 PG QSOs and (radio-loud) quasars, only three XMM-Newton spectra showed significant detections of relativistically broadened iron lines (Jimenéz-Bailón et al. 2005).
Here we present a 20 ksec XMM-Newton observation of the ROSAT X-ray source RBS1423 (RA=14h 44m 14s, DEC=06∘ 32m 30s). In the ROSAT bright survey (RBS, Schwope et al. 2000) this source was identified with a QSO at . Based on the XMM-Newton position, we assign a new optical counterpart to RBS1423, a QSO with and an 0.2-12 keV X-ray luminosity .
2 XMM-Newton observation
RBS1423 was observed by XMM-Newton on February 11, 2005 (ObsID 0207130401, orbit 948, exposure time 20.2 ksec) with the European Photon Imaging Cameras (EPIC) as primary instruments. The EPIC-PN camera was operated in standard Full Window mode with thin filter, while both EPIC-MOS cameras observed in Full Window mode with medium filters. The data were processed with SAS version 7.0 (Science Analysis Sofware) package, including the corresponding calibration files. The epchain and emchain tasks were used for generating linearised event lists from the raw PN and MOS data.
After cleaning the data of observation time with high background, we obtained net exposure times of 14.1 ksec for the EPIC-PN camera and 16.7 ksec for both EPIC-MOS cameras. The count rates were and per camera, respectively. Therefore, the effects of photon pile-up are negligible for both cameras.
3 The optical counterpart of RBS1423
The RBS-catalogue originally identified a QSO at (Schwope et al. 2000) as X-ray source of RBS1423, but mentioned a possible contribution of a Seyfert I galaxy at 54 arcsec distance (). Considering the measured 0.5-2.0 keV ROSAT flux of erg cm-2 s-1, RBS1423 would have been one of the most luminous X-ray sources in the sky with .
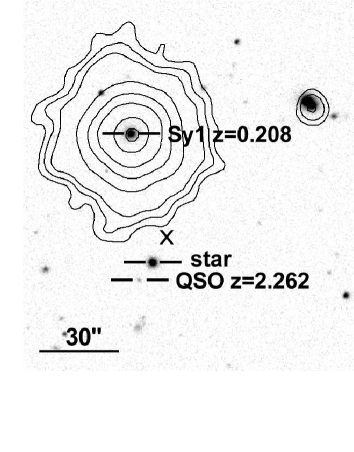
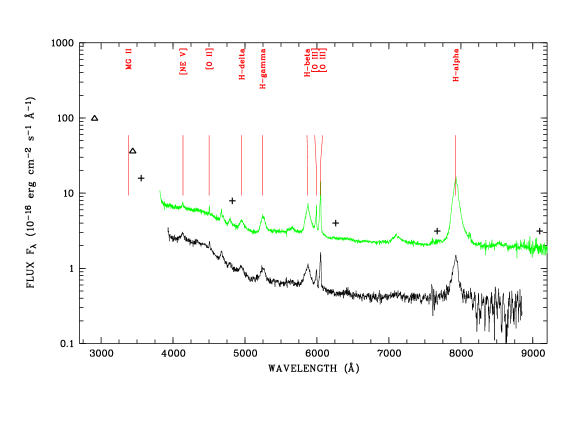
Based on the linearised event list, we produced 0.2-10 keV broad band X-ray images for all EPIC cameras. A combined source detection was performed (edetect_chain) with a minimum detection likelihood . The source detection list was astrometrically corrected for a systematic XMM-Newton position error (eposcorr). Furthermore, we generated an astrometrically corrected EPIC-PN X-ray image, which was used to plot the X-ray contours in Fig. 1. Our XMM-Newton X-ray image clearly reveals the Seyfert I galaxy at as the only counterpart to RBS1423. According to the conventional dividing line of between Seyfert galaxies and QSOs, we classify the (see Sect. 4.3) object as a low luminosity QSO.
The QSO at redshift was not detected as an X-ray source above the detection likelihood limit. The offset between the XMM-Newton and the ROSAT position (the latter indicated by a cross in Fig. 1) is 41 arcsec. The angular distance between the QSO and the QSO is 54 arcsec. Hence, the off-axis location of the X-ray source is negligible for the further data analysis. In total, we collected 40000 X-ray photons from RBS1423 allowing proper spectral analysis (Sect. 5).
4 Optical observations
4.1 Keck II & SDSS data
During the optical identification program of the RBS sources, the QSO at was observed spectroscopically with the Low Resolution Imaging Spectrograph (LRIS) at the Keck II telescope on April 3, 1997. The longslit observation with a slit width of 1 arcsec and slit length of 175 arcsec had an exposure time of 900 seconds. The reciprocal dispersion was 2.55 /pixel. The spectrum (see Fig. 1, right panel, black line) was extracted in the standard manner and standard flux calibration was applied. The FWHM of the H- line in the Keck spectrum is 3000 km/s (FWHM700 km/s, FWHM4000 km/s).
More than four years later, on June 15, 2001, the Sloan Digital Sky Survey (SDSS, see e.g. Adelman-McCarthy et al. 2006) obtained photometric magnitudes in the u-, g-, r-, i-, z-SDSS-bands for the QSO at . On May 3, 2005, an SDSS spectrum was taken with an exposure time of 3600 s. The SDSS spectrum is shown in Fig 1, right panel as a green line. The line widths are FWHM3600 km/s, FWHM600 km/s, and FWHM3100 km/s.
4.2 XMM-Newton Optical Monitor photometry
Optical and near-ultraviolet images of RBS1423 were obtained with the optical monitor (OM, Mason et al. 2001) onboard XMM-Newton through U and UVW1 filters with central wavelengths 3440 and 2910 , respectively. The exposure time in the U-filter was 5000 seconds and 3174 seconds in the UVW1. The data were processed with the OM reduction pipeline omichain.
The resulting count rates were corrected for detector dead time and for the time-dependent degradation factor, as computed by the SAS task ommag. Zero point and flux conversion factors from the XMM-Newton calibration files allowed us to calculate optical fluxes. The U- and UVW1-fluxes of the OM are marked in Fig. 1 (right panel) as triangles.
4.3 Optical variablility of RBS1423
We converted the SDSS - and -magnitudes to Johnson -magnitudes following Smith et al. (2002) also applying a -correction. Based on the derived absolute -band magnitude of , we re-classify RBS1423 as a low luminosity QSO.
Comparing the different optical data sets of this QSO (Fig. 1), it is obvious that RBS1423 is highly variable in the optical. The SDSS spectrum shows a fivefold increased continuum flux and a tenfold increased H- line flux compared to the Keck spectrum. The OM photometric data show a pronounced rise of the spectral flux at short wavelength.
We searched for X-ray variability in our XMM-Newton data, but found no significant deviation from the mean count rate. The measured XMM-Newton flux of erg cm-2 s-1 is comparable to the ROSAT flux. Multiple observations covering longer time scales are required to observe a possible X-ray variability.
4.4 Black hole mass estimate
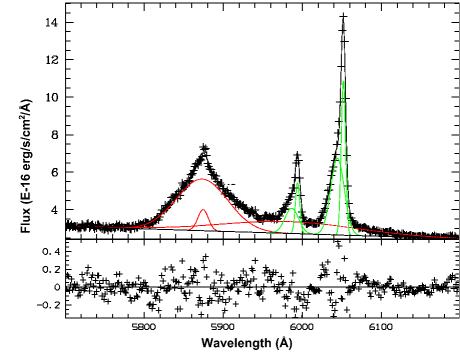
Since the optical spectra cover the H- line, we are able to estimate the black hole mass of RBS1423 following Vestergaard & Peterson (2006). The analysis of the H- and O[iii] system (Fig. 2) reveals a superposition of a narrow-line component and a blueshifted broad-line component. The SDSS spectrum was normalised to the photometric -magnitude to compensate for slit losses during spectroscopy. This is essential, since the optical continuum luminosity L) is needed to estimate the black hole mass. The observed FWHM of the summed H- line components is 61 . We correct the line width measurement for spectral resolution following Peterson et al. (2004) and take into account the SDSS resolution of R2000. Based on a computed L) erg/s, the black hole mass is estimated to log =8.1.
5 X-ray spectral analysis
X-ray spectra of RBS1423 were extracted from calibrated photon event lists with SAS task especget which also creates the appropriate redistribution matrices and exposure-corrected effective area files. Instead of using the published effective area file shipped with SAS 7.0 for EPIC-PN we used the more recent version XRT3XAREAEF0011.CCF kindly made available by F. Haberl (MPE). This version implements a slight reduction of the XRT3 effective areas (with respect to XRT1 and XRT2) in the 6-8 keV range, which had been measured during the pre-flight calibration of the telescopes. The new version improves the concordance of the MOS and PN spectra at the energy of the Fe line.
X-ray events corresponding to patterns 0-12 and 0-4 events (single and double pixels) were selected for MOS and PN. For the EPIC-PN camera only X-ray events with flag 0 were included. The MOS X-ray events were extracted by using the recommended flag selection XMMEA_SM. A low-energy cutoff was set to 0.2 keV, while the high-energy cutoff was fixed to 12.0 keV. Identical source regions were used for all EPIC cameras in order to extract spectra. All spectra were binned to a minimum of 30 counts per bin to apply the minimisation technique in the spectral fitting, which was perfomed by using the XSPEC package version 12.0. All quoted errors are 68% limits unless otherwise mentioned.
The galactic hydrogen column density in the line of sight is (Dickey & Lockman 1990).
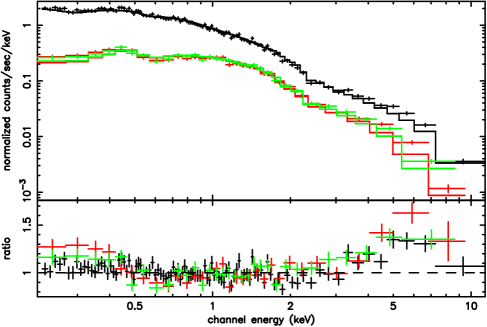
A single power law model with galactic absorption was fitted to the broad-band 0.2-12.0 keV PN and MOS spectra. The best fitting power law (/d.o.f. with ) showed significant positive residuals around 5 keV, typical for iron K emission (Fig. 3). Below 0.5 keV, a discrepancy between PN and both MOS cameras is noticable (15% higher count rates in MOS cameras relative to PN). The PN data are broadly consistent with a power law emission spectrum and foreground galactic absorption, while the MOS data indicate a possible soft excess. Due to this discrepancy we use only the spectra above 0.5 keV for the analysis of the possible Fe-K feature. Moreover, we fit the PN and MOS data separately.
All fit results are summarised in Table 1 for the PN detector and in Table 2 for the MOS cameras. Line energies and equivalent widths presented in these tables are given in the source frame.
The line feature is also apparent, when we fit single power laws to the PN and MOS data separately in the energy range 0.5-12.0 keV. We then tried to fit the spectra by introducing a second power law (labelled as wabs(power1 + power2)). However, the remaining excess still indicates the presence of a broad emission line feature.
As the next simple approach, we tried to fit the data using a single power law with a Gaussian line superposed. The line was detected at keV with a ) keV in the PN detector and at keV ( keV) in the MOS detectors. This corresponds to a rest-frame energy of 5.6 keV and 6.3 keV, respectively. Considering the statistical errors, the line energies measured by the MOS and PN cameras differ only marginally. However, some systematic influence of the effective area calibrations on the line energies cannot be ruled out.
The significant width of the line suggests relativistic broadening of the line. We therefore fitted iron K disk line models to the spectra: The XSPEC model diskline (Fabian et al. 1989) calculates the line broadening in an accretion disk around a non-rotating (Schwarzschild) black hole (BH) and the model laor (Laor 1991) around a spinning (Kerr) BH. The line emissivity is parameterised by a power law as a function of radius, with as a free parameter. Since is unconstrained we used an accretion disk emissivity law for the Schwarzschild BH model and for the Kerr BH model ().
The relevant model parameters and the equivalent widths of the emission line fits are given in Tables 1 and 2. For both cameras the laor fit results are statistically the better fits, favouring the rotating black hole scenario. Fig. 4 shows that for the laor model the emission line is required with high significance and that it is significantly broadened in the relativistic regime. The rest-frame line energy for a simultaneous fit of the PN and MOS data is (7.45 0.07) keV. Even if a broken power law plus a relativistic disk model laor is used, the broad-line feature is dectected with a significance of more than 3 in the PN and MOS data.
In none of the cases is the source frame energy of the line consistent with the K energy expected for neutral iron (6.4 keV). Instead, the fits suggest that the iron feature is due to fluorescence from hydrogen-like iron with a K energy of 6.9 keV. Fixing the source frame line energy to 6.4 keV and fitting the accretion disk inclination angle in the model laor as a free parameter formally leads to acceptable values, but leaves visible residuals in the range beyond 6.4 keV.
| Model | /d.o.f. | ||||||
| keV | keV | rSchwarzschild | rSchwarzschild | deg | |||
| wabs(power) | 2.040.01 | - | - | - | - | - | 477/378 |
| wabs(power1 + power2) | 1.580.30 & 2.510.35 | - | - | - | - | - | 436/376 |
| wabs(power + gauss) | 2.140.03 | 5.650.52 | - | - | - | 418/375 | |
| wabs(power + diskline) | 2.060.01 | 7.100.08 | 6110 | !400! | !30! | 455/375 | |
| wabs(power + laor) | 2.080.02 | 7.470.09 | 1.92.7 | !400! | !30! | 440/375 | |
| wabs(po1 + po2 + laor) | 1.550.54 & 2.360.36 | 7.100.13 | !1.9! | !400! | !30! | 424/374 | |
| wabs(kdblur(power + reflion)) | 1.620.24 | - | - | 2.81.6 | !400! | !30! | 421/374 |
| cov. fraction | in 1022 cm-2 | ||||||
| wabs(zpcfabs(power)) | 2.140.02 | 0.380.04 | 174 | 420/376 | |||
| Model | /d.o.f. | ||||||
| keV | keV | rSchwarzschild | rSchwarzschild | deg | |||
| wabs(power) | 1.900.02 | - | - | - | - | - | 314/280 |
| wabs(power1 + power2) | 1.250.83 & 2.140.32 | - | - | - | - | - | 301/278 |
| wabs(power + gauss) | 1.960.02 | 6.320.23 | - | - | - | 286/277 | |
| wabs(power + diskline) | 1.930.02 | 7.420.12 | 6571 | !400! | !30! | 302/277 | |
| wabs(power + laor) | 1.960.02 | 7.490.15 | 2.41.6 | !400! | !30! | 291/277 | |
| wabs(po1 + po2 + laor) | !1.25! & 2.040.07 | 6.850.15 | !2.4! | !400! | !30! | 287/277 | |
| wabs(kdblur(power + reflion)) | 1.720.16 | - | - | 60600 | !400! | !30! | 285/276 |
| cov. fraction | in 1022 cm-2 | ||||||
| wabs(zpcfabs(power)) | 1.970.02 | 0.370.09 | 3816 | 293/278 | |||
Since broad iron K features in AGN are connected with reflection by the accretion disk, other effects modifying the reflected X-ray spectrum have to be taken into account. We therefore applied the self-consistent ionised disk reflection models by Ross & Fabian (2005) to model the X-ray spectrum of RBS1423. Their calculations include a range of relevant fluorescence lines, absorption edges, Compton-reflection, and Compton-broadening of the atomic features. The models are available in tabulated form for fitting with XSPEC (reflion) and can be convolved with relativistic blurring using the code by Laor 1991 (model kdblur).
The observed X-ray spectrum is then interpreted as superposition of the illuminated power law and the reflected component, described by the XSPEC models wabs(kdblur(power+atabreflion.mod)).
Since the data quality is not sufficient to constrain all parameters, we set the outer radius of the relativistically blurring model to 400 Schwarzschild radii and the inclination to 30 degrees. This choice is not critical to our results. Furthermore, the power law of the reflected component is chosen to be equal to the power law of the illuminating radiation. Again, we fitted the PN and MOS data separately. Within the calculated errors, the fit parameters agreed very well for both data sets. The values of the reflion fits (see. Fig. 5) are slightly better than those of the laor and diskline fits. The iron abundance was found to be nearly solar (FePN= 0.80.2, FeMOS= 1.20.9). This value seems to be contradictory to the large equivalent widths of the iron line resulting from the fits including a power law and a gaussian or relativistically blurred line. Indeed, if we modify the best fit reflion model by setting the iron abundance to the lowest possible value (A=0.11) and replace the iron emission feature by a Gaussian line, we get an estimate of 170 eV for the equivalent width of the iron line. It is likely that the iron line fluxes from the power law based fits are overestimated, since these models do not account for the effect of the iron K absorption edge and as a result the slope of the power law becomes too steep. This explanation is confirmed by the fact that the iron equivalent width is largest for the fits with the steepest power law models (see Table 1 and 2). Therefore we consider the results of the physically consistent reflion model as more reliable.
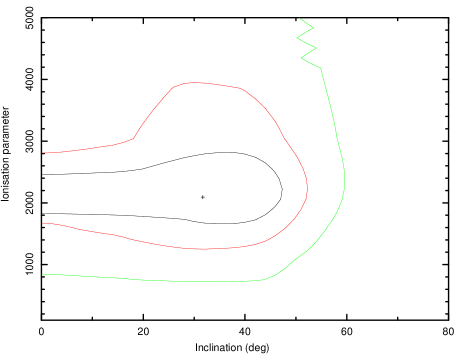
The best fitting ionisation parameters are =2000500 and =2000800. This result confirms that the reflecting parts of the accretion disk in RBS1423 are highly ionised. Figure 6 shows that the data cannot be fitted with a lower ionization parameter value and a different accretion disk inclination angle. Independent of the inclination angle, a highly ionised disk is needed.
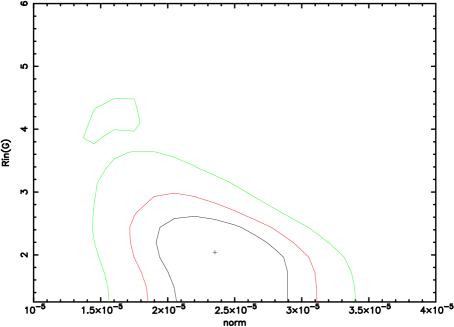
Fig. 7 shows the E2 f(E)-model spectrum for the reflion fit to the PN data. The best fit model is reflection-dominated with a very weak direct power law component. However, the errors in the normalisations of both the direct and reflected components are rather large.
The 0.2-12.0 keV X-ray flux of RBS1423 according to the model is erg cm-2 s-1. The rest-frame X-ray luminosity (0.2-12.0 keV) is . This makes RBS1423 one of the few X-ray luminous AGN with a detected broad iron fluorescence line.
Assuming is representing the bolometric luminosity, the accretion rate can be calculated by using
| (1) |
where is the gravitational constant and the efficiency parameter. If we set =0.1 the accretion rate is /yr. The further assumption that the accretion rate is 10% of the Eddington luminosity, leads to an approximate black hole mass of log =7.6. The discrepancy between optically and X-ray determined black hole mass of a factor 3 is consistent with the uncertainties of the used assumptions.


As an alternative to the disk refelection models we fitted a partial covering model (XSPEC model zpcfabs) to the EPIC spectra (see Tables 1 and 2) . The best fit absorbing column density is cm-2 with a covering fraction of 40% (PN). With values of /d.o.f.=420/376 (PN) and /d.o.f.=293/278 (MOS) the partial covering model fits the data equally as well as the ionised reflection model. Since the X-ray spectrum of RBS1423 does not show a strong soft excess, models with partial coverage by an ionised absorber do not fit the data well. For the PN spectrum the 90% upper limit for the ionisation parameter is .
6 Discussion and conclusions
We analysed an XMM-Newton observation (PN net time exposure 14.1 ksec) of RBS1423, a suspected high-luminosity QSO. We showed that the corresponding optical counterpart is a broad-line AGN at , thus correcting the identification in Schwope et al. (2000). The absolute magnitude in the -band of and the X-ray luminosity of (0.5-12 keV) classify the objects as a QSO. Several optical observations clearly indicate high optical variability and a strong UV excess.
In the X-ray spectrum of RBS1423 we detected a broad emission feature around 5 keV, which is well described by iron K fluorescence in the innermost parts of the accretion disk. This makes RBS1423 one of the most luminous radio-quiet AGN with a detection of relativistic disk reflection.
Alternatively, the X-ray spectrum can be modelled equally well with a partially covered power law model. The required column density is with a covering fraction of . Since the shape of a highly absorbed component is similar to the shape of a relativistically broadened iron line, even much better signal-to-noise EPIC spectra of Seyfert galaxies can be explained by both reflection and partial covering models. Fabian et al. (2004) successfully fitted the variable XMM-Newton spectra of the Seyfert galaxy 1H 0707-495 with ionised reflection models, while Gallo et al. (2004) modelled the same data with partial absorption.
The spectrum of RBS1423 does not show a strong soft excess. Therefore, the partial absorber must be neutral to avoid a strong contribution to the spectrum below 1 keV.
For a rather luminous AGN like RBS1423 a two-component model, where one component is not absorbed at all and the second is absorbed by a dense column of neutral gas, is hardly feasible (see also the discussion in Miniutti et al. (2006) on the possibility of a partial absorber in 3C 109). Therefore, we clearly favour disk reflection models to interpret the RBS1423 spectrum.
The energy of the line resulting from disk line fits is not consistent with K from neutral iron, but suggests the presence of highly ionised iron. This is confirmed by ionised disk model fits (reflion, Ross & Fabian 2005) resulting in an ionisation parameter . We compared the self-consistent ionised disk model fits with models including a power law and a broadened emission line. We conclude that the large equivalent line widths of the power law models are likely to be overestimated, since the underlying power law tends to be modelled too steeply when the iron edge is not taken into account.
Our detection adds a new piece of information to the ongoing debate about whether the accretion disks in high luminosity AGN are generally more highly ionised than in low luminosity objects. Nandra et al. (1997) find evidence for a change in the iron K line profile with increasing luminosity and also find an anti-correlation of broad-line equivalent width and luminosity (X-ray Baldwin effect). They attribute this correlation to the fact that ionisation increases with luminosity. Interestingly, the line profile in RBS1423 is similar to the average profile of the AGN in the range in Nandra et al. (1997), nearly symmetric with a strong blue wing.
On the other hand, no evidence for strong ionisation has been found in the disk reflection spectra of the luminous quasars PG 1425+267 (Miniutti & Fabian 2006) and 3C 109 (Miniutti et al. 2006). However, these quasars are radio-loud and therefore not fully comparable with RBS1423.
Porquet & Reeves 2003 found significant broad K reflection from neutral iron in the radio-quiet QSO Q0056-363, which is about twice as X-ray luminous as RBS1423. They conclude that the accretion rate of the object has to be less than of the Eddington accretion rate to avoid ionisation of the disk. This is at odds with other estimates of the accretion rate for this object. In another high luminosity radio-quiet QSO, E1821+643, a double peaked Fe profile was detected in the EPIC spectrum (Jimenéz-Bailón et al. 2007). The first peak is consistent with neutral iron, the second with FE xxv or Fe xxvi. However, the ionised iron line in the object could also be due to contamination by emission from a surrounding cluster of galaxies.
In summary, we strongly favour the relativistic disk line reflection over the partial covering model. The physically self-consistent ionised disk reflection model (Ross & Fabian 2005) yields a robust detection of disk ionisation. Therefore, we conclude that RBS1423 is one of the first radio-quiet QSO for which ionised disk reflection is established.
Acknowledgements.
Mirko Krumpe is supported by the Deutsches Zentrum für Luft- und Raumfahrt (DLR) GmbH under contract No. FKZ 50 OR 0404. Georg Lamer acknowledges support by the Deutsches Zentrum für Luft- und Raumfahrt (DLR) GmbH under contract no. FKZ 50 OX 0201.References
- Adelman-McCarthy et al. (2006) Adelman-McCarthy, J.K., Agueeros, M.A., Allam, S.S., et al. 2006, ApJS, 162, 38
- Arnaud et al. (1985) Arnaud, K.A., Branduardi-Raymont, G., Culhane, J.L., et al. 1985, MNRAS, 217, 105
- Crummy et al. (2006) Crummy, J., Fabian, A.C., Gallo, L., Ross, R.R., 2006, MNRAS, 365, 1067
- Dickey & Lockman (1990) Dickey, J.M. and Lockman, F.J., 1990, ARA&A, 28, 215
- Fabian et al. (1989) Fabian, A.C., Rees, M.J., Stella, L., et al. 1989, MNRAS, 238, 729
- Fabian et al. (2004) Fabian, A.C., Miniutti, G., Gallo, L., et al. 2004, MNRAS, 353, 1071
- Fabian et al. (2005) Fabian, A.C., Miniutti, G., Iwasawa, K., Ross, R.R., 2005, MNRAS, 361, 795
- Gallo et al. (2004) Gallo, L.C., Tananka, Y., Boller, Th., et al. 2004, MNRAS, 353, 1064
- Guainazzi, Bianchi, & Dovčiac (2006) Guainazzi, M., Bianchi, S., and Dovčiac, M., 2006, AN, 327, 1032
- George et al. (1998) George, I.M., Turner, T.J., Mushotzky, R., Nandra, K., and Netzer, H., 1998, ApJ, 503, 174
- Iwasawa & Taniguchi (1993) Iwasawa, K. and Taniguchi, Y., 1993, ApJ, 413, 15
- Jimenéz-Bailón et al. (2005) Jimenéz-Bailón, E., Piconelli, E., Guainazzi, M., et al. 2005, A&A, 435, 449
- Jimenéz-Bailón et al. (2007) Jimenéz-Bailón, E., Santos-Lleó, M., Piconelli, E., et al. 2007, A&A, 461, 917
- Laor (1991) Laor, A. 1991, ApJ, 376, 90
- Mason et al. (2001) Mason, K.O., Breeveld, A., Much, R., et al. 2001, A&A, 365, 36
- Miniutti & Fabian (2006) Miniutti, G., and Fabian, A.C., 2006, MNRAS, 366, 115
- Miniutti et al. (2006) Miniutti, G., Ballantyne, D.R., Allen, S.W., Fabian, A.C., and Ross, R.R., 2006, MNRAS, 371, 283
- Mushotzky et al. (1978) Mushotzky, R.F., Serlemitsos, P.J., Boldt, E.A., Holt, S.S., and Becker, R.H., 1978, ApJ, 220, 790
- Nandra et al. (1997) Nandra, K., George, I.M., Mushotzky, R.F., Turner, T.J., and Yaqoob, T., 1997, ApJ, 488, L91
- Nandra et al. (2006) Nandra, K., O’Neill, P.M., George, I.M., Reeves, J.N., and Turner, T.J., 2006, AN, 327, 1039
- Nandra & Pounds (1994) Nandra, K., Pounds, K.A., 1994, MNRAS, 268, 405
- Peterson et al. (2004) Peterson, B.M., Ferrarese, L., Gilbert, K.M., et al. 2004 ApJ, 613, 682
- Porquet & Reeves (2003) Porquet, D., Reeves, J.N., 2003, A&A, 408, 119
- Ross & Fabian (2005) Ross, R.R., Fabian, A.C., 2005, MNRAS, 358, 211
- Schwope et al. (2000) Schwope, A.D., Hasinger, G., Lehmann, I., et al. 2000, AN, 321, 1
- Smith et al. (2002) Smith, J.A., Tucker, D.L., Kent, S., et al. 2002, AJ, 123, 2121
- Tanaka et al. (1995) Tanaka, Y., Nandra, K., Fabian, A.C., et al. 1995, Nature, 375, 659
- Turner et al. (2002) Turner, T.J., Mushotzky, R.F., Yaqoob, T., et al. 2002, ApJ, 574, L123
- Vestergaard & Peterson (2006) Vestergaard, M., Peterson, B.M., 2006, ApJ, 641, 689
- Wilms et al. (2001) Wilms, J., Reynolds, C.S., Begelman, M.C., et al. 2001, AG, 18, 0120