Measured oscillations of the velocity and temperature fields in turbulent Rayleigh-Bénard convection in a rectangular cell
Abstract
Temperature and velocity oscillations have been found in a rectangular Rayleigh-Bénard convection cell, in which one large scale convection roll exists. At and , temperature oscillation can be observed in most part of the system and the oscillation period remains almost constant, seconds. Velocity oscillation can only be found in its horizontal component, (perpendicular to large scale circulation plane), near the cell sidewall, its oscillation period is also constant, seconds, at these positions. Temperature and velocity oscillations have different Ra dependence, which are respectively indicated by Peclect number and . In comparison to the case of cylindrical cell, we find that the velocity oscillation is affected by the system geometry.
pacs:
PACS numbers: 47.27.-i,47.27.Te,44.25.+f,05.65.+b.I INTRODUCTION
The coherent large-scale flow structure is one of the most important constituents in turbulent thermal convections, which occur widely in the oceans, the atmosphere, the earth’s outer core and galaxies Atkinson96 . Its detailed flow dynamics has been mainly investigated in the classical Rayleigh-Bénard convection system, where a confined enclosure is heated from below and cooled from above MALKUS54 ; Howard64 ; Siggia94 . The system has three control parameters, namely the Rayleigh number (), Prandtl number () and the aspect ratio (). The Rayleigh number is defined as , with being the gravitational acceleration, and , , and being, respectively, the thermal expansion coefficient, the kinematic viscosity, and the thermal diffusivity of working fluid. The Prandtl number is defined as Pr, and the aspect ratio is the ratio of the lateral dimension of the system to its height. In the system, a prominent self-sustained low frequency oscillation of the measured local velocity and/or temperature has been generally observed in numerous experiments and numerical simulations Howard64 ; Siggia94 ; Krishnamurti81 ; Heslot87 ; Sano89 ; Castaing89 ; Villermaux95 ; Takeshita96 ; Ciliberto96 ; Cioni97 ; Ashkenazi99 ; Krishnamurti99 ; Niemela01 ; Shang01 ; Qiu01n ; Qiu01 ; Qiu02 ; Qiu04 ; Shang04 ; Funfschilling04 ; Sun05 ; Sun05a ; Resagk06 ; Verdoold06 ; Puits07 . However, the origin of this characteristic frequency still remains elusive although much effort has been made to tackle this issue in the past decades.
Explanation of low frequency oscillations can be traced to the “bubble model” Howard64 and later the “plume model” Krishnamurti99 , which were developed based on the presence and persistence of thermal structures (e.g. thermals, plumes) MALKUS54 . It is assumed that a thermal boundary layer thickens in time by the upward diffusion of the temperature field. When a critical thickness is attained, the boundary layer will erupt and quickly expel all the buoyant fluid through plumes and thermals away from the boundary. The depleted boundary layer thus grows once more by diffusion and the process repeats in a periodic manner. Such a phenomenological picture has been observed in high Pr fluid with the shadowgraph technique Xi04 . In later experiments, it has been observed that the unique frequency is related to the large-scale circulation (LSC) in a helium gas cylindrical cell with Heslot87 ; Sano89 ; Castaing89 ; Qiu04 , and its value is more or less the same as the circulation frequency of the large convective flow. A coupled-oscillator model was proposed to explain the observed phenomenon, in which the plume clusters from one plate are triggered by those from the opposite plate and the overall process will be self-sustained Villermaux95 . A prediction of the model is that the oscillation period is twice of the cell-crossing time of the clustered plumes. This has been verified by later direct velocity measurements Qiu01n ; Qiu01 ; Sun05 . All the above mentioned models suggest that the thermal plumes and the thermal boundary layers play a dominant role in the generation of the oscillation.
In thermal convection, it has been found that, for the most part, the LSC has a preferred orientation in cylindrical cells and it oscillates azimuthally around this orientation Cioni97 ; Funfschilling04 ; Sun05 ; Brown06 ; Xi06 . Recently, several new dynamic processes, e.g. reorientation, cessation and so on, have been observed in the cylindrical cells Niemela01 ; Brown06 ; Xi06 , but it has been argued that such processes have little relevance to the azimuthal oscillation Fontenele05 . Based on the phenomenon of horizontal oscillations of LSC Funfschilling04 , a new dynamical model has been proposed Resagk06 ; Puits07 . This model suggests that the horizontal oscillation of large scale flow is the main source of the low frequency oscillation in the system. Instead of being caused by the periodic plume-ejections from the boundary layers, this horizontal oscillation is intrinsic to the bulk dynamics. The periodical ejections of plumes may then be viewed as passive objects of the process.
The LSC dynamical picture can be simplified if the large scale reorientations or cessations are not considered, the horizontal oscillation of LSC will be analogous to a classical harmonic oscillator wandering around its origin. In this case, one may wonder whether the system geometry plays a role in the horizontal oscillations of the LSC. In most cases experiments and simulations have been performed mainly in a cylindrical cell of aspect ratio one in which axis-symmetry holds and only one large scale convective roll exists Heslot87 ; Sano89 ; Castaing89 ; Villermaux95 ; Takeshita96 ; Krishnamurti99 ; Niemela01 ; Shang01 ; Qiu01n ; Qiu01 ; Qiu02 ; Qiu04 ; Shang04 ; Funfschilling04 ; Sun05 ; Sun05a ; Xi04 ; Brown06 ; Xi06 ; Puits07 . At low Ra, the linear stability analysis predicted that one asymmetric convection roll occupies the whole bulk regime when the cell provides an axis-symmetric boundary condition Charlson71 , and the convection roll could be aligned in any direction around the circle Golubitsky83 . But in real systems there are inevitably imperfections, initial instabilities and other external factors, which lead to the evolution of one stable branch, with all other branches being unstable Neumann90 . In numerical simulations, similar picture could be expected for the case of high Ra convection Verzicco97 .
In this paper, we report turbulent thermal convection experiments in a rectangular cell, in which the axis-symmetry is absent. Local velocity and temperature measurements at various locations were made over varying values of Ra and at a fixed Pr. We focus on the oscillatory behavior of measured local velocity and temperature fields. The remaining sections of the paper are organized as follows. In Sec. II we describe the rectangular convection cell and the velocity and temperature measurements. In Sec. III, we present and discuss the experimental results. There we first show the atuo-correlation functions and histograms of the velocity and temperature signals. We also discuss the spatial distribution of the velocity and temperature oscillations. We then present the Ra-dependence of the periods of these oscillations. A brief summary is given in Sec. IV.
II Experiment setup
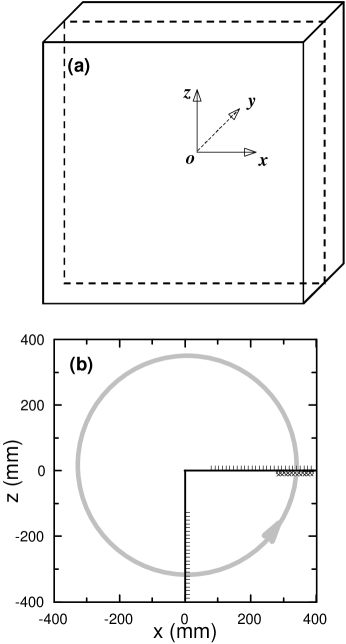
The convection cell has a square vertical cross section, its length, width, and height are (cm), as shown in Fig. 1 (a). With this geometry, the axis-symmetry does not exist, and the large-scale flow is expected to be largely confined in the plane with the aspect ratio . The working fluid was water. Detailed description of the apparatus can be found in Ref.Xia03 . Here the coordinates are defined as follows: the origin coincides with the cell center, its axis points to the right, the axis points upward, and the axis points inward. We measured the velocity and temperature signals at positions marked by the solid lines in Fig. 1 (b). The velocity was measured by Laser Doppler Anemometry (LDA), the measurement volume was approximately 0.12 mm in diameter and 1.1 mm in length Shang01 . Along the line (), two-dimensional velocity (, ) was measured, and velocity (, ) was measured along the line (). At each position or at least hrs statistically independent samples were acquired. The temperature measurement apparatus was similar to that described in Ref.Zhou01n . The local temperature was measured by using a thermistor about m in size. The thermistor served as one arm of an AC Wheatstone bridge driven sinusoidally at 1kHz in frequency and V in amplitude. The output of the bridge was first fed to a lock-in amplifier and then digitized by a dynamic signal analyzer at a sampling rate of Hz, the recording time was hrs to ensure good data statistics. Ra and Pr was kept at and respectively unless stated otherwise.
III Results and discussion
III.1 Autocorrelation function and histogram
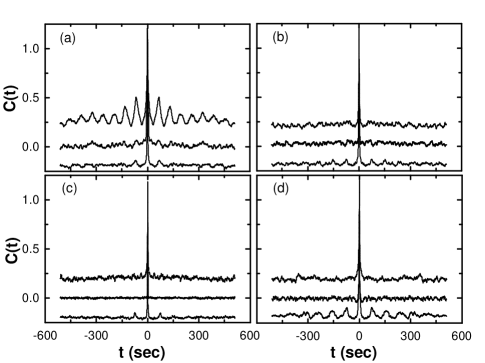
To test whether a low frequency oscillation exists we analyze the auto-correlation function, of these measured signals, here is the fluctuation of normalized by its RMS value, can be , , and and denotes the time average. Examples of the auto-correlations of , and at ( mm,0,0) near the sidewall are shown in Fig. 2 (a). An oscillation can be found in , whose intensity, represented by the magnitude of the second order peak, is as strong as that observed in the vertical velocity measurement near the sidewall of cylindrical cells Qiu04 ; Shang04 ; Shang01 . But the vertical velocity here shows no oscillation from its auto-correlation function, which differs from that in the cylindrical cells Qiu04 ; Shang04 ; Shang01 . The oscillation of temperature signal is much weaker than that in the cylindrical cell Shang04 , but the second order peak can be well resolved from the background noise fluctuation. The oscillation periods obtained from and are denoted as and respectively. When the measurement moves away from the sidewall to the region of the cell, as shown in Fig. 2 (b) where the location is ( mm,), the velocity oscillation can not be observed from both and components, whereas temperature oscillation can still be detected. In the measurement along the line (), two examples at (, mm) and (, mm) are shown in Fig. 2 (c) and (d) respectively, in which only temperature oscillation can be observed, the velocity one cannot be detected in either or component.
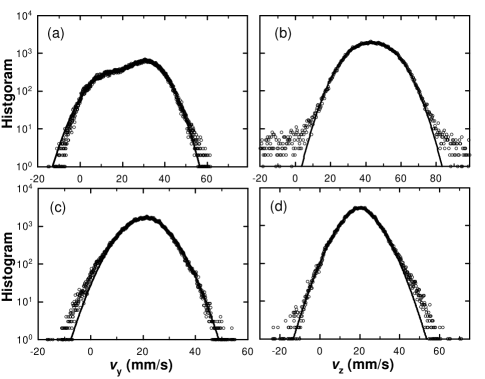
We now examine the histograms of these velocity signals, some examples are shown in Fig. 3. Along the line (), there are two peaks in the histogram of at location ( mm, ) (Fig. 3 (a)), and it can be fitted with a two-peak Gaussian function. The distribution of has two peaks which is consistent with the strong horizontal velocity oscillation shown in its auto correlation function (Fig. 2(a)). The histogram of (Fig. 3(b)) exhibits typical Gaussian-like distribution, it is also consistent with the property of its auto-correlation function (Fig. 2(a)). At location ( mm, ), both velocity components and have similar single-peaked histograms (Fig. 3(c) and (d)), they can be fitted by a stretched exponential function (), here the fitted is . We also examined the histograms for both the and velocity components along the line (), and find single-peaked Gaussian-like distributions for positions close to the bottom plate and stretched-exponential distribution for locations far away from the plate. Such results are consistent with the observations that no oscillation in their auto-correlation functions (Fig. 2(b), (c) and (d)).
It is a surprise that the oscillation in the velocity field cannot be observed in its vertical component . Similar finding has also been reported in the PIV measurement of the present system Xia03 , where no velocity oscillation has been seen in the large scale circulation plane. Such an observation is different from that in the cylindrical cell and does not support the “plume model” explanations Howard64 ; Krishnamurti99 ; Villermaux95 ; Qiu01n ; Qiu01 ; Qiu02 ; Xi04 ; Qiu04 ; Sun05 . If the thermal plumes are ejected from the conducting plates in a periodical manner Qiu02 ; Qiu04 ; Xi04 , the vertical velocity should contain an oscillatory component, as the thermal plumes are driven by the buoyancy force. The absence of this oscillation suggests that temperature and velocity oscillations may have different origins and be controlled by different mechanisms.
III.2 Spatial distribution
One can see that both temperature and velocity oscillations can be observed in the present system (although not in all positions). The positions where the oscillation can be found from and are marked in Fig. 1(b). The temperature oscillation can be detected in the range mm, mm along the line () and mm, mm along the line (). There is no temperature oscillation in the central region of the cell. We examine the data in the cylindrical cell of Ref.Zhou01 and find the same result. However in the cylindrical cell, it has been found that the temperature oscillation near the sidewall is much stronger than that near the bottom plate Qiu02 . Here we cannot distinguish where the temperature oscillation is obviously stronger from the auto correlations, as shown in Fig. 2, .
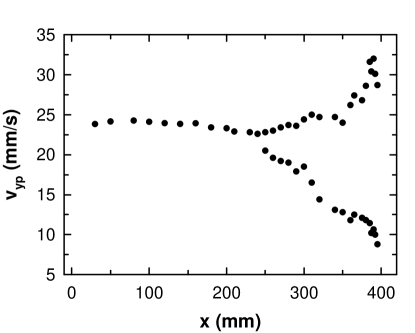
From Fig. 1(b), we can see that velocity oscillation can only be detected in its component near the sidewall ( mm, mm). Correspondingly, in these positions two peaks have been observed in the histogram of . The values of the peak positions in the histograms are shown in Fig. 4. The difference between the two peak values becomes smaller as the measuring position moves away from the sidewall to the central region, and the two values merge into one at around mm, where the oscillation becomes undetectable in the velocity field, as illustrated in Fig. 1. No oscillation can be found in other measured positions, including , mm along the line () and the whole line (). The result is in sharp contrast to what is observed in the cylindrical cell Qiu04 ; Sun05 . In the cylindrical cell, the oscillation could be found everywhere in the bulk regime from the horizontal velocity measurement, and the oscillating intensity is stronger in the center than that in other positions Sun05 . Recently, the oscillation has also been explored in a rectangular cell, where the horizontal cross section is square and the aspect ratio Verdoold06 . The authors found that the oscillation stems from the periodical switching between two corotating convective rolls. Therefore, the oscillations observed in the present system should not share the same dynamic mechanism as that case because only one large scale roll exists here Xia03 . Unlike the recent convection experiment in a rectangular box
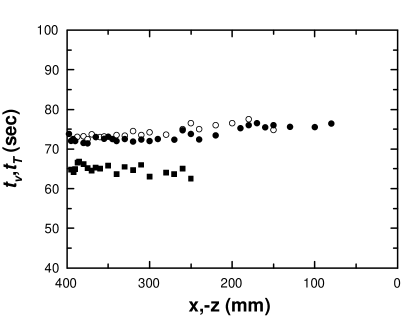
Next, we discuss the position dependence of the oscillation periods, and , obtained from temperature and velocity fields repectively. As shown in Fig. 5, we can see that within experimental uncertainty the temperature oscillation period () may be regarded as a constant for all the positions measured, seconds for both the vertical and horizontal scans. The fact that temperature oscillation can be observed in most part of the measured locations with the constant oscillation period implies that it is a global characteristic of the convective flow and the oscillation period is a typical time scale of the system. Oscillation of the velocity field can only be observed in a rather narrow region close to the sidewall, inside this region the turbulent intensity was found to be the strongest in the system Xia03 . The velocity oscillation period () also remains more-or-less constant for all the measuring positions, seconds. Note that is about less than , such a difference between the two oscillation periods is beyond the experimental uncertainties for the respective measurements.
III.3 Ra dependence
Keeping constant Pr, we also measured the oscillation periods ( and ) of temperature and velocity fields over the range of Ra from to . In order to compare to the results in previous literatures Takeshita96 ; Niemela01 ; Qiu02 ; Qiu04 ; Funfschilling04 ; Xia03 , is normalized in the form of the Peclet number (), here the subscript of denotes that it is obtained from either the temperature or velocity, and the typical velocity U is represented by . As shown in Fig. 6, we can see that and have comparable magnitude, but their difference can be well discerned. The Ra-dependence of can be fitted with . The exponent agrees excellently with the temperature oscillation measurements in low temperature helium gas Niemela01 , mercury Takeshita96 , and water Qiu02 of a cylindrical cell, the different prefactors are perhaps due to the fluids of different Pr. Moreover, the scaling is consistent with that of the angular oscillations of the horizontal thermal plume motion above the bottom plate in a cylindrical cell Funfschilling04 . This result confirms that the temperature oscillation is the global and universal character in thermal convection, and this result also implies that temperature oscillation period () is a result of flow motions of thermal structures and independent of system geometry. We also notice that some experiments have reported different scalings for temperature oscillation period () in the cylindrical cell Castaing89 ; Cioni97 ; Sun05a . One possible explanation is that the pathlength of the circulation affects the scaling of oscillation period Sun05a .
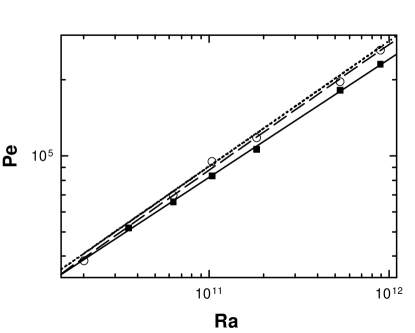
In the cylindrical cell, it was reported that the velocity oscillation follows and it is driven by the same mechanism as that of temperature Qiu02 ; Qiu04 . That is, the velocity and temperature oscillations are generated by the alternating emission of thermal plumes between the upper and lower thermal boundary layers Qiu04 . Moreover, it was found that both temperature and velocity oscillation periods are coincident with the rotational period of the large scale circulation Qiu01 ; Qiu01n ; Qiu04 . In the present system, the -dependence of is fitted as . In a previous PIV measurement Xia03 , the rotation rate of large scale circulation has been obtained, and the Pe could be fitted with the formula, , which is re-plotted in Fig. 6. We can see the Peclet number agrees this fitting line very well, but the temperature does not. These results suggest that the velocity oscillation period is consistent with the rotational period of the large scale flow in both cylindrical and rectangular cells, and both of them could be affected by the system geometry. Based on the results that temperature and velocity oscillations have different responses to the system geometry, it may be proposed that the two oscillations reflect different aspects of the thermal convective flow even though they are related to each other.
IV Conclusion
In this work, both temperature and velocity oscillations can be found in the rectangular cell, where only one large-scale convection roll exists. At fixed Ra (), it is found that temperature oscillation can be observed in most of the locations in which measurements were made, and they gave a position-independent oscillation period, seconds. For measurements made with different , the normalized oscillation period is found to scale as , which is the same as that found in cylindrical cells Takeshita96 ; Niemela01 ; Qiu02 ; Qiu04 . This scaling is also the same as that obtained from the horizontal motions of thermal structures (plumes) Funfschilling04 . This result suggests that temperature oscillation is a global and universal characteristic of turbulent thermal convection, and its statistical behavior may be related to the flow motions of thermal structures and are independent of system geometry.
It is a surprise that the oscillation in the velocity field cannot be seen in its vertical component near the sidewall. If the thermal bursts are erupted in a periodical way, it should be detected by the vertical velocity because the thermal bursts are driven vertically under the buoyancy force. However, velocity oscillation can only be observed in its horizontal component () at positions close to the sidewall, where its histogram exhibits two peaks. The normalized velocity oscillation period shows an Ra-dependence of and it collapses very well on that obtained from the rotation rate of convective flow Xia03 . This is different from the observation in the cylindrical cell Qiu04 , where it was reported that the periods for both the velocity and temperature oscillations and the rotational period of the convective flow follow the same scaling Qiu01n ; Qiu04 . This comparison suggests that the velocity oscillation period is consistent with that obtained from rotation rate of the large scale flow, and both of them could be affected by the system geometry.
We would like to thank G. Ahlers and H.-D. Xi for illuminating discussions. K.-Q. Xia was supported by Hong Kong RGC Grant 403705. S.-Q. Zhou was supported by CUHK direct grant 2060309 and United College research grant CA11096.
References
- (1) B. W. Atkinson and J. W. Zhang, Rev. Geophys. 34 403 (1996).
- (2) W. V. R. Malkus, Proc. Roy. Soc. A 225, 185 (1954).
- (3) L. N. Howard, Proc. 11th Cong. Applied Mech. (Ed. H. Grtler), 1109 (1964).
- (4) E. B. Siggia, Annu. Rev. Fluid Mech. 26, 136 (1994).
- (5) R. Krishnamurti and L. N. Howard, Proc. Natl Acad. Sci. USA 78, 1981 (1981.)
- (6) F. Heslot, B. Castaing, A. Libchaber, Phys. Rev. A 36, 5870 (1987).
- (7) M. Sano, X.-Z. Wu, and A. Libchaber, Phys. Rev. A 40, 6421 (1989).
- (8) B. Castaing, G. Gunaratne, F. Heslot, L. Kadanoff, A. Libchaber, S. Thomae, X.-Z. Wu, S. Zaleski, and G.-M. Zanetti, J. Fluid Mech. 204, 1 (1989).
- (9) E. Villermaux, Phys. Rev. Lett. 75, 4618 (1995).
- (10) T. Takeshita, T. Segawa, J. A. Glazier, and M. Sano, Phys. Rev. Lett. 76, 1465 (1996).
- (11) S. Ciliberto, S. Cioni, and C. Laroche, Phys. Rev. E 54, R5901 (1996).
- (12) S. Cioni, S. Ciliberto, and J. Sommeria, J. Fluid Mech. 335, 111 (1997).
- (13) S. Ashkenazi and V. Steinberg, Phys. Rev. Lett. 83, 3641 (1999).
- (14) R. Krishnamurti, Proc. Ind. Acad. Sci. 23, 605 (1999).
- (15) J. J. Niemela, L. Skrbek, K. R. Sreenivasan, and R. J. Donnelly, J. Fluid Mech. 449, 169 (2001).
- (16) X.-D. Shang and K.-Q. Xia, Phys. Rev. E 64, 065301(R) (2001).
- (17) X.-L. Qiu and P. Tong, Phys. Rev. Lett. 87, 094501 (2001).
- (18) X.-L. Qiu and P. Tong, Phys. Rev. E 64, 036304 (2001).
- (19) X.-L. Qiu and P. Tong, Phys. Rev. E 66, 026308 (2002).
- (20) X.-L. Qiu, X.-D. Shang, P. Tong, K.-Q. Xia, Phys. Fluids 16, 412 (2004).
- (21) X.-D. Shang, X.-L. Qiu, P. Tong and K.-Q. Xia, Phys. Rev. E 70, 026308 (2004).
- (22) D. Funfschilling and G. Ahlers, Phys. Rev. Lett. 92, 194502 (2004).
- (23) C. Sun, K.-Q. Xia, and P. Tong, Phys. Rev. E. 72, 026302 (2005).
- (24) C. Sun and K.-Q. Xia, Phys. Rev. E. 72, 067302 (2005).
- (25) C. Resagk, R. du Puits, A. Thess, F. V. Dolzhansky, S. Grossmann, F. F. Arauio, and D. Lohse, Phys. Fluids 18, 095105 (2006).
- (26) J. Verdoold, M. J. Tummers, and K. Hanjalic, Phys. Rev. E 73, 056304 (2006).
- (27) R. du Puits, C. Resagk, and A. Thess, Phys. Rev. E 75, 016302 (2007).
- (28) H.-D. Xi, S. Lam, and K.-Q. Xia, J. Fluid. Mech. 503, 47 (2004).
- (29) E. Brown and G. Ahlers, Phys. Fluids 18, 125108 (2006).
- (30) H.-D.Xi, Q.Zhou, and K.-Q.Xia, Phys. Rev. E 73, 056312 (2006).
- (31) F. Fontenele Araujo, S. Grossmann, and D. Lohse, Phys. Rev. Lett. 95, 084502 (2005).
- (32) G. S. Charlson and R. L. Sani, Int. J. Heat Mass Transfer 14, 2157 (1971).
- (33) M. Golubitsky and D. Schaeffer, Proc. Symp. Pure Math. 40, 499 (1983).
- (34) G. Neumann, J. Fluid Mech. 214, 559 (1990).
- (35) R. Verzicco and R. Camussi, Phys. Fluids 9, 1287 (1997).
- (36) K.-Q. Xia , C. Sun, S.-Q. Zhou, Phys. Rev. E. 68, 066303 (2003).
- (37) S.-Q. Zhou and K.-Q. Xia, Phys. Rev. E 63, 46308 (2001).
- (38) S.-Q. Zhou and K.-Q. Xia, Phys. Rev. Lett. 87, 064501 (2001).