Lineshape of the Hyperon Measured Through its Decay
Abstract
The reaction has been studied for hyperon masses MeV/c2 at COSY-Jülich by using a 3.65 GeV/c circulating proton beam incident on an internal hydrogen target. Final states comprising two protons, one positively charged kaon and one negatively charged pion have been identified with the ANKE spectrometer. Such configurations are sensitive to the production of the ground state and hyperons as well as the and resonances. Applying invariant– and missing–mass techniques, the two overlapping excited states could be well separated, though with limited statistics. The shape and position of the distribution, reconstructed cleanly in the channel, are similar to those found from other decay modes and there is no obvious mass shift. This finding constitutes a challenging test for models that predict to be a two-state resonance.
keywords:
Hyperon resonances, line shapesPACS:
14.20.Jn , 13.30.-a, , , , , , , , , , , , , ,
The excited states of the nucleon are a topical field of research, since the full spectrum contains deep-rooted information about the underlying strong colour force acting between the quarks and gluons. In addition to searching for missing resonances predicted by quark models [1], it is important to understand the structure of certain well established states, such as the hyperon resonance.
Although a four–star resonance [2], and known already for many years, the dynamics of the are still not fully understood. Within the quark model it can be explained as a –wave baryon [3]. It is also widely discussed as a candidate for a molecular state [4], or for one with a more intrinsic pentaquark structure [5]. If the is a dynamically generated resonance produced via rescattering within a coupled–channel formalism [6, 7], it may consist of two overlapping states [8, 9, 10]. Its decay spectrum would then depend upon the production reaction. Due to the opening of the channels, the lineshape is not represented satisfactorily by a Breit–Wigner resonance [4, 11, 12, 13]. Nevertheless, if the were a single quantum state, as in the quark model or molecular pictures, its lineshape should be independent of the production method.
Part of the difficulty in elucidating the nature of the is due to it overlapping the nearby . The interference between these two states can distort significantly the and spectra [6], for which there are experimental indications [14]. This interference can be eliminated by taking the average of and data [11] but the cleanest approach is through the measurement of the channel, since isospin forbids this for decay. This is the technique that we want to develop here and, although our statistics are rather poor, these are already sufficient to yield promising results.
We have used data obtained during high statistics –production measurements with the ANKE spectrometer [15] to study the excitation and decay of low–lying hyperon resonances in collisions at a beam momentum of 3.65 GeV/c in an internal–ring experiment at COSY–Jülich. A dense hydrogen cluster–jet gas target was used and over a four–week period this yielded an integrated luminosity of , as determined from elastic scattering that was measured in parallel and compared with the SAID 2004 solution [16].
The detection systems of the magnetic three–dipole spectrometer ANKE simultaneously register and identify both negatively and positively charged particles [17]. Forward (Fd) and side–wall (Sd) counters were used for protons, telescopes and side–wall scintillators for , and scintillators for . Since the efficiencies of the detectors are constant to 2% () across the momentum range of registered particles, any uncertainty in this can be neglected in the further analysis.
The basic principle of the experiment is the search for four–fold
coincidences, comprising two protons, one positively charged kaon
and one negatively charged pion, i.e., . Such a configuration can correspond, e.g., to the
following reaction chains involving the and
as intermediate states:
(1)
(2) .
In the case, the residue is , while for the , . The resonances overlap significantly because the widths of 36 MeV/c2 for and 50 MeV/c2 for are much larger than the mass difference [2]. The strategy to discriminate between them is to: (i) detect and identify four charged particles , , and in coincidence, thereby drastically reducing the accidental background at the expense of statistics, (ii) select those events for which the mass of a () pair corresponds to that of the , (iii) select the mass of the residue to be that of the to tag the , and for the .
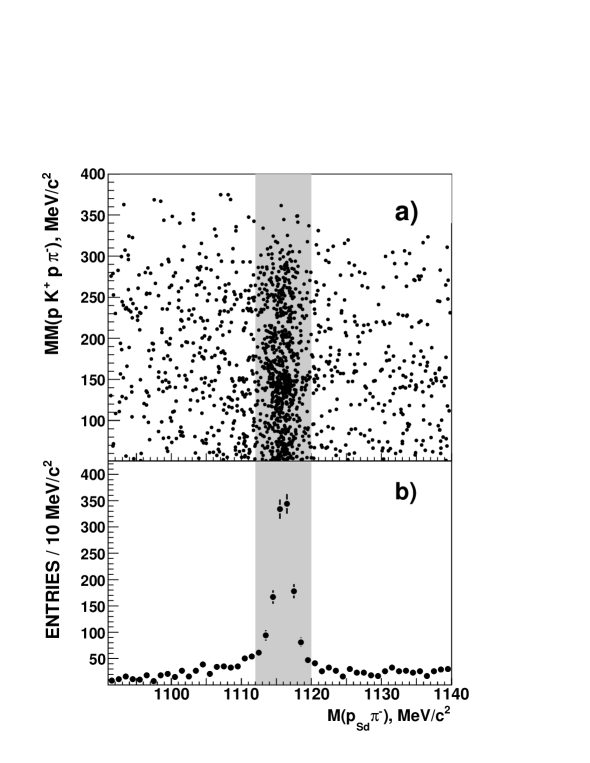
Figure 1a shows the two–dimensional distribution of the four–particle missing mass of the pairs versus the invariant mass . A vertical band corresponding to the , is visible around a mass of 1116 MeV/c2. The features of this band are illustrated clearly in the projection onto the axis shown in Fig. 1b. The peak, with a FWHM of MeV/c2, sits on a slowly varying background, much of which arises from a false association (the combinatorial background).
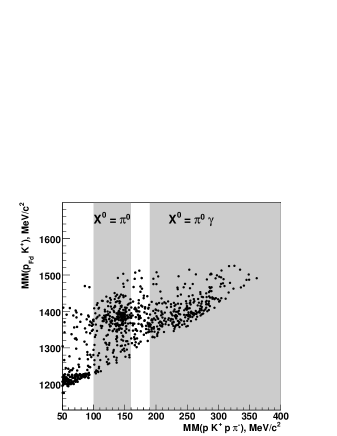
Data within the invariant–mass window 1112–1120 MeV/c2 were retained for further analysis and, in Fig. 2, is plotted against for these events. The triangular–shaped domain arises from the constraint . Despite the lower limit of 50 MeV/c2 on , there is a background from production at the bottom of the triangle, but this can be easily cut away. The enhancement for MeV/c2 corresponds to and production. The two vertical bands show the four–particle missing–mass criteria used to separate the from the . The left band is optimised to identify a whereas, in view of the missing–mass resolution, the right one selects masses significantly greater than .
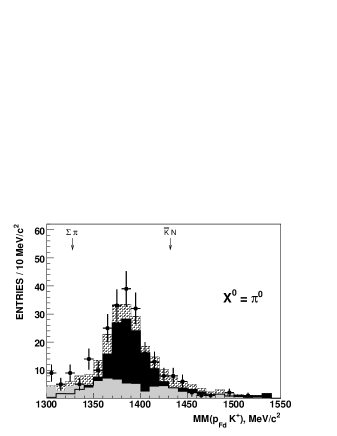
Since the properties of the are undisputed [2], we first present and discuss results for this hyperon as a test case for the analysis. In Fig. 3 we show the experimental missing–mass spectrum for events within the –band of Fig. 2. When this is fit with a Breit–Wigner distribution plus a linear background, a mass of and a width of MeV/c2 are obtained, in good agreement with the PDG values [2]. The resonance is located half way between the and thresholds, indicated by arrows in Fig. 3, and no significant influence of either threshold is observed in the data.
To investigate possible contributions to the spectrum other than from the excitation, Monte Carlo simulations were performed for backgrounds from non–resonant and resonant production. The first group of reactions includes processes such as and , with representing any allowed or hyperon. The second group comprises and hyperon production. The simulations, based on the GEANT3 package, were performed in a similar manner to those in Ref. [18]. Events were generated according to phase space using relativistic Breit–Wigner parametrisations for the known hyperon resonances [2]. Their relative contributions were deduced by fitting the experimental data, giving the results shown by the histograms of Fig. 3. Also included is a small contribution from the channel, arising from the tail of the missing–mass events in Fig. 2 leaking into the region. As expected, the peak dominates over a small and smooth background.
In order to estimate the total production cross section we used the overall detector efficiency of and the cumulative branching ratio of for the decay chain corresponding to reaction (1). With the calculated acceptance of and the number of events equal to , we find
at GeV/c. The systematic uncertainty in the fitting procedure and cross section evaluation was estimated by varying some of the event selection parameters, such as the width of the bands or the range for the peak (see Fig. 1), or the non–resonant background in Fig. 3. The cross section is only a little lower than at 6 GeV/c, b [19], whereas that for increases by a factor of four over a similar change in excess energy [20].
Turning now to the , simulations show that the does not contaminate the missing–mass range above 190 MeV/c2. This point is crucial since it allows us to obtain a clean separation of the and . There is the possibility of some contamination from the channel but there is only a limited amount of the five–body phase space available near the maximum missing mass. Simulations also show that the ANKE acceptance varies only marginally in the mass range around 1400 MeV/c2. The corresponding experimental missing–mass spectrum is shown in Fig. 4a. The asymmetric distribution, which peaks around 1400 MeV/c2, has a long tail on the high missing–mass side that extends up to the kinematical limit.
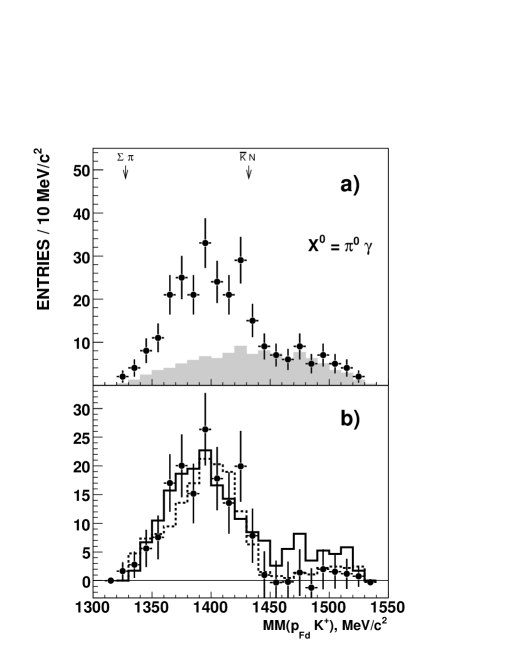
In order to extract the distribution from the measured decay, a different strategy has been applied, where we first fit the non–resonant contributions to the experimental data. The fit was performed for MeV/c2 to exclude heavier hyperon resonances, such as the . The resulting non–resonant background is indicated by the shaded histogram in Fig. 4a. When this is subtracted from the data we obtain the distribution shown as experimental points in Fig. 4b.
Our background–subtracted data exhibit a prominent structure around 1400 MeV/c2. There is no indication of a second near 1500 MeV/c2, which might result from the production of the [11]. The excess of at most 20 events for leads to an upper limit for the production cross section of b. The smallness of the signal in this case would be largely due to the low branching of only 9% into this channel. There is no evidence either for a significant contribution from the hyperon [18]. If this state were the same as the one–star of Ref.[2], the decay into would be forbidden. However, this state is also not seen in the reaction [21].
We finally turn to the contribution from lower missing masses. From the number of events with MeV/c2, equal to , we find a total production cross section of
at GeV/c. The cumulative branching ratio for the decay chain of reaction (2) of and the acceptance of have been included, as well as the overall detection efficiency of .
The invariant–mass distributions have been studied in two hydrogen bubble chamber experiments. Thomas et al. [13] found or events corresponding to the reaction at a beam momentum of 1.69 GeV/c. Hemingway [11] used a 4.2 GeV/c kaon beam to investigate . For the final state, the mass spectrum is distorted by the confusion between the two positive pions. Thus, in the comparison with our data, we use only the distribution, which contains 1106 events [11].
In Fig. 4b our experimental points are compared to the results of Thomas and Hemingway, which have been normalised by scaling their values down by factors of 3 and 7, respectively. The effect of the threshold is apparent in these published data, with the mass distribution being distorted by the opening of this channel. Despite the very different production mechanisms, the three distributions have consistent shapes. A fit of one to either of the others leads to a /ndf of the order of unity though, as pointed out in Ref. [6], for production [11] there is likely to be some residual distortion from channels. The data yield a somewhat different distribution [22] but, as noted in this reference, the uncertainty as to which originated from the “smears the resonance signal in the spectra”. The situation is therefore very similar to that of the Hemingway data [11] and such results can only be interpreted within the context of a specific reaction model, such as that of Ref. [9].
Models based on unitary chiral perturbation theory find two poles in the neighborhood of the which evolve from a singlet and an octet in the exact SU(3) limit [8, 9]. One has a mass of 1390 MeV/c2 and a width of 130 MeV/c2 and couples preferentially to . The narrower one, located at 1425 MeV/c2, couples more strongly to , whose threshold lies at 1432 MeV/c2. Both states may contribute to the experimental distributions, and it is their relative population, which depends upon the production mechanism, that will determine the observed lineshape. Our experimental findings show that the properties (mass, width, and shape) of the resonance are essentially identical for these three different production modes.
In summary, we have measured the excitation of the and hyperon resonances in proton–proton collisions at a beam momentum of 3.65 GeV/c. We have succeeded in unambiguously separating the two states through their and decay modes. Cross sections of the order of a few b have been deduced for both resonances. The , as measured through its decay, has a shape that is consistent with data on the charged decays [11, 13], with a mass of MeV/c2 and width of MeV/c2. This might suggest that, if there are two states present in this region, then the reaction mechanisms in the three cases are preferentially populating the same one. However, by identifying particular reaction mechanisms, proponents of the two–state solution can describe the shape of the distribution that we have found [10].
The channel is by far the cleanest for the observation of the since it is not contaminated by the nor the confusion regarding the identification of the pion from its decay. However, although we have shown that the method works in practice, in view of our limited statistics, further data are clearly needed. The decay can be detected directly in electromagnetic calorimeters. Corresponding measurements are under way in reactions (CB/TAPS at ELSA [23], SPring8/LEPS [24]) and are also planned in interactions with WASA at COSY [25].
We acknowledge many very useful discussions with E. Oset. We also thank all other members of the ANKE collaboration and the COSY accelerator staff for their help during the data taking. This work has been supported by COSY-FFE Grant, BMBF, DFG and Russian Academy of Sciences.
References
- [1] S. Capstick and W. Roberts, Prog. Part. Nucl. Phys. 45 (2000) S241.
- [2] W.-M. Yao et al., J. Phys. G 33 (2006) 1, but see also the minireview in D.E. Groom et al., Eur. Phys. J. C 15 (2000) 1.
- [3] N. Isgur and G. Karl, Phys. Rev. D 18 (1978) 4187.
- [4] R.H. Dalitz and S.F. Tuan, Ann. Phys. (N.Y.) 10 (1960) 307.
- [5] T. Inoue, Nucl. Phys. A 790 (2007) 530.
- [6] J.C. Nacher, et al., Phys. Lett. B 455 (1999) 55.
- [7] J.A. Oller and Ulf-G. Meißner, Phys. Lett. B 500 (2001) 263.
- [8] D. Jido et al., Nucl. Phys. A 725 (2003) 181.
- [9] V.K. Magas, E. Oset and A. Ramos, Phys. Rev. Lett. 95 (2005) 052301.
- [10] L.S. Geng and E. Oset, arXiv:0707.3343 [hep-ph].
- [11] R.J. Hemingway, Nucl. Phys. B 253 (1984) 742.
- [12] R.H. Dalitz and A. Deloff, J. Phys. G 17 (1991) 289.
- [13] D.W. Thomas, et al., Nucl. Phys. B 56 (1973) 15.
- [14] J.K. Ahn, Nucl. Phys. A 721 (2003) 715c.
-
[15]
M. Hartmann et al., COSY Proposal # 104,
www.fz-juelich.de/ikp/anke/en/proposals.shtml (2002). - [16] R.A. Arndt, I.I. Strakovsky, and R.L. Workman, Phys. Rev. C 62 (2000) 034005; http://gwadc.phys.gwu.edu, SAID solution SP04.
- [17] S. Barsov et al., Nucl. Instr. Meth. A 462 (2001) 364.
- [18] I. Zychor et al., Phys. Rev. Lett. 96 (2006) 012002.
- [19] S. Klein et al., Phys. Rev. D 1 (1970) 3019.
- [20] A. Sibirtsev et al., Eur. Phys. J. A 29 (2006) 363.
- [21] S. Prakhov et al., Phys. Rev. C 69 (2004) 042202(R).
- [22] S. Prakhov et al., Phys. Rev. C 70 (2004) 034605.
- [23] H. Schmieden, ELSA Letter of Intent ELSA/4-2003.
- [24] H. Fujimura, AIP Conf. Proc. 915 (2007) 737.
- [25] H.-H. Adam et al., nucl-ex/0411038.