Identification of Very Red Counterparts of SiO Maser and OH/IR Objects in the GLIMPSE Survey
Abstract
Using the 3.6/4.5/5.8/8.0 m images with 1.2″ pixel resolution from the Spitzer/GLIMPSE survey, we investigated 23 masing and 18 very red objects that were not identified in the 2MASS survey. Counterparts for all selected objects were found in the GLIMPSE images. Color indices in these IR bands suggest the presence of a high-extinction layer of more than a few tenths of a solar mass in front of the central star. Furthermore, radio observations in the SiO and H2O maser lines found characteristic maser-line spectra of the embedded objects, e.g., the SiO –0 line intensity in the state stronger than that of the state, or very widespread H2O maser emission spectra. This indicates that these objects are actually enshrouded by very thick circumstellar matter, some of which cannot be ascribed to the AGB wind of the central star. Individually interesting objects are discussed, including two newly found water fountains and an SiO source with nebulosity.
1 Introduction
The discovery of stellar maser sources (Wilson & Barrett, 1968) and their association with very red infrared objects has led to a new class of objects called OH/IR stars. From the OH profiles, we came to the realization that the maser emissions are a manifestation of the mass loss process (Kwok, 1976), and OH/IR stars are likely to be stars in the asymptotic giant branch (AGB) phase of evolution (Habing, 1996; Sevenster et al., 2002). The mass loss process also creates a thick circumstellar dust envelope which often obscures the central star. Although OH/IR stars are often bright mid-infrared objects (Jiménez-Esteban et al., 2006), many of them have no optical or near infrared counterparts. In the absence of a spectral classification based on photospheric spectroscopy, the nature of these stars is classified based on the circumstellar spectra in the mid-infrared (Kwok, Volk, & Bidelman, 1997).
It should be noted that the mid-infrared colors alone are not enough to determine the nature of maser sources. For example, the IRAS colors of mass-losing evolved stars overlap with colors of young stellar objects embedded in molecular clouds (van der Veen & Habing, 1988), and there is no well-defined boundaries in the color-color diagram between young and evolved stars (Weintraub, 1990). The maser characteristics by themselves are not enough to distinguish the two classes of objects (Caswell, 1999). The situation for SiO maser sources is also complex. For example, there are three SiO maser sources in molecular clouds (Hasegawa, 1985; Morita et al., 1992) that are likely to be young stellar objects. There are also peculiar cases, such as the SiO maser source IRAS 19312+1950 is an evolved star in a dark cloud (Nakashima et al., 2004; Deguchi et al., 2004c), and V838 Mon is an M supergiant with SiO emission which emerged after nova eruption (Deguchi et al., 2005b; Tylenda & Soker, 2006).
In some cases, the imaging and identification of the central star in NIR bands can greatly facilitate the determination of the nature of these objects (Lewis et al., 2004; Deguchi et al., 2005a). Young, low-mass stars are usually born in a star cluster, but evolved stars, especially AGB/post-AGB stars with the ages of Giga years, are observed as a single object (see 3 of Deguchi et al., 2004c). However, for the case of supergiants, they are frequently a member of stellar associations (Humphreys, 1970), suggesting they are on their way towards leaving the originating star clusters. Deep infrared imaging can help find the surrounding low-mass stars.
The recently performed Galactic Legacy Infrared Mid-Plane Survey Extraordinaire (GLIMPSE) of the Spitzer Space Telescope (SST) has provided unprecedented deep near-infrared images of the Galactic plane. Because of the high angular resolution 1.2″ per pixel) of the GLIMPSE observations, we have the opportunity to obtain an accurate identification of the infrared/maser sources. In this paper, we report the identification of 41 infrared sources from the GLIMPSE data, as well as SiO or H2O maser observations of these sources with the Nobeyama 45-m telescope.
2 Observations
2.1 Source selection
We selected 41 sources from the Midcourse Space Experiment (MSX) Galactic plane survey that are found to have no (or dubious) near-infrared counterparts in the 2MASS sky survey (Skrutskie et al., 2000). Half of these (22 objects) are OH/IR objects listed by Sevenster et al. (2001), te Lintel-Hekkert et al. (1991), Eder et al. (1988), etc. The positional accuracy of the MSX positions is about a few arcseconds (Egan et al., 1999), comparable to the positional accuracies of OH masers measured with the Very Large Array (VLA) [see figure 9 of Deguchi et al. (2002) for comparison]. Most of these objects have reasonably red mid-IR colors with between 0 and 0.5, where and are the MSX band C (12 m) and band E (21 m) flux densities, respectively.
In addition to the MSX sources, we have included a number of medium-bright and red IRAS sources without 2MASS counterparts for which no maser line search was made. These are IRAS 180301858, 181511713, 182411010, 182980904, 184240509, 184440359, 19011+0638, 19025+0702, 19087+1006, 19112+1220, 19114+0920, 19180+1230, 19254+1724, 19266+1815, 19275+1720, G014.275800.1602, G027.843300.1060. The MSX colors of these objects are not much different from those of the above OH/IR sources without NIR counterparts. The entire sample we chose for identification in the Spitzer/GLIMPSE survey is listed in table 1, giving the source name, MSX(6C) name, right ascension and declination (J2000) of the MSX source, flux density in the MSX C (12m) band, the MSX colors [, and ], status of detections in SiO, H2O, and OH masers, and a conventional OH object name.
2.2 Spitzer/GLIMPSE Identification
The GLIMPSE survey was made with SST between March and November, 2004 using the Infrared Array Camera (IRAC) (Indebetouw et al., 2004). The survey covered the area of –65∘ over latitudes toward the inner Galactic disk excluding the Galactic center. Simultaneous images at 3.6, 4.5, 5.8 and 8 m were obtained at a spatial resolution of per pixel.
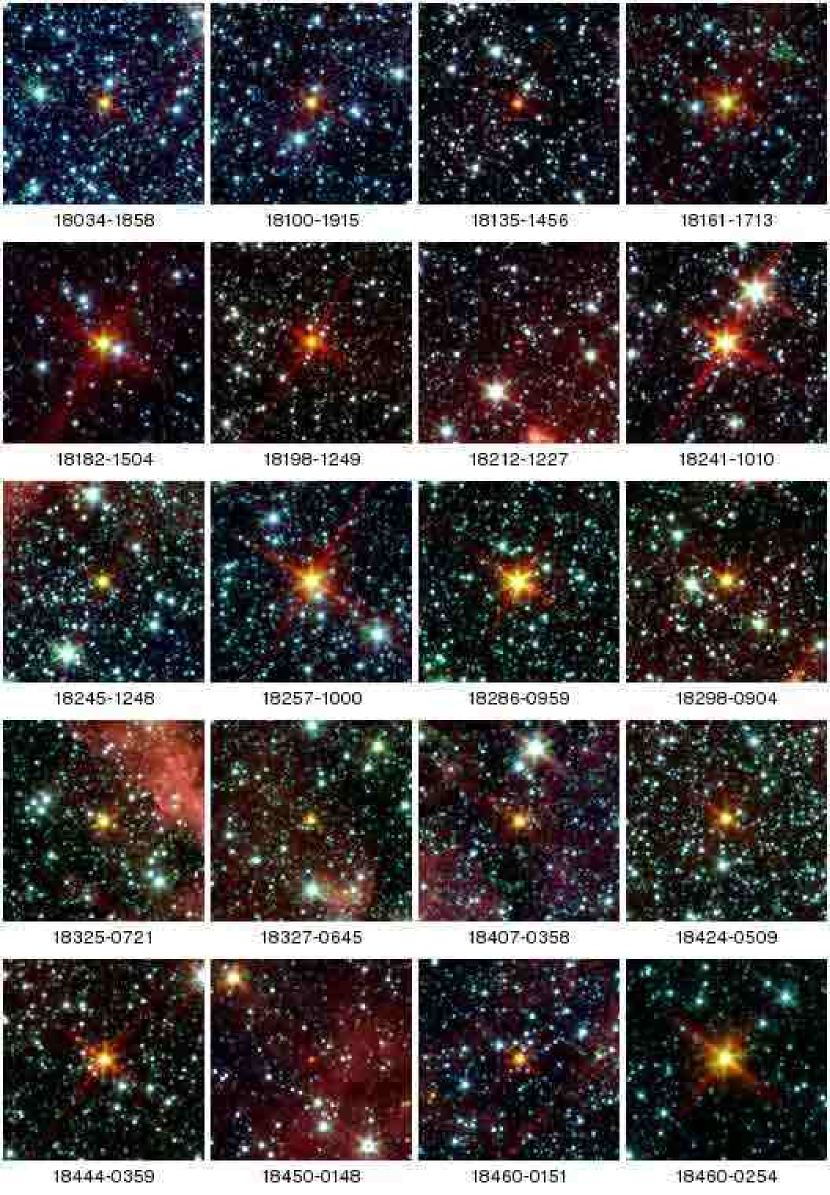
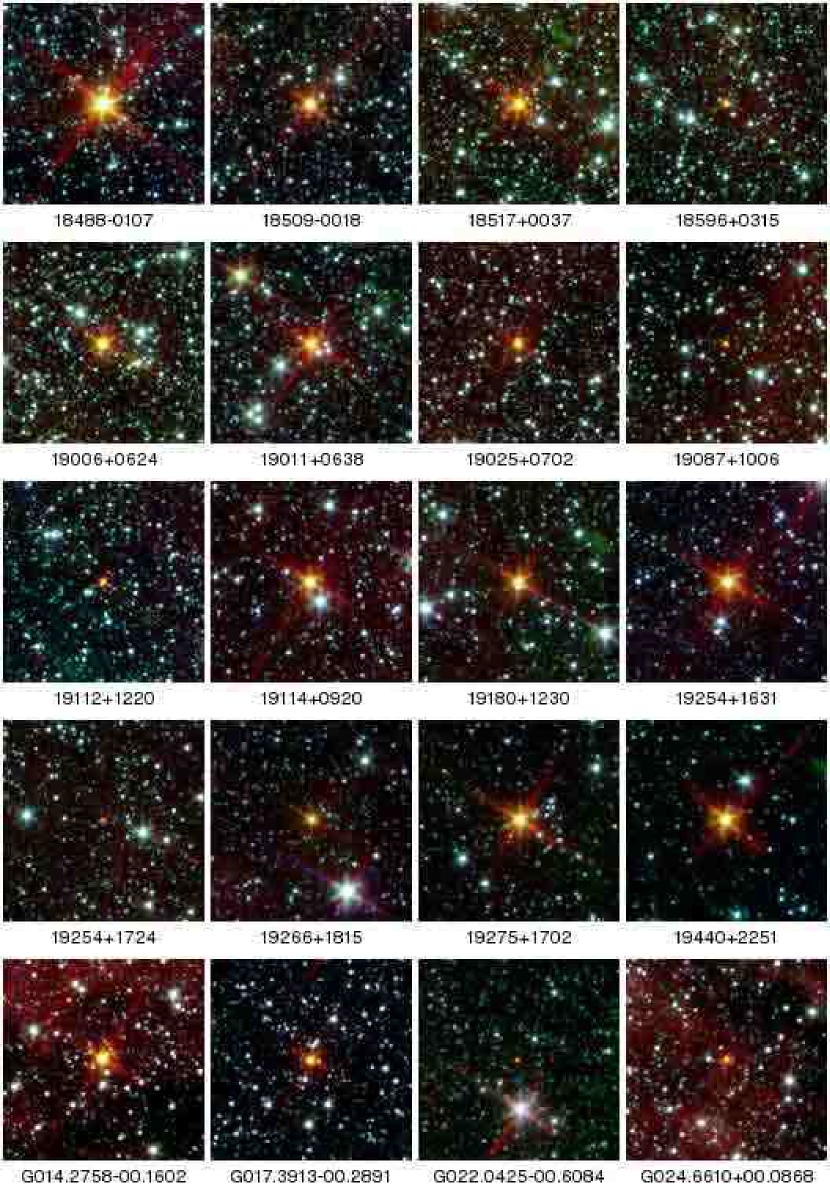
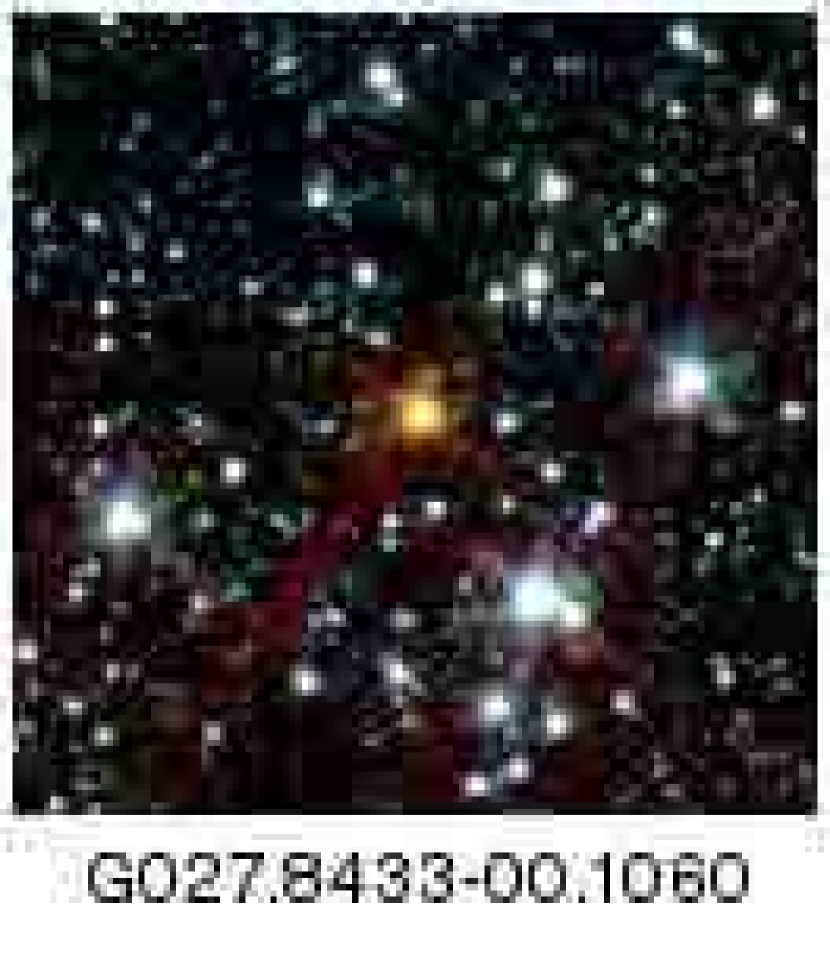
The color-composite images (from the 3.6, 4.5 and 5.8 m band images) toward the 41 selected objects are shown in Figure 1. The counterparts for all sources in our sample were found; they are all very red and near the center of the images. Because all of these objects are bright in 8 m, the identifications in other bands were made quite easily. The color images were created with special software developed at the Space Astronomy Laboratory of the University of Calgary. The flux densities were derived from the GLIMPSE archives; the aperture size used for photometry was typically a few to 12 arcseconds, depending on the image size of the star. The estimated error of the photometry is dependent on the background noise levels, and are typically for the objects brighter than 1, 3, 7, 16 mJy at the 3.6, 4.5 and 5.8 m bands respectively. The flux densities are given in columns 4–7 in table 2. The color indices, and , are also listed in the 8th and 9th columns in table 2. Here, [3.6], [5.8], and [12] are the magnitudes in the GLIMPSE 3.6 and and 5.8 m, and MSX 12 m bands, respectively, and the flux densities at 0th magnitude are 280.9, 115.6, and 26.4 Jy in these bands, respectively. The interstellar extinction toward each object is given in the 10th column of table 2 and it is estimated by the formula based on the full-sky 100 m composite map of COBE/DIRBE and IRAS maps (Schlegel et al., 1998).111 available at http://nedwww.ipac.caltech.edu/forms/calculator.html.
After getting accurate GLIMPSE positions (the 2nd and 3rd columns in table 2), we again checked the 2MASS images and found the red counterparts corresponding to the positions of 4 sources; 182860959 (183122920957194), 182980904 (183237000902301), 19275+1902 (19294645+1709013), and 19266+1815 (19285303 +1821228). These counterparts are very faint in the K-band (–14.7), making previous identifications uncertain. Their positions coincide with those of the GLIMPSE objects within 0.5″. Jiménez-Esteban et al. (2006) listed NIR counterparts for 5 objects in the present sample: 181821504, 184600254, 184880107, 19087+1006, and 19254+1631. Because of the faintness of the objects (), their identifications were again doubtful. We have checked the GLIMPSE positions of these objects and found that 181821504, 184600254, and 19254+1631 were correctly identified, but 184880107 and 19087+1006 were misidentified; the GLIMPSE objects are located 5″NE and 6″S of the 2MASS stars (13.05 and 14.10) given by Jiménez-Esteban et al. (2006).
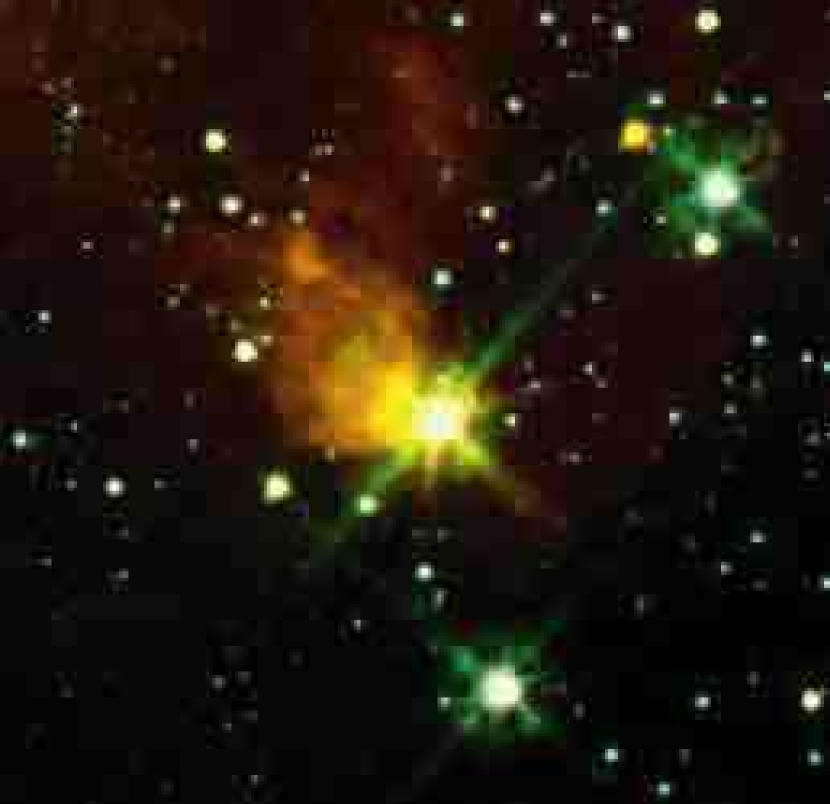
In addition to the above selected objects without 2MASS counterparts, we checked the GLIMPSE images of about 200 SiO maser sources within the area of – 60∘, and where the near-infrared identifications are already available (Deguchi et al., 1998, 2001, 2002). The GLIMPSE images mostly exhibit a single bright object at the center of the field, except for IRAS 19027+0517, which shows accompanying nebulosity (Fig. 6). Because this object has a NIR counterpart in 2MASS images and seems to be intrinsically different from the objects in our sample, we gave a discussion of this object separately in Appendix A.
We wish to make a special reference to IRAS 184500148 (W43A), which is known as a water maser fountain with collimated outflows (Imai et al., 2002). The detection of SiO maser emission in this object (Nakashima & Deguchi, 2003b) suggests that this is an evolved star. The near-infrared counterpart of this interesting object is identified here for the first time.
2.3 SiO and H2O maser observations at Nobeyama
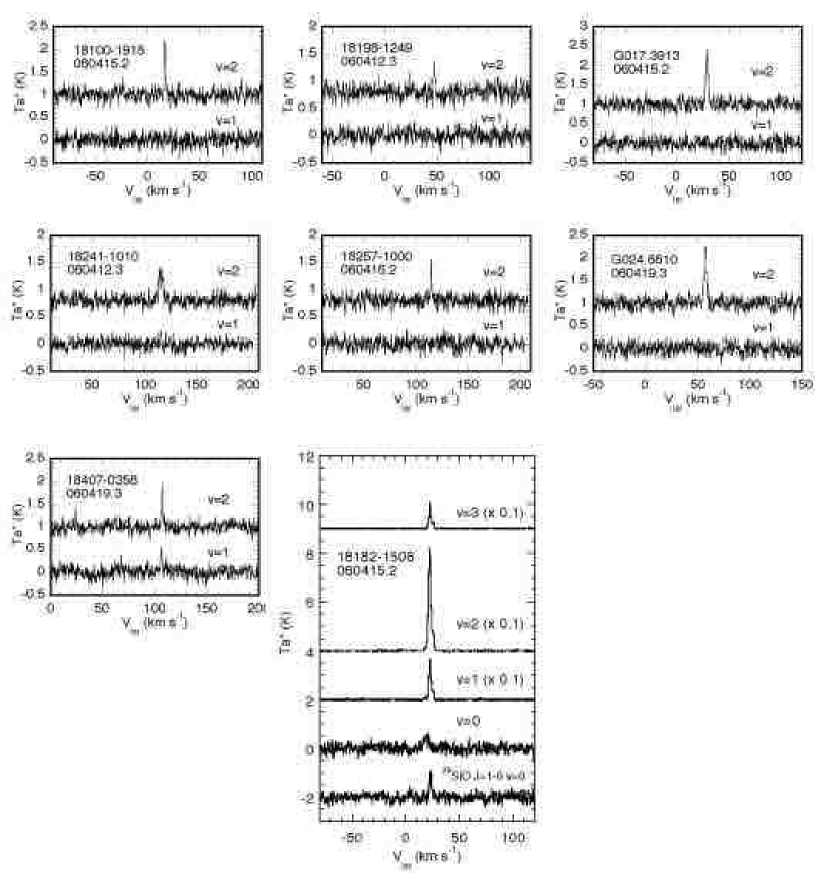
Because a majority of objects in our sample have not been searched for SiO or H2O maser emissions before, we observed the objects in SiO –0 and 2 and H2O – maser lines with the 45-m telescope at Nobeyama during April 10–23, 2006. A cooled HEMT receiver (H40) and an accousto-optical spectrometer array were used for the 43 GHz observations. The receiver system temperature was about 200 K and the effective velocity resolution is 0.3 km s-1. The half-power beam width (HPBW) at 43 GHz was 40′′ and the conversion factor of the antenna temperature to the flux density was 2.9 Jy K-1. In addition to the SiO maser observations, we made a 22.235 GHz H2O maser observation on April 20 and 23, when weather was unfavorable for 43 GHz observations. We used a cooled HEMT receiver (H22) and the same accousto-optical spectrometer array (with an effective velocity resolution of 0.6 km s-1). The conversion factor of the antenna temperature to the flux density was 2.8 Jy K-1 at 22 GHz. Because the H40 and H22 receivers have a 2 GHz band width, we configured the AOS-H spectrometer array to have the spectra of the SiO –0 (43.423 GHz), and (42.519 GHz), 29SiO –0, v=0 (42.880 GHz), and H53 (42.952 GHz) lines simultaneously in the H40 receiver, and NH3 –, –, and – lines (23.694, 23.722, 23.870 GHz, respectively) simultaneously in the H22 receiver. The rms noise temperatures for these additional lines are similar to the noise levels of the SiO and H2O lines and therefore are not repeated in tables 3 and 4. No detections in these additional lines were obtained except for 181821504. Further details of observations using the NRO 45-m telescope are described elsewhere (e.g., Nakashima & Deguchi, 2003a).
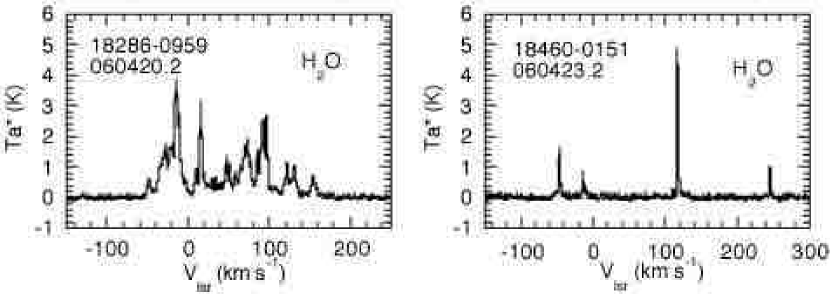
Among the 31 objects observed, 8 were detected in SiO and their spectra are shown in Fig. 2. In all cases, the maser line is stronger than the maser line. Water masers in the – transition were detected in two sources (182860959 and 184600151) and their spectra are shown in Fig. 3. It is notable that both of the detected objects exhibit a wide velocity range in the H2O maser emission spectra, which resemble the H2O spectra of “water fountains” (Morris et al., 2003).
Because some of our sample objects might be associated with young stellar objects in molecular clouds, we also made simultaneous observations of the HCO–0 line at 89.189 GHz and the SiO –1 line. The non-detection of the HCO+ line effectively excludes the possibility of these water maser sources being associated with young stellar objects.
3 Discussion
3.1 Two-color diagram
The selected objects have extremely thick circumstellar envelopes. In addition, they suffer from a large interstellar reddening in the Galactic plane even at NIR to MIR wavelengths. Therefore, it is hard to separate the circumstellar from the interstellar reddening for these objects because of the uncertainty of the interstellar extinction correction.222 As noted in Section 2.2, we used a formula given by Schlegel et al. (1998), which gives almost the maximum value of interstellar extinction due to thick dust clouds toward each source. We discuss here quantities of the sampled objects by introducing the color indices, and , which vary relatively mildly with the large extinction. We apply a wavelength-dependent extinction derived from the GLIMPSE survey which was obtained from the color excess of stars at and 284∘ (Indebetouw et al., 2005). We compare physical quantities of the sample objects with those of the proto-typical OH/IR star with SiO masers, OH 127.8+0.0, which is believed to be at the final stage of evolution on the AGB. Physical parameters of this star are relatively well known (Suh & Kim, 2002), with the optical depth of the envelope being about 10–15 at 9.8 m. This bright OH/IR star ( Jy) has and . Because of the position (), the interstellar extinction at the NIR wavelengths is small for this object (). If this object were behind a dust cloud with a heavier extinction of , it would be undetectable on the 2MASS image (). The spherically symmetric model for OH 127.8+0.0 (Kemper et al., 2002) gave a mass loss rate of M⊙ yr-1. The same model gives a total mass of the envelope of 0.2 M⊙ (if integrated to the outer radius of the dust shell, cm, as used by Kemper et al. (2002)).
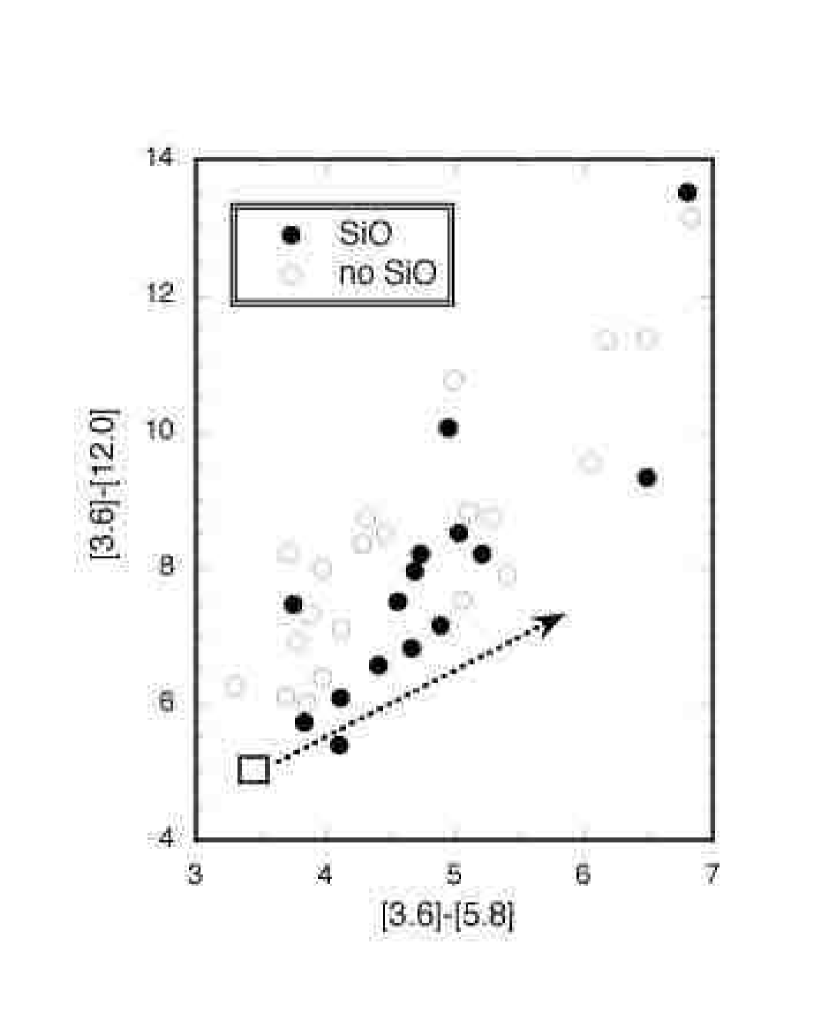
Figure 4 shows a two-color diagram, versus , for the sampled objects, where OH 128.7+0.0 occupies the position indicated by the square in this diagram. The interstellar reddening moves the position of the star to the upper right with an inclination of about unity because the extinctions at 5.8 and 12 m are comparable (Table 1 of Mathis, 1990). Selected objects in this diagram distribute from the lower-left to the upper right with a steeper slope () than the slope of the interstellar reddening line (). They appear in a very wide range of color indices, over 3 in (corresponding to ), which is too large to be considered an effect of interstellar reddening. These facts suggest that the extremely red colors of these objects cannot be explained solely by the interstellar reddening applied to the OH 127.8+0.0 type star, but they are more or less intrinsic to these objects.
The steepness of the distribution seems to be understandable by the model that the 12 m flux is a re-emission of absorbed NIR light by dust grains near the central star. If MIR re-emission does not occur (as interstellar reddening), the star should move on the line indicated by the dotted arrow. SiO detections (filled circles) also appear in a wide range of color indices in figure 4, but the SiO sources distribute with a steeper inclination () than the no-SiO subsample (), indicating that the re-emission effect at 12 m is stronger in the SiO maser sources than the non-SiO emitting objects. The SiO maser is an indicator of active mass loss near the central star ( cm), suggesting the presence of thick dust re-emitting the stellar radiation more at MIR wavelengths than the objects without SiO masers.
The above findings strongly suggest that these objects have an excessively large optical depth of circumstellar dust, which is much larger than that of the circumstellar dust of OH 127.8+0.0. The order of magnitudes of the excess material can be estimated from . We use the relation between and the mass loss rate calculated by Kemper et al. (2002). Applying the interstellar reddening corrections to , we computed the mass loss rate of the envelope from figure 6 of Kemper et al. (2002), and obtained the excess factor () of the circumstellar matter (relative to that of the OH 127.8+0.0 envelope), which is listed in the last column of table 2. They exceed the optical depth of the OH 127.8+0.0 envelope by a factor of a few up to 80. Uncertainty of the interstellar extinction correction of about 30 % makes a shift of up to 0.7 at most, making the uncertainty of the excess factor to be within a factor of 2 even for the worst case.
The total envelope mass for each sampled object must exceed by a similar factor, i.e. these objects might have envelope masses of 0.4–20 if simply integrated until the outer radius of cm. The total mass of the envelope is proportional to the outer-boundary radius for the assumed density distribution of a constant-mass-loss model (), whereas the optical depth is rather sensitive to the inner-bounday radius of the dust envelope. Because the color index, , which was used here for evaluation of the excess factor, does not give useful restrictions on the outer boundary radius in the Kemper et al’s modeling (it is rather restricted by IRAS 60 or 100 m flux density), the total mass of the thick matter estimated here has large ambiguity. Because, without precise modeling, it is uncertain as to how far from the central star the extra material in the envelope is located, we only use the excess factor in this paper, which characterizes the envelope of these objects.
The total envelope mass for each sampled object can be reduced, in some degree, by introducing a non-spherical distribution of the dust envelope, e.g. a torus or disk structure. However, even a wide opening angle of for cavity cones can reduce the mass by 50% compared with that of the spherical distribution with the same radial density profile. As discussed in the later sections, high-velocity components of water maser emission may suggest the presence of the accretion disk which creates collimated jets. In such a case, the scattered light through the pole of the torus should be observable, although it is hard to detect the scattered light for these objects because of the large interstellar extinction in the band.
3.2 Characteristic of SiO maser emission
It is striking that only the SiO –0 line was detected in 6 out of 8 SiO detected sources. Even in the remaining two sources the intensity of the –0 line was considerably stronger than that of the –0 line. The trend, i.e. the increase of the /1 line intensity ratio with the infrared color [, where and are IRAS 12 and 25 m flux density], was clearly first demonstrated by Nakashima & Deguchi (2003b). For the present sample of SiO detected sources, the MSX color, , is between 0.10 and 0.34, which fits well with the above trend. All of the SiO detected sources were previously observed by the OH 1612 MHz line and were all detected except for 182411010.
Figure 4 indicates that, for the sampled objects, SiO maser detection rates do not seem to correlate with the colors, , or . The flat detection rate seems to suggest that these stars are still in a mass-losing stage, at the final transient stage of the AGB to planetary-nebula phase. They are not at a later stage of the post-AGB phase when SiO masers should disappear.
3.3 New H2O sources with wide spread emission
Two H2O maser sources, 182860959 and 184600151 (Fig. 3) have a very wide velocity range (200 km s-1) in their maser emission spectra. Although the rich H2O maser emission spectrum in IRAS 182860959 (Fig. 3 left) resembles the water maser spectra associated with compact H ii regions (for example, Kurtz & Hofner, 2002), the nondetections of HCO+, H53, and NH3 lines toward these sources (the present work: table 3) suggest that they are not associated with dense molecular clouds (or compact H ii regions), and the rich H2O emission could be the result of a very irregular velocity field in the envelope. The fact that these sources are point-like with no associated nebulosity in their GLIMPSE images suggests that they are stellar objects.
Similar wide spread water maser spectra were found in the class of “water fountain” sources. There are four known water fountain sources [163423814, OH 12.8+0.9 (181391816), W43A (184500148), 19134+2131 (Likkel & Morris, 1988; Boboltz et al., 2005; Imai et al., 2004, 2005) with a few more probable cases (Gomez et al., 1994; Deacon et al., 2001). All of these objects exhibit the H2O maser components in a velocity range that exceed the OH velocity range. The H2O maser components are spatially more extended than the OH maser components (Imai et al., 2004; Boboltz et al., 2005). Among these “water fountain sources”, 163423814 had the highest velocity separation of km s-1. Our object 184600151 definitely belongs to the class of water fountain sources from the similarity of the emission characteristic, and it has a record-high separation of 292 km s-1 between emission components.
Both new objects, 182860959 and 184600151, are relatively bright IRAS sources (25 and 20 Jy at 12 m respectively); the former has a 2MASS counterpart, , with magnitude of 12.67 and . They have a rising mid-IR spectrum toward longer wavelengths, indicating the presence of a thick dust envelope. From the radial velocities, we estimate kinematic distances of 182860959 and 184600151 as 3.1 and 6.8 kpc, respectively, and luminosities as and for these distances.
If these objects have a thick dust torus (as in the unified model of the Type I and II active galactic nuclei), optically observable objects (as IRAS 163423814; Sahai et al., 1999) must be seen from the polar-axis direction of the dust torus and unseen from equatorial directions. If these high-velocity features are a part of the polar jet, which is created by the accretion disk, the higher velocity objects should have bluer colors. This hypothesis seems applicable for 182860959 (because of the identified NIR counterpart with ), but not for 184600151 (with no NIR counterpart). Regarding 184600151, which has the highest velocity separation among the water fountains, the large distance ( kpc) and the strong interstellar extinction hide this object behind molecular clouds. Applying the large interstellar extinction correction of , we infer the extinction corrected magnitude to be fainter than 5.8. It is slightly fainter than the extinction-corrected 3.6 m magnitude (), suggesting that the scattered light is not seen from this object.
3.4 Envelopes of extremely red OH/IR stars
The central stars of extremely red OH/IR objects with low expansion velocity ( km s-1) have been considered to be relatively low-initial-mass post-AGB stars compared with those of normal-color sources (Sevenster et al., 2002). In fact, the red (“RI”) group sources of Sevenster et al. (2002) involved two objects in the present sample: IRAS 181351456 and 18596+0315, which have the expansion velocities, 14.8 and 13.6 km s-1, respectively. Regarding expansion velocites derived from OH peaks, two water fountains, 184500148 (W43A) and 184600151, are low expansion-velocity (lower-mass) sources ( and 11 km s-1).
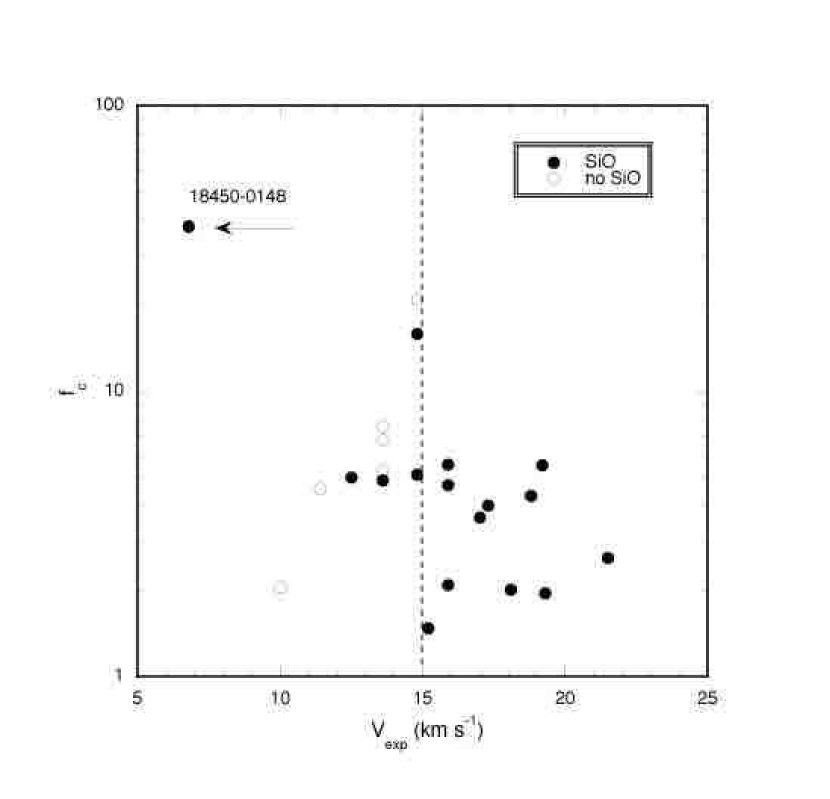
Figure 5 shows a plot of the excess factor of the envelope versus expansion velocity for OH 1612 MHz doubly-peaked objects in the present sample. Note that the excess factor was derived from (relative to OH 127.8+0.0; see section 3.1). It indicates that the excess factor does not correlate strongly with the expansion velocity of the envelope, and hence the initial mass of the central star.
Figure 5 also indicates that objects with small expansion velocity ( km s-1) seem to have lower SiO detection rates than the larger expansion-velocity objects ( km s-1). This indicates that the lower-mass stars with small expansion velocities are at the phase unfavorable for making strong SiO masers, e.g. dissociating SiO molecules by hot central star radiation, and/or terminating mass loss from the central star. This is consistent with the Sevenster et al. (2002)’s finding that the red objects with small expansion velocites are stars in the early post-AGB phases with nearly zero mass loss; the extreme high-velocity flow develops at this phase and SiO masers gradually disappear. We infer that the red stars with large expansion velocites are AGB stars still in an active mass-losing stage because of the presence of SiO masers. However both groups of stars, which are investigated in this paper, are dressed by excessively large amounts of circumstellar matter irrespective of the mass of the central star.
The radii of the OH emitting regions were found to be 3 – 16 cm for some of the selected objects (OH 21.5+0.5, 30.10.7, and 32.00.5) with the OH phase-lag/angular-size measurements (Herman et al., 1985). Because the H2O masing region of water fountains is extended more than the OH emission region (Imai et al., 2002, for W43A), the thick material must be extended out of the OH masing region. There is evidence that H2O maser outflow strikes the dense material which is located outside of the OH masing region. Therefore, it is likely that the excess material found in section 3.1 is extended to considerably outer parts of the envelope, i.e. outside of the OH masing region. The H2 number density of the OH masing region is known to be – cm-3 (for example, Netzer & Knapp, 1987), and the density of the H2O masing region must be, by several orders of magnitude, higher ( cm-3). Thus, we cannot deny the possibility that the thick layer is extended at the radius of more than cm, though such a layer could be clumpy and dense, depending on the model. Envelope masses of some OH/IR stars [e.g., IRAS 184500148 (W43A)], exceed 4 even for the outer radius of cm. Though the envelope mass can vary by a factor of a few, depending on the uncertainty of interstellar extinction and nonspherical distribution of the thick layer as noted before, it is difficult to lower the envelope mass less than 1 for several of the thickest objects of the sample.
A number of numerical modelings of thick circumstellar envelopes in the outgoing AGB phase have been made (for example, van Hoof et al., 1997; Lorenz-Martins & de Araujo, 1997). David & Papoular (1992) and Suh & Jones (1997) examined superwind models to explain far IR spectra of OH/IR objects accompanying deep silicate absorptions. One of their models, which has a dense shell between radii and cm in addition to a normal continuous flow (Suh & Jones, 1997), successfully fits the computed to the observed spectral energy distribution of IRAS 182571000 (OH 21.5+0.5), which has a relatively mild excess factor (1.4) in our list (table 2). The large IRAS 60 m flux densities of most of the other objects (though some of them might be contaminated from nearby clouds) entail for the much denser outer shell in these models, which inevitably results in a large total envelope mass of more than a few (David & Papoular, 1992); the superwind models artificially restrict the outer radius of the thick material to keep the enclosed mass smaller. Although the total mass of the outer envelope could in principle be observationally constrained by CO –0 intensities or IRAS 60/100 m flux densities, it is hard to estimate for these objects because of contamination by radiation from surrounding clouds.
Though all of these modelings of very red OH/IR objects assume a superwind with a mass loss rate of yr-1 in a duration of about a few hundred years, the origin of the thick material is not necessarily restricted to the superwinds which occur at the end of the AGB phase. Because no correlation appears between the excess factor and the expansion velocity, the thick material does not seem to be related with the central star masses. The excess material at the outer envelope of these objects can be a source of a shock front of the extremely high-velocity outflow created at the early post-AGB phase of stars, that is observed as water fountains. This may be due to gas ejection by binary-star interactions (Nordhaus & Blackman, 2006). Men’shchikov et al. (2002) found that the massive dust torus of the Red Rectangle has , which was formed in the ejection of a common envelope after Roche lobe overflow. Similarly, stellar merging (for example, Bally & Zinnecker, 2005; Tylenda & Soker, 2006) may create such massive circumstellar material. Alternatively these stars may simply be in a dense dust cloud, as found in IRAS 19312+1950 (Deguchi et al., 2004a). We cannot deny such a possibility for some of these sources (but not all of them) because they are seen toward thick dust clouds. We infer here that massive circumstellar matter of the thickest OH/IR stars in the present sample can be formed by one of the aforementioned mechanisms.
4 Conclusion
SiO maser and OH/IR objects with no 2MASS counterparts were identified in the GLIMPSE 3.6/4.5/5.8/8.0 m images with a spatial resolution of 1.2″. Searches for SiO and H2O masers lead to 10 new detections, each of which show characteristic maser spectra of the stronger SiO –0 to line or wide spread H2O maser emission. It turned out that the dust envelopes of these objects are exceptionally thick, though they suffer from a large interstellar extinction. This suggests that a considerable mass of materials toward the objects must exist in the envelope. The SiO detection rate was uncorrelated with the mass of the envelope, but the lower detection rate was obtained for the lower-expansion velocity subsample of the OH/IR stars. The latter suggests that the higher-expansion velocity objects are AGB stars and lower-expansion velocity objects are more evloved stars such as post-AGB stars. The derived envelope mass is not correlated with this sequence of stellar evolution. From these observations, we believe that the thick material in some of these objects cannot be ascribed to the AGB-phase wind of the central star.
Appendix A IRAS 19027+0517
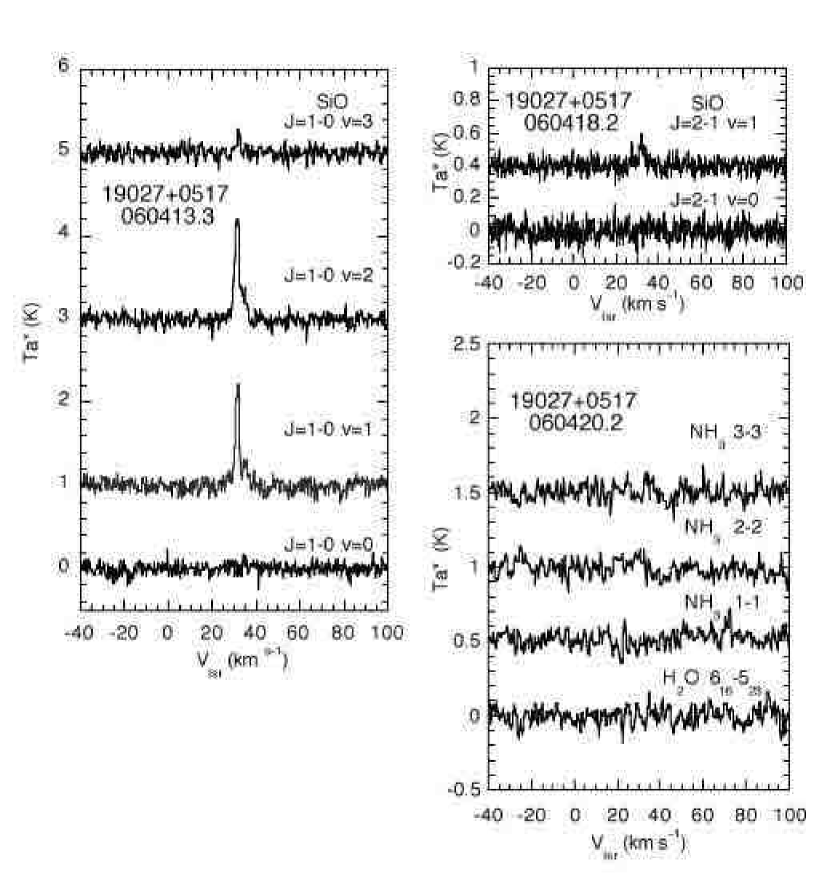
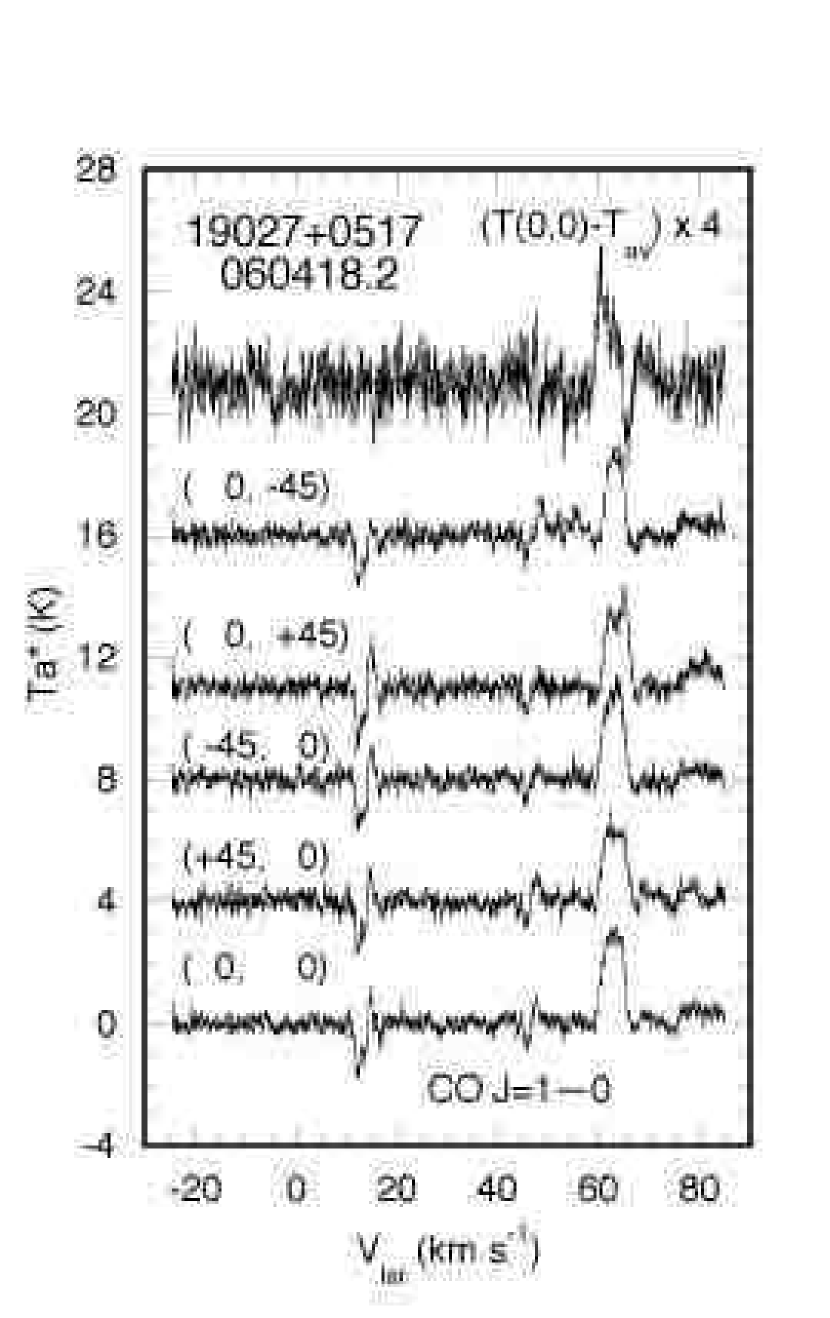
The Glimpse images of the SiO maser source, IRAS 19027+0517, exhibit conspicuous nebulosity around the central star at 5.8 and 8.0 m (Fig. 6). The nebula is lopsided to the central star and extended to the north. The surface brightness of the nebula seems to increase toward the central star, which suggests a physical association of this nebula to the central star. Among 200 SiO sources investigated, only this object has an extended nebulosity. The 2MASS images show a medium bright central star (), but do not exhibit any extended features. The nebulous feature is considered to be due to the PAH emission with sharp spectral features at 6.2 and 7.8 m (Verstraete et al., 2001). It is quite unusual that the O-rich central star in the AGB phase (with SiO masers) accompanies such extended PAH nebulosity. Therefore, we particularly investigated this object more with various molecular lines with the NRO 45m telescope. In addition to the previous detections of the SiO –0 and 2 lines (Deguchi et al., 2004b), we found emissions of the SiO –0 and 3, and –1 lines; the spectra are shown in figure 7. Furthermore, we made 45′′-grid 5-point mapping observations by CO, HCN and HCO+ –0 lines, but no emission associated with the central star was detected, except for the fore/background clouds with large velocity separations (see figure 8). The observational results are summarized in table 5. Therefore, we conclude that most of the molecules are dissociated in the nebula toward IRAS 19027+0517, an O-rich AGB star, by UV radiation from a closeby UV source creating the lopsided nebulosity.
References
- Allen et al. (1977) Allen, D. A., Hyland, A. R., Longmore, A. J., Caswell, J. L., Goss, W. M., & Haynes, R. F. 1977, ApJ, 217, 108
- Boboltz et al. (2005) Boboltz, D. A. & Marvel, K. B. 2005, ApJ, 627, L45
- Bally & Zinnecker (2005) Bally, J. & Zinnecker, H. 2005, AJ, 129, 2281
- Caswell (1999) Caswell, J. L. 1999, MNRAS, 308, 683
- Chengalur et al. (1993) Chengalur, J. N., Lewis, B. M., Eder, J., & Terzian, Y. 1993, ApJS, 89, 189
- David & Papoular (1992) David, P. & Papoular, R. 1992, A&A, 265, 195
- Deacon et al. (2001) Deacon, R. M., Chapman, J. M., Green, A. J., & Sevenster, M. N. 2006, submitted to ApJ
- Deguchi et al. (2001) Deguchi, S., Fujii, T., Matsumoto, S. Nakashima, J., & Wood, P. 2001, PASJ, 53, 293
- Deguchi et al. (2002) Deguchi, S., Fujii, T., Nakashima, J., & Wood, P. R., 2002, PASJ, 54, 719
- Deguchi et al. (2004a) Deguchi, S., et al. 2004a, PASJ, 56, 261
- Deguchi et al. (2004b) Deguchi, S. et al. 2004b, PASJ, 56, 765
- Deguchi et al. (1998) Deguchi S., Matsumoto S., & Wood P. R. 1998, PASJ, 50, 597
- Deguchi et al. (2004c) Deguchi, S., Nakashima, J., Takano, S. 2004, PASJ, 56, 1083
- Deguchi et al. (2005a) Deguchi, S., Nakashima, J., Miyata, T., & Ita, Y. 2005, PASJ, 57, 933
- Deguchi et al. (2005b) Deguchi, S., Matsunaga, N., Fukushi, H. 2005, PASJ, 57, L25
- Eder et al. (1988) Eder, J., Lewis, B. M. & Terzian, Y. 1988, ApJS, 66, 183
- Engels et al. (1986) Engels, D., Schmid-Burgk, J., & Walmsley, C. M. 1986, A&A, 167, 129
- Engels & Lewis (1996) Engels, D. & Lweis, B. M. 1996, A&AS, 116, 117
- Egan et al. (1999) Egan M. P., et al. 1999, Air Force Research Laboratory Technical Report No. AFRL-VS-TR-1999-1522 (available at IPAC, http://irsa.ipac.caltech.edu/applications/MSX)
- Gomez et al. (1990) Gomez, Y., Moran, J. M. & Rodriguez, L. F. 1990, RMxAA, 20, 55
- Gomez et al. (1994) Gomez, Y., Rodriguez, L. F., Contreras, M. E., & Moran, J. M., 1994, RMxAA, 28, 97
- Habing (1996) Habing, H. J. 1996, A&AR, 7, 97
- Hasegawa (1985) Hasegawa, T. et al. 1985, in Masers, Molecules and Mass Outflows in Star Forming Regions, ed. A. D. Haschick (Aystack Observatory, Westford), p.275
- Herman et al. (1985) Herman, J., Baud, B., Habing, H. J., & Winnberg, A 1985, A&A143, 122H
- Humphreys (1970) Humphreys, R. M. 1970, AJ, 75, 602
- Imai et al. (2002) Imai, H. Obara, K., Diamond, P. J., Omodaka, T., & Sasao, T. 2002, Nature, 417, 829
- Imai et al. (2004) Imai, H., Morris, M., Sahai, R., Hachisuka, K., & Azzollini F. J. R. 2004, A&A, 420, 265
- Imai et al. (2005) Imai, H. Nakashima, J., Diamond, P.J., Miyazaki, A. & Deguchi, S. 2005, ApJ, 622, L125
- Indebetouw et al. (2004) Indebetouw, R., Benjamin, R. A., & Churchwell, E. 2004, ASPC, 317, 109 ”Milky Way Surveys: The Structure and Evolution of Our Galaxy” ed. by D. Clemens, R. Shah, & T. Brainerd
- Indebetouw et al. (2005) Indebetouw, R. et al. 2005, ApJ, 619, 931
- Izumiura et al. (1999) Izumiura, H. et al. ApJS, 125, 257
- Jiménez-Esteban et al. (2005) Jiménez-Esteban, F. M., Agudo-Mérida, L., Engels, D., García-Lario, P. 2005, A&A, 431, 779
- Jiménez-Esteban et al. (2006) Jiménez-Esteban F. M., García-Lario, P., Engels, D., & Perea Calderón, J. V. 2006, A&A, 446, 773
- Kemper et al. (2002) Kemper, F., De Koter, A., Waters L. B. F. M., Bouwman, J., Tielens, A. G. G. M. 2002, A&A, 384, 585
- Kurtz & Hofner (2002) Kurtz, S. & Hofner, P. 2005, AJ, 130, 711
- Kwok (1976) Kwok, S. 1976, JRASC, 70, 49
- Kwok (2000) Kwok, S. in The origin and evolution of Planetary nebulae (Cambridge: Cambridge Univ. Press)
- Kwok, Volk, & Bidelman (1997) Kwok, S., Volk, K., and Bidelman, W.P. 1997, ApJS, 112, 557
- Lewis et al. (1987) Lewis, B. M., Eder, J., & Terzian, Y. 1987, AJ, 94, 1025
- Lewis et al. (2004) Lewis, B. M., Kopon, D. A., & Terzian, Y. 2004, AJ, 127, 501
- Likkel & Morris (1988) Likkel, L., & Morris, M., 1988, ApJ, 329, 914
- Likkel et al. (1992) Likkel, L., Morris, M., & Maddalena, R. J. 1992, A&A, 256, 581
- Lorenz-Martins & de Araujo (1997) Lorenz-Martins, S. & de Araujo, F. X. 1997, MNRAS, 291, 296
- Mathis (1990) Mathis, J. S. 1990, ARA&A 28, 37
- Men’shchikov et al. (2002) Men’shchikov, A. B., Schertl, D., Tuthill, P. G., Weigelt, G., Yungelson, L. R. 2002, A&A, 393, 867
- Morris et al. (2003) Morris, M. R., Sahai, R. & Claussen, M. 2003, RMxAC 15, 20
- Morita et al. (1992) Morita, K. 1990, PASJ, 44, 373
- Nakashima & Deguchi (2003a) Nakashima, J., & Deguchi, S. 2003, PASJ, 56, 203
- Nakashima & Deguchi (2003b) Nakashima, J., & Deguchi, S. 2003, PASJ, 56, 229
- Nakashima et al. (2004) Nakashima, J., Deguchi, S., & Kuno, N. 2004, PASJ, 56, 193
- Netzer & Knapp (1987) Netzer, N. & Knapp, G. R. 1987, ApJ, 323, 734
- Nordhaus & Blackman (2006) Nordhaus, J. & Blackman, E. G. 2006, MNRAS, 370, 2004
- Nyman et al. (1986) Nyman, L.-Å. Johansson, L. E. B., & Booth, R. S. 1986, A&A, 160, 352
- Nyman et al. (1998) Nyman, L.-Å., Hall, P. J., & Olofsson, H. 1998, A&AS, 127, 185
- Sahai et al. (1999) Sahai, R. Te Lintel-Hekkert, P., Morris, M., Zijlstra, A., & Likkel, L. 1999, ApJ, 514, L15S
- Sevenster et al. (2001) Sevenster, M. N., van Langevelde, H. J., Moody, R. A., Chapman, J. M., Habing, H. J., & Killeen, N. E. B. 2001, A&A, 366, 481
- Sevenster et al. (2002) Sevenster, M. N. 2002, AJ, 123, 2788
- Schlegel et al. (1998) Schlegel, D. J., Finkbeiner, D. P., Davis, M. 1998, ApJ, 500, 525
- Skrutskie et al. (2000) Skrutskie, M. F., Stiening, R., Cutri, R., Beichman, C., Capps, R., Carpenter, J., Chester, J., Elias, J. et al. 2000 (The 2MASS Team) http://www.ipac.caltech.edu/2mass/overview/ 2massteam.html
- Suh & Jones (1997) Suh, K-W, & Jones, T. J. 1997, ApJ, 479, 918
- Suh & Kim (2002) Suh, K.-W. & Kim, H.-Y. 2002, A&A, 391, 665
- te Lintel-Hekkert et al. (1991) te Lintel Hekkert, P., Caswell, J. L., Habing, H. J., Haynes, R. F., & Norris, R. P. 1991, A&AS, 90, 327
- Tylenda & Soker (2006) Tylenda, R. & Soker, N. 2006, A&A, 451, 223
- van der Veen & Habing (1988) van der Veen, W. E. C. J. & Habing, H. J. 1988, A&A, 194, 125
- van Hoof et al. (1997) van Hoof, P. A. M., Oudmaijer, R. D., & Waters, L. B. F. M 1997, MNRAS, 289, 371
- Verstraete et al. (2001) Verstraete, L., Pech, C., Moutou, C., Sellgren, K., Wright, C. M., Giard, M., Léger, A., Timmermann, R., & Drapatz, S. 2001, A&A, 372, 981
- Weintraub (1990) Weintraub, D. A. 1990, ApJS, 74, 575
- Wilson & Barrett (1968) Wilson, W. J. & Barrett, A. H. 1968, Science, 161, 778
| Source | MSX6C name | R.A. | Dec | Cac | Cce | SiO H2O OH | OH name | |
|---|---|---|---|---|---|---|---|---|
| (h m s) | ( ′ ′′) | (detectiona) | ||||||
| 180341858 | G011.006400.9220 | 18 06 25.3 | 18 57 44 | 8.8 | 0.194 | 0.186 | n n – | |
| 181001915 | G011.521800.5826 | 18 13 03.1 | 19 14 19 | 13.1 | 0.167 | 0.173 | y n y3 | OH11.520.58 |
| 181351456 | G015.700500.7707 | 18 16 25.7 | 14 55 15 | 26.1 | 0.752 | 0.498 | y1 y2 y3 | OH15.7+0.8 |
| 181611713 | G013.988300.8613 | 18 19 01.7 | 17 12 07 | 25.3 | 0.283 | 0.083 | n n n10 | |
| 181821504 | G016.116900.2903 | 18 21 07.0 | 15 03 22 | 48.5 | 0.190 | 0.268 | y y4 y3 | OH16.10.3 |
| 181981249 | G018.295500.4291 | 18 22 43.1 | 12 47 42 | 10.1 | 0.242 | 0.340 | y n4 y3 | OH18.30+0.43 |
| 182121227 | G018.768300.3016 | 18 24 05.3 | 12 26 12 | 3.6 | 0.863 | 0.601 | n n y3 | OH18.8+0.3 |
| 182411010 | G021.116400.7775 | 18 26 50.6 | 10 08 19 | 12.4 | 0.176 | 0.099 | y – n10 | |
| 182451248 | G018.838400.5622 | 18 27 21.2 | 12 46 42 | 1.1 | 0.252 | 0.076 | y5 – – | |
| 182571000 | G021.456600.4911 | 18 28 31.0 | 09 58 15 | 9.6 | 0.172 | 0.305 | y y14 y3 | OH021.457+00.491 |
| 182860959 | G021.796400.1273 | 18 31 22.9 | 09 57 20 | 45.0 | 0.181 | 0.129 | n y y3 | OH021.79700.127 |
| 182980904 | G022.748200.0248 | 18 32 37.0 | 09 02 30 | 18.3 | 0.173 | 0.176 | n n – | |
| 183250721 | G024.581400.2245 | 18 35 19.1 | 07 19 23 | 4.7 | 0.178 | 0.145 | n n y3 | OH24.6+0.2 |
| 183270645 | G025.130100.4841 | 18 35 24.3 | 06 42 59 | 10.1 | 0.349 | 0.099 | n n – | |
| 184070358 | G028.520300.0141 | 18 43 25.8 | 03 55 55 | 3.8 | 0.225 | 0.197 | y n y3 | OH28.50.0 |
| 184240509 | G027.662100.9179 | 18 45 04.9 | 05 06 28 | 14.5 | 0.111 | 0.146 | n n – | |
| 184440359 | G028.930400.8287 | 18 47 05.2 | 03 56 21 | 7.8 | 0.166 | 0.135 | n n – | |
| 184500148 | G030.944100.0350 | 18 47 41.2 | 01 45 11 | 23.9 | 0.978 | 0.519 | y1 y8 y3 | OH31.8+0.0, W43A |
| 184600151 | G031.012600.2195 | 18 48 43.0 | 01 48 30 | 14.7 | 0.205 | 0.176 | n y y3 | OH30.10.2 |
| 184600254 | G030.090800.6866 | 18 48 42.0 | 02 50 29 | 127.9 | 0.184 | 0.261 | y7 y14 y3 | OH30.10.7 |
| 184880107 | G031.984400.4849 | 18 51 26.2 | 01 03 52 | 31.1 | 0.177 | 0.196 | y1 y14 y3 | OH32.00.5 |
| 185090018 | G032.952400.5687 | 18 53 30.0 | 00 14 28 | 24.9 | 0.211 | 0.122 | y1 – y3 | OH32.950.57 |
| 185170037 | G033.872800.3350 | 18 54 20.8 | 00 41 05 | 25.9 | 0.244 | 0.187 | y1 y9 y3 | OH033.87300.335 |
| 185960315 | G037.118500.8473 | 19 02 06.3 | 03 20 16 | 2.9 | 0.784 | 0.501 | n n y3 | OH37.10.8 |
| 190060624 | G040.022000.3818 | 19 03 03.4 | 06 28 54 | 2.2 | 0.276 | 0.060 | y1 y14 y10 | OH40.02+0.38 |
| 190110638 | G040.279300.3766 | 19 03 33.1 | 06 42 29 | 11.4 | 0.297 | 0.206 | n n – | |
| 190250702 | G040.800500.2455 | 19 04 59.0 | 07 06 40 | 6.9 | 0.354 | 0.068 | n – – | |
| 190871006 | G044.240400.3090 | 19 11 10.0 | 10 11 37 | 3.0 | 0.594 | 0.259 | n n n12 | |
| 191121220 | G046.499200.8092 | 19 13 37.4 | 12 25 39 | 5.2 | 0.383 | 0.058 | n n n10 | |
| 191140920 | G043.867500.6247 | 19 13 49.4 | 09 25 51 | 10.5 | 0.157 | 0.172 | n n n10 | |
| 191801230 | G047.425700.5624 | 19 20 22.0 | 12 36 24 | 6.1 | 0.231 | 0.123 | n – – | |
| 192541631 | G051.804200.2247 | 19 27 42.1 | 16 37 25 | 22.1 | 0.226 | 0.276 | y1 – y13 | OH51.80.2 |
| 192541724 | G052.581400.2014 | 19 27 41.1 | 17 30 36 | 3.4 | 0.675 | 0.273 | n – n10 | |
| 192661815 | G053.461400.3547 | 19 28 53.1 | 18 21 23 | 8.8 | 0.168 | 0.168 | n – – | |
| 192751702 | G052.504200.4085 | 19 29 46.5 | 17 09 01 | 9.3 | 0.185 | 0.136 | n n – | |
| 194402251 | G059.478400.8969 | 19 46 09.2 | 22 59 24 | 17.4 | 0.153 | 0.258 | y1 n8 y11 | OH59.480.90 |
| G014.2758 | G014.275800.1602 | 18 17 01.0 | 16 37 00 | 6.1 | 0.183 | 0.122 | n n – | |
| G017.3913 | G017.391300.2891 | 18 23 35.0 | 13 55 49 | 5.7 | 0.080 | 0.240 | y n6 y3 | OH17.40.3 |
| G022.0425 | G022.042500.6084 | 18 33 34.6 | 09 57 36 | 1.2 | 0.628 | 0.632 | n y2 y3 | OH22.10.6 |
| G024.6610 | G024.661000.0868 | 18 35 57.5 | 07 18 58 | 3.1 | 0.218 | 0.324 | y n6 y3 | OH24.7+0.1 |
| G027.8433 | G027.843300.1060 | 18 42 30.9 | 04 34 35 | 7.1 | 0.081 | 0.207 | n n – |
| Source | [3.6] | [3.6] | ||||||||
|---|---|---|---|---|---|---|---|---|---|---|
| (IRAS or MSX) | () | () | (mJy) | (mJy) | (mJy) | (mJy) | ||||
| 180341858 | +11.0061 | 0.9222 | 29.9 | 308.8 | 1617.0 | — | 5.30 | 8.74 | 1.50 | 7.6 |
| 181001915 | +11.5216 | 0.5824 | 72.7 | 712.7 | 3641.0 | — | 5.21 | 8.21 | 3.05 | 4.9 |
| 181351456 | +15.7011 | 0.7706 | 26.2 | 166.6 | 1033.0 | — | 4.95 | 10.06 | 1.74 | 15.9 |
| 181611713 | +13.9884 | 0.8611 | 264.8 | 1988.0 | 11510.0 | — | 5.06 | 7.52 | 3.33 | 3.2 |
| 181821504 | +16.1173 | 0.2907 | 512.4 | — | 14120.0 | — | 4.57 | 7.51 | 5.64 | 2.6 |
| 181981249 | +18.2956 | 0.4291 | 56.2 | 847.5 | 1818.0 | — | 4.74 | 8.20 | 2.49 | 5.1 |
| 182121227 | +18.7688 | 0.3017 | 1.9 | 9.9 | 77.7 | 562.0 | 4.99 | 10.76 | 3.20 | 20.9 |
| 182411010 | +21.1166 | 0.7775 | 676.4 | 2918.0 | 9559.0 | — | 3.84 | 5.73 | 1.65 | 1.3 |
| 182451248 | +18.8387 | 0.5622 | 81.2 | 447.1 | 1468.0 | 1750.0 | 4.11 | 5.40 | 4.91 | 0.8 |
| 182571000 | +21.4565 | 0.4911 | 434.1 | — | — | — | 5.93 | 2.63 | 1.4 | |
| 182860959 | +21.7972 | 0.1272 | 541.6 | — | — | — | 7.37 | 7.71 | 2.0 | |
| 182980904 | +22.7483 | 0.0252 | 231.0 | — | 3409.0 | — | 3.89 | 7.31 | 7.15 | 2.1 |
| 183250721 | +24.5814 | 0.2243 | 198.1 | 600.7 | 2845.0 | — | 3.86 | 6.01 | 11.48 | 0.3 |
| 183270645 | +25.1301 | 0.4842 | 42.9 | 270.2 | 1074.0 | — | 4.46 | 8.50 | 4.09 | 5.3 |
| 184070358 | +28.5203 | 0.0143 | 75.3 | — | 2288.0 | — | 4.67 | 6.82 | 10.74 | 1.1 |
| 184240509 | +27.6622 | 0.9174 | 98.3 | 463.1 | 1573.0 | — | 3.98 | 7.99 | 1.31 | 5.0 |
| 184440359 | +28.9303 | 0.8288 | 232.9 | — | 3738.0 | — | 3.98 | 6.38 | 1.77 | 1.9 |
| 184500148 | +30.9439 | 0.0351 | 1.0 | 12.5 | 0217.2 | 2564.0 | 6.81 | 13.51 | 14.79 | 37.8 |
| 184600151 | +31.0124 | 0.2194 | 23.9 | 374.8 | 2598.0 | — | 6.06 | 9.54 | 8.23 | 6.7 |
| 184600254 | +30.0910 | 0.6865 | 558.9 | 5860.0 | — | — | 8.47 | 3.35 | 5.5 | |
| 184880107 | +31.9845 | 0.4853 | 778.6 | 6270.0 | 18690.0 | — | 4.42 | 6.57 | 2.70 | 2.0 |
| 185090018 | +32.9528 | 0.5689 | 273.0 | 1198.0 | 3568.0 | 3952.0 | 3.76 | 7.47 | 1.59 | 3.6 |
| 185170037 | +33.8727 | 0.3353 | 107.9 | — | 4579.0 | — | 5.03 | 8.52 | 3.62 | 5.6 |
| 185960315 | +37.1184 | 0.8474 | 9.9 | 49.7 | 217.3 | 806.0 | 4.32 | 8.73 | 1.54 | 7.5 |
| 190060624 | +40.0224 | 0.3813 | 85.7 | 484.3 | 1566.0 | — | 4.12 | 6.09 | 2.76 | 1.5 |
| 190110638 | +40.2794 | 0.3761 | 84.9 | 939.7 | 5077.0 | — | 5.41 | 7.89 | 2.71 | 4.2 |
| 190250702 | +40.8006 | 0.2452 | 22.1 | 187.6 | 1009.0 | 4079.0 | 5.11 | 8.80 | 2.54 | 7.2 |
| 190871006 | +44.2406 | 0.3086 | 00.9 | 14.7 | 146.5 | 971.8 | 6.49 | 11.37 | 3.80 | 28.3 |
| 191121220 | +46.4995 | 0.8093 | 01.6 | 23.5 | 193.8 | 1029.0 | 6.17 | 11.35 | 1.88 | 32.9 |
| 191140920 | +43.8677 | 0.6248 | 192.3 | 865.6 | 2582.0 | 1809.0 | 3.78 | 6.91 | 2.76 | 2.4 |
| 191801230 | +47.4258 | 0.5625 | 93.5 | 513.5 | 1714.0 | — | 4.12 | 7.10 | 2.92 | 2.6 |
| 192541631 | +51.8039 | 0.2249 | 155.1 | 1076.0 | 4806.0 | — | 4.69 | 7.95 | 2.80 | 4.3 |
| 192541724 | +52.5815 | 0.2014 | 0.2 | 02.4 | 44.4 | 503.2 | 6.83 | 13.14 | 2.40 | 88.4 |
| 192661815 | +53.4611 | 0.3551 | 42.8 | 253.3 | 910.0 | 606.5 | 4.28 | 8.35 | 2.03 | 5.8 |
| 192751702 | +52.5040 | 0.4085 | 359.6 | 1483.0 | 4437.0 | — | 3.69 | 6.10 | 2.85 | 1.5 |
| 194402251 | +59.4784 | 0.8966 | 179.4 | 1460.0 | — | — | 7.53 | 0.94 | 4.0 | |
| G014.2758 | +14.2760 | 0.1600 | 367.1 | — | — | — | 5.62 | 8.35 | 0.4 | |
| G017.3913 | +17.3915 | 0.2892 | 83.4 | 583.4 | 3113.0 | — | 4.89 | 7.15 | 5.82 | 2.1 |
| G022.0425 | +22.0428 | 0.6085 | 6.6 | 22.0 | 83.5 | 365.7 | 3.72 | 8.22 | 3.91 | 4.6 |
| G024.6610 | +24.6608 | 0.0867 | 6.1 | 130.0 | 990.5 | — | 6.49 | 9.33 | 11.05 | 4.7 |
| G027.8433 | +27.8430 | 0.1061 | 236.1 | 811.8 | 2035.0 | 2720.0 | 3.30 | 6.26 | 6.30 | 1.2 |
| Source | Transition | line flux | rms | ||
|---|---|---|---|---|---|
| (km s-1) | (K) | (K km s-1) | (K) | ||
| 181001915 | SiO –0 | — | — | — | 0.121 |
| SiO –0 | 16.5 | 1.202 | 2.087 | 0.114 | |
| H2O – | — | — | — | 0.109 | |
| 181821504 | SiO –0 | 18.3 | 0.650 | 2.536 | 0.153 |
| SiO –0 | 22.9 | 16.661 | 45.758 | 0.166 | |
| SiO –0 | 22.5 | 41.500 | 130.23 | 0.168 | |
| SiO –0 | 22.5 | 10.434 | 28.839 | 0.173 | |
| 29SiO –0 | 23.6 | 1.093 | 2.623 | 0.151 | |
| 181981249 | SiO –0 | — | — | — | 0.104 |
| SiO –0 | 48.2 | 0.579 | 0.429 | 0.107 | |
| 182411010 | SiO –0 | — | — | — | 0.084 |
| SiO –0 | 116.3 | 0.620 | 2.795 | 0.085 | |
| 182571000 | SiO –0 | — | — | — | 0.097 |
| SiO –0 | 114.9 | 0.781 | 1.427 | 0.097 | |
| 182860959 | SiO –0 | — | — | — | 0.123 |
| SiO –0 | — | — | — | 0.118 | |
| H2O – | 3.863 | 166.3 | 0.043 | ||
| SiO –1 | — | — | — | 0.065 | |
| HCO+ –0 | — | — | — | 0.068 | |
| 184070358 | SiO –0 | 106.5 | 0.572 | 1.457 | 0.108 |
| SiO –0 | 107.3 | 0.921 | 2.126 | 0.097 | |
| H2O – | — | — | — | 0.087 | |
| 184600151 | SiO –0 | — | — | — | 0.100 |
| SiO –0 | — | — | — | 0.084 | |
| H2O – | 117.0 | 4.881 | 24.38 | 0.050 | |
| SiO –1 | — | — | — | 0.069 | |
| HCO+ –0 | — | — | — | 0.084 | |
| G017.3913 | SiO –0 | — | — | — | 0.119 |
| SiO –0 | 28.7 | 1.398 | 4.106 | 0.117 | |
| G024.6610 | SiO –0 | — | — | — | 0.103 |
| SiO –0 | 57.7 | 1.247 | 3.662 | 0.101 |
| Source | rms | rms | rmsaa”y” or ”n” indicates the detection or nondetection in this paper, othewise noted. References: 1: Nakashima & Deguchi (2003b), 2: Engels et al. (1986), 3: Sevenster et al. (2001), 4: Gomez et al. (1990), 5: Izumiura et al. (1999), 6: Nyman et al. (1986), 7: Nyman et al. (1998), 8: Likkel et al. (1992), 9: Engels & Lewis (1996), 10: te Lintel-Hekkert et al. (1991),11: Eder et al. (1988), 12: Lewis et al. (1987), 13: Chengalur et al. (1993), 14: Deacon et al. (2001). |
|---|---|---|---|
| (SiO ) | (SiO ) | (H2O) | |
| (K) | (K) | (K) | |
| 180341858 | 0.115 | 0.114 | 0.096 |
| 181611713 | 0.119 | 0.115 | 0.107 |
| 182121227 | 0.096 | 0.095 | 0.086 |
| 182980904 | 0.097 | 0.105 | 0.075 |
| 183250721 | 0.075 | 0.073 | 0.087 |
| 183270645 | 0.099 | 0.097 | 0.088 |
| 184240509 | 0.357 | 0.396 | 0.088 |
| 184440359 | 0.126 | 0.121 | 0.113 |
| 185960315 | 0.117 | 0.115 | 0.086 |
| 190110638 | 0.113 | 0.102 | 0.084 |
| 190250702 | 0.111 | 0.113 | — |
| 190871006 | 0.077 | 0.075 | 0.080 |
| 191121220 | 0.088 | 0.084 | 0.082 |
| 191140920 | 0.086 | 0.086 | 0.151 |
| 191801230 | 0.071 | 0.073 | — |
| 192541724 | 0.094 | 0.082 | — |
| 192661815 | 0.077 | 0.071 | — |
| 192751702 | 0.094 | 0.090 | 0.093 |
| G014.2758 | 0.109 | 0.109 | 0.099 |
| G022.0425 | 0.075 | 0.078 | — |
| G027.8433 | 0.103 | 0.099 | 0.062 |
| Transition | rest freq. | line flux | rms | ||
|---|---|---|---|---|---|
| (GHz) | (km s-1) | (K) | (km s-1 K) | (K) | |
| H2O – | 22.23508 | — | — | — | 0.073 |
| NH3 – | 23.694 | — | — | — | 0.063 |
| NH3 – | 23.722 | — | — | — | 0.044 |
| NH3 – | 23.870 | — | — | — | 0.052 |
| SiO –0 | 43.42386 | 34.2 | 0.173 | 0.417 | 0.053 |
| SiO –0 | 43.12208 | 31.7 | 1.288 | 3.348 | 0.058 |
| SiO –0 | 42.82059 | 31.7 | 1.202 | 3.826 | 0.067 |
| SiO –0 | 42.51938 | 31.6 | 0.298 | 0.557 | 0.053 |
| 29SiO –0 | 42.87992 | — | — | — | 0.054 |
| H53 | 42.95197 | — | — | — | 0.062 |
| SiO –1 | 86.24342 | 32.3 | 0.204 | 0.584 | 0.034 |
| SiO –1 | 86.84700 | — | — | — | 0.037 |
| HCN –0 | 88.63185 | —aaDash indicates not observed. | — | — | 0.053 |
| HCO+ –0 | 89.18852 | — | — | — | 0.061 |
| CO –0 | 115.27120 | —aaContaminations at , 46, and 63 km s-1. | — | — | 0.200 |