The Mass Assembly History of Spheroidal Galaxies: Did Newly-Formed Systems Arise Via Major Mergers?
Abstract
We examine the properties of a morphologically-selected sample of spheroidal galaxies in the GOODS fields in order to ascertain whether their increase in abundance with time arises primarily from major mergers. To address this question we determine scaling relations between the dynamical mass , determined from stellar velocity dispersions, and the stellar mass , determined from optical and infrared photometry. We exploit these relations across the larger sample for which we have stellar masses in order to construct the first statistically robust estimate of the evolving dynamical mass function (MF) over . The trends observed match those seen in the stellar mass functions of Bundy et al. (2005) regarding the top-down growth in the abundance of spheroidal galaxies. By referencing our dynamical masses to the halo virial mass, , we compare the growth rate in the abundance of spheroidals to that predicted by the assembly of dark matter halos. Our comparisons demonstrate that major mergers do not fully account for the appearance of new spheroidals since and that additional mechanisms, such as morphological transformations, are required to drive the observed evolution.
Subject headings:
galaxies: evolution — galaxies: elliptical and lenticular — galaxies: kinematics and dynamics — galaxies: mass function1. Introduction
Substantial progress has been made in characterizing the primarily old, red, and passively-evolving stellar populations of spheroidal galaxies (defined here to include elliptical and lenticulars) from z1 to the present day (see Renzini, 2006, for a review). Their evolving abundance contains valuable clues to the processes by which they form, as well as insight into the history of cosmic mass assembly. In recent years, many surveys have converged on a broad evolutionary pattern in which it is claimed that galaxies with the largest stellar masses evolve predominantly into spheroidals by with little subsequent growth. Meanwhile, intermediate and lower mass systems continue to form at later epochs (e.g., Bundy et al., 2005, 2006; Tanaka et al., 2005; Franceschini et al., 2006; Borch et al., 2006; Pannella et al., 2006; Cimatti et al., 2006; Abraham et al., 2007).
Some authors (e.g., van Dokkum, 2005) have questioned the absence of growth among massive galaxies, pointing to a high rate of tidal features in local examples, indicative of recent merging. It is likewise argued (Drory et al., 2004; van der Wel et al., 2006; Maraston et al., 2006; Kannappan & Gawiser, 2007) that stellar masses derived from optical-infrared photometry may suffer biases that lead to large uncertainties in the inferred growth rate. Beyond such concerns, interpreting the observed evolution in the context of the CDM paradigm necessitates appealing to potentially uncertain semi-analytic models. Clearly what is needed is a way to connect observations of galaxy growth directly to the assembly history of the halos in which they reside.
Spheroidal galaxies offer particular advantages in this regard. First, because of their regular mass profiles, spectroscopic observations can be used to infer the dynamical mass, bypassing luminous quantities. Second, because of their pressure-supported dynamical configurations, they are expected to result, for the most part, from mergers (e.g., Toomre, 1977; Springel et al., 2005a). Accordingly, their evolving abundances can be compared directly to the expected assembly history of dark matter halos. In this Letter we develop a technique to estimate dynamical and halo masses for a large sample of field spheroidals and use it to interpret their evolution in the context of halo assembly as predicted in numerical simulations. We assume , , km s-1 Mpc-1.
2. Observations and Mass Estimates
The dynamical mass (hereafter ) measurements used in this Letter are based on the analysis presented in Treu et al. (2005), to which we refer for details. Briefly, this sample comprises 165 field visually-classified spheroidals selected from ACS imaging in the northern GOODS field to a magnitude limit of and studied with the DEIMOS spectrograph on Keck II. A subset of 125 galaxies have reliable stellar velocity dispersions, stellar masses, and surface photometry fits, which provide -band effective radii, (see Treu et al., 2005). Dynamical masses were derived using the formula, where is the virial coefficient and is the central velocity dispersion, obtained by increasing the observed dispersion by 10% to correct to the standard circular aperture of diameter . Detailed modelling of fiber as well as 3D spectroscopy of nearby ellipticals supports the use of this equation (Padmanabhan et al., 2004; Cappellari et al., 2006) with little uncertainties due to the overall flatness of the velocity dispersion profile.
With the kinematic sample defined in this way, the investigation that follows is based on the much larger sample of galaxies with stellar masses (hereafter ) in both GOODS fields with (Bundy et al., 2005). We refer to that paper for further details but summarize the key features. For , spectroscopic redshifts for 633 galaxies from the Keck Team Redshift Survey (KTRS, Wirth et al., 2004) were supplemented with 695 determined using photometric techniques (see Bundy et al., 2005). The full sample of morphologically-selected spheroidals includes 393 sources. Using deep Ks-band imaging obtained at Palomar Observatory for GOODS-N and publicly available data in GOODS-S, stellar masses were estimated assuming a Chabrier (Chabrier, 2003) initial mass function (IMF) using the code described in Bundy et al. (2006)111The results can be adjusted to those for a Salpeter IMF by adding 0.25 dex to the derived masses.. For galaxies with photometric redshifts, an additional 0.3 dex is added in quadrature to the base uncertainty which is typically 0.2 dex (Bundy et al., 2005, 2006).
As discussed in Bundy et al. (2005), the GOODS morphological sample is complete in the Ks-band but becomes incomplete for very red galaxies below a certain stellar mass limit as a result of the limit (see their Figure 4). By considering synthetic SEDs representing red (in color) stellar populations, we determine mass limits of for redshifts, . The completeness limits of the MFs below are determined at the near edge of each redshift interval. When comparing to we employ the more strict, volume-limited limits at the far edge of each interval (see discussion in Bundy et al., 2006).
3. Linking Dynamical Masses and Stellar Masses
We begin by restricting our analysis to those 125 spheroidals in GOODS-N for which both and measurements are available. The aim is to develop scaling relations that can be applied to the larger GOODS-N/S sample. For local galaxies, a fairly tight correlation of the form has been observed by several authors (e.g., Padmanabhan et al., 2004; Cappellari et al., 2006; Gallazzi et al., 2006). Gallazzi et al. (2006) exploited a local sample of early-type systems selected by concentration, and find —the zeropoint is not explicitly solved for. In this work, we adopt a zeropoint such that at M⊙, and also apply it to the Gallazzi et al. (2006) relation. This choice corresponds to and 6.6 at and and is motivated by the fact that the depends on the mass density profile and, most importantly, on the spectroscopic aperture used to measure . Since the aperture is effectively redshift-dependent (the slit width is fixed at 1″), assuming a constant could introduce a spurious redshift dependency. Similarly, while there is no evidence that the density profile evolves for high mass spheroidals (e.g., Koopmans et al., 2006), potential evolution could mimic changes in the MF if were held fixed. More detailed studies are needed in order to determine the normalization independently.

We examine the – relation at and in Figure 1, restricting the comparison to systems above our completeness limit; the best fit values for are also indicated. Our observed slopes are formally consistent with those of Gallazzi et al. (2006, ) at and Rettura et al. (2006, ) at (di Serego Alighieri et al., 2005, see also), although some differences may be expected as a result of sample selection and fiber- versus slit-based measures of velocity dispersion. The fact that reflects the “tilt” of the Fundamental Plane (e.g. Faber et al., 1987; Ciotti et al., 1996; Renzini, 2006) and is consistent with non-homology (e.g. Trujillo et al., 2004) including an increasing dark matter fraction within at higher masses (e.g. Padmanabhan et al., 2004; Gallazzi et al., 2006; Bolton et al., 2007). With regard to what follows, the key result in Figure 1 is that shows no measurable evolution across our sample. In 4, we will show that this leads to dynamical MFs that behave similarly to their stellar mass counterparts. For consistency, final estimates for galaxies in the full GOODS sample are determined using the value of determined for the two redshift bins, and the final uncertainty in is taken to be the sum in quadrature of the uncertainty in and the scatter in Figure 1.
4. The Dynamical Mass Function
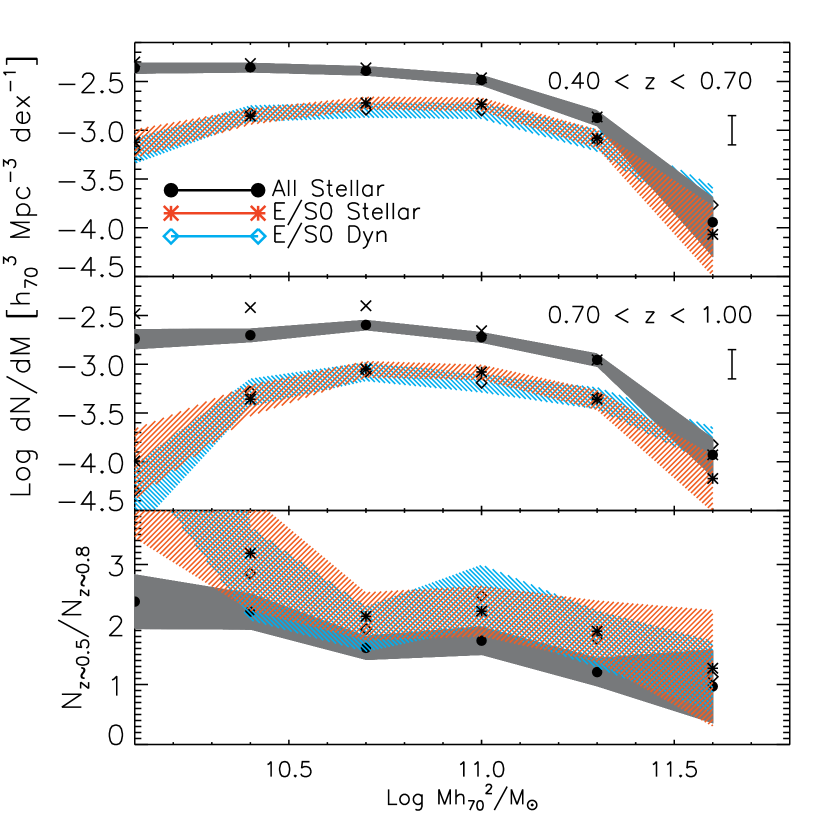
Using the estimates derived above for the full GOODS sample, we now construct the dynamical MF and compare with its stellar mass counterpart in the top two panels of Figure 2. We use the estimator and closely follow the method described in Bundy et al. (2005). The solid points with grey shading show the stellar MF for the full sample, while the crosses indicate the full stellar MF that results when the magnitude limit is relaxed to . The bottom panel of Figure 2 shows the differential growth derived across the two redshift bins.
Figure 2 demonstrates consistency between the stellar MFs and dynamical MFs. Although our adopted zeropoint in the relations ensures a similar vertical normalization, the application of our scaling relations does not mean both MFs should have the same shape. Indeed, small differences are noticeable in our highest mass bin. The good agreement results in large part from the fact that the – relation does not vary significantly across our sample. Had a variation in with redshift been present in Figure 1, the resulting dynamical MFs would evolve with respect to the stellar MFs. The fact the two agree validates earlier stellar mass estimates at and the top-down growth in the abundance of spheroidals derived from those measures.
5. Testing the Role of Mergers
We now turn to the key question which our analysis can address: is the rising abundance with time of spheroidal galaxies consistent with that predicted by the growth of merging dark matter halos? To answer this question we adopt a simple, observationally-motivated model to connect and to the virial mass, , of the host halos. Lensing studies of early-type galaxies at Gavazzi et al. (see 2007, and references therein) show that the total mass density profile of spheroidal halos is nearly isothermal within the halo scale radius, . We therefore assume a mass profile that is isothermal for and follows a profile (NFW, Navarro et al., 1997) for . We note that the behavior at large radii () is consistent with non-NFW scaling laws which can disagree instead at small radii (e.g., Graham et al., 2006). The mass profile assumed here is given by , where is the observed central velocity dispersion and we have introduced the scaling parameter, , which can be used to tune the profile shape to observations. By comparing to Gavazzi et al. (2007), we find —future observations will constrain as a function of redshift and mass. We define , where is the cosmic critical density, is the overdensity parameter (see Bryan & Norman, 1998), and . The concentration, , is assumed to the follow the relation found in simulations, (Bullock et al., 2001). Using this model and the relations above, we solve for as a function of velocity dispersion and find,
| (1) |
where has units of M⊙, is the velocity dispersion in units of 200 km s-1, and the fit parameters are given by , and . Equation 1 follows from the model described above and so random uncertainties on the fitting parameters are negligible. However, systematic errors resulting from tuning this model to observations should reflect the uncertainty found by Gavazzi et al. (2007) of 0.2 dex. Using our kinematic sample for which we measure both and , we can also directly compare and , finding the following relation:
| (2) |
where a Chabrier IMF was assumed as before and has units of M⊙. The best fitting parameters are and , where dex and accounts for the systematic uncertainty in Equation 1 (0.2 dex) as well as uncertainty in the stellar IMF (0.15 dex). Equations 1 and 2 are applicable for galaxies with and kms-1. Equation 2 gives values of , consistent with Mandelbaum et al. (2005) and Gavazzi et al. (2007). We note that our marginally non-zero value of , if confirmed, implies a slight increase with time of (30%) over that is consistent with halo growth (see discussion in Conroy et al., 2007) and independent evidence that stellar mass assembly is mostly completed by (e.g. Treu et al., 2005). We also note that virial mass and stellar mass turn out to be approximately in linear proportion within this mass range. Studies with a larger dynamical range in stellar masses and velocity dispersion, and more weak lensing measurements, are needed to measure the slope with higher precision and detect departures from linearity, expected as a result of varying star formation efficiency with halo mass.
Using Equation 2 we estimate halo virial masses for our sample and compare the resulting virial MFs in the top panel of Figure 3. The dashed line is the total halo mass function predicted at (it evolves little over ) using the online Millennium Simulation Database222http://www.mpa-garching.mpg.de/millennium. The “milli-Millennium” Database covers a volume of Mpc3, nearly 4 times larger than our largest sampled volume at . (Springel et al., 2005b) and adjusted in number density by 0.1 dex to be consistent with the spheroidal MFs (this adjustment is within the expected cosmic variance of 0.15 dex). The dotted line shows a local () estimate constructed by converting the MF for early-types (based on concentration, ) measured by Bell et al. (2003) into a virial MF using Equation 2. Adjustments of 0.1 dex were also applied to the local number density and the local mass scale to match the GOODS sample at high masses. Such corrections are likely needed as a result of cosmic variance, differing selection and mass estimate methods, and photometric uncertainties. Thus, comparisons between our results and the local MF must be done with caution.
The top panel of Figure 3 reveals a similar pattern of evolution as seen in Figure 2. A useful interpretation of this evolution is given in the bottom panel of Figure 3 which plots the difference (), thereby displaying the halo MF of new spheroidals that have appeared over the time interval separating the two redshift windows and providing a way to compare with the incidence of halo mergers. We use the MPAHalo milli-Millennium database to identify halos that have experienced a recent merger, at which point two previously separate halos or subhalos become a single halo. Halo merging often occurs several Gyr after halo accretion, defined by the point at which the two progenitor halos first become associated with the same friends-of-friends (FOF) group. Because the smaller progenitor halo may experience significant tidal stripping after halo accretion but before merging (see Gao et al., 2004), we take the merger mass ratio to be the initial ratio before halo accretion.
After integrating over the two time intervals that separate our observations, we overplot two merging scenarios in the bottom panel of Figure 3 (the 0.1 dex vertical offset is also applied). It is a striking result that major halo mergers (mass ratios greater than 1:3, indicated by dark lines) cannot account for the rise of spheroidal systems over the two epochs probed here. The light yellow lines (without symbols) show this is still the case when a 0.5 Gyr delay is added to the merger timescale (as suggested by expected differences in the galaxy and halo merger times). We note that at the highest masses probed there is an indication that the predicted merger frequency rises above the growth of new spheroidals. This might be expected since most systems at such masses already exhibit spheroidal morphologies by these redshifts (e.g., Bundy et al., 2005), suggesting such interactions represent “dry” mergers (e.g., van Dokkum, 2005).

6. Discussion
By constructing dynamical mass functions for 393 field spheroidals and linking those mass estimates to the halos in which they reside, we have found a significant result in the bottom panel of Figure 3: major merging of dark matter halos as described by CDM does not occur frequently enough to explain the observed increase in the mass function of spheroidal galaxies. A check made by appealing to the semi-analytic model of de Lucia & Blaizot (2007) shows a similar result when a galaxy’s stellar mass is used to define recent mergers and even when is used as the “accounting variable.”
If merging is not the only mechanism that produces newly-formed spheroidals since , other physical processes likely play a significant role. These may include mechanisms for transforming disk and irregular galaxies into relaxed spheroidals, for example secular bulge growth accompanied by disk fading. Indeed, recent semi-analytic models (e.g., Croton et al., 2006; Bower et al., 2006; de Lucia & Blaizot, 2007) have required prescriptions for such mechanisms, in addition to mergers, to match the local abundance of spheroidals. More work is needed to understand these processes and their role in morphological evolution.
References
- Abraham et al. (2007) Abraham, R. G. et al. 2007, preprint (astro-ph/0701779)
- Bell et al. (2003) Bell, E. F., McIntosh, D. H., Katz, N., & Weinberg, M. D. 2003, ApJ, 585, L117
- Bolton et al. (2007) Bolton, A. S., Burles, S., Treu, T., Koopmans, L. V. E., & Moustakas, L. A. 2007, preprint (astro-ph/0701706)
- Borch et al. (2006) Borch, A. et al. 2006, preprint (astro-ph/0604405)
- Bower et al. (2006) Bower, R. G. et al. 2006, MNRAS, 370, 645
- Bryan & Norman (1998) Bryan, G. L. & Norman, M. L. 1998, ApJ, 495, 80
- Bullock et al. (2001) Bullock, J. S., Kolatt, T. S., Sigad, Y., Somerville, R. S., Kravtsov, A. V., Klypin, A. A., Primack, J. R., & Dekel, A. 2001, MNRAS, 321, 559
- Bundy et al. (2005) Bundy, K., Ellis, R. S., & Conselice, C. J. 2005, ApJ, 625, 621
- Bundy et al. (2006) Bundy, K. et al. 2006, ApJ, 651, 120
- Cappellari et al. (2006) Cappellari, M. et al. 2006, MNRAS, 366, 1126
- Chabrier (2003) Chabrier, G. 2003, PASP, 115, 763
- Cimatti et al. (2006) Cimatti, A., Daddi, E., & Renzini, A. 2006, A&A, 453, L29
- Ciotti et al. (1996) Ciotti, L., Lanzoni, B., & Renzini, A. 1996, MNRAS, 282, 1
- Conroy et al. (2007) Conroy, C. et al. 2007, ApJ, 654, 153
- Croton et al. (2006) Croton, D. J. et al. 2006, MNRAS, 365, 11
- de Lucia & Blaizot (2007) de Lucia, G. & Blaizot, J. 2007, MNRAS, 375, 2
- di Serego Alighieri et al. (2005) di Serego Alighieri, S. et al. 2005, A&A, 442, 125
- Drory et al. (2004) Drory, N., Bender, R., & Hopp, U. 2004, ApJ, 616, L103
- Faber et al. (1987) Faber, S. M., Dressler, A., Davies, R. L., Burstein, D., & Lynden-Bell, D. 1987, in Nearly Normal Galaxies. From the Planck Time to the Present, ed. S. M. Faber, 175–183
- Franceschini et al. (2006) Franceschini, A. et al. 2006, A&A, 453, 397
- Gallazzi et al. (2006) Gallazzi, A., Charlot, S., Brinchmann, J., & White, S. D. M. 2006, MNRAS, 370, 1106
- Gao et al. (2004) Gao, L., White, S. D. M., Jenkins, A., Stoehr, F., & Springel, V. 2004, MNRAS, 355, 819
- Gavazzi et al. (2007) Gavazzi, R., Treu, T., Rhodes, J. D., Koopmans, L. V., Bolton, A. S., Burles, S., Massey, R., & Moustakas, L. A. 2007, preprint (astro-ph/0701589)
- Graham et al. (2006) Graham, A. W., Merritt, D., Moore, B., Diemand, J., & Terzić, B. 2006, AJ, 132, 2701
- Kannappan & Gawiser (2007) Kannappan, S. J. & Gawiser, E. 2007, preprint (astro-ph/0701749)
- Koopmans et al. (2006) Koopmans, L. V. E., Treu, T., Bolton, A. S., Burles, S., & Moustakas, L. A. 2006, ApJ, 649, 599
- Mandelbaum et al. (2005) Mandelbaum, R., Tasitsiomi, A., Seljak, U., Kravtsov, A. V., & Wechsler, R. H. 2005, MNRAS, 362, 1451
- Maraston et al. (2006) Maraston, C. et al. 2006, preprint (astro-ph/0604530)
- Navarro et al. (1997) Navarro, J. F., Frenk, C. S., & White, S. D. M. 1997, ApJ, 490, 493
- Padmanabhan et al. (2004) Padmanabhan, N. et al. 2004, New Astronomy, 9, 329
- Pannella et al. (2006) Pannella, M. et al. 2006, ApJ, 639, L1
- Renzini (2006) Renzini, A. 2006, ARA&A, 44, 141
- Rettura et al. (2006) Rettura, A., Rosati, P., Strazzullo, V., Dickinson, M., Fosbury, R. A. E., Rocca-Volmerange, B., Cimatti, A., di Serego Alighieri, S., Kuntschner, H., Lanzoni, B., Nonino, M., Popesso, P., Stern, D., Eisenhardt, P. R., Lidman, C., & Stanford, S. A. 2006, A&A, 458, 717
- Springel et al. (2005a) Springel, V., Di Matteo, T., & Hernquist, L. 2005a, ApJ, 620, L79
- Springel et al. (2005b) Springel, V. et al. 2005b, Nature, 435, 629
- Tanaka et al. (2005) Tanaka, M. et al. 2005, MNRAS, 362, 268
- Toomre (1977) Toomre, A. 1977, in Evolution of Galaxies and Stellar Populations, 401–+
- Treu et al. (2005) Treu, T. et al. 2005, ApJ, 633, 174
- Trujillo et al. (2004) Trujillo, I., Burkert, A., & Bell, E. F. 2004, ApJ, 600, L39
- van der Wel et al. (2006) van der Wel, A. et al. 2006, ApJ, 652, 97
- van Dokkum (2005) van Dokkum, P. G. 2005, AJ, 130, 2647
- Wirth et al. (2004) Wirth, G. D. et al. 2004, AJ, 127, 3121