A Connection Between Bulge Properties and the Bimodality of Galaxies
Abstract
The global colors and structural properties of galaxies have recently been shown to follow bimodal distributions. Galaxies separate into a “red sequence”, populated prototypically by early-type galaxies, and a “blue cloud”, whose typical objects are late-type disk galaxies. Intermediate-type (Sa-Sbc) galaxies populate both regions. It has been suggested that this bimodality reflects the two-component nature of disk-bulge galaxies. However, it has now been established that there are two types of bulges: “classical bulges” that are dynamically hot systems resembling (little) ellipticals, and “pseudobulges”, dynamically cold, flattened, disk-like structures that could not have formed via violent relaxation. Alas, given the different formation mechanisms of these bulges, the question is whether at types Sa-Sbc, where both bulge types are found, the red-blue dichotomy separates galaxies at some value of disk-to-bulge ratio, , or, whether it separates galaxies of different bulge type, irrespective of their .
In this paper, we identify classical bulges and pseudobulges morphologically with HST images in a sample of nearby galaxies. Detailed surface photometry reveals that: (1) The red – blue dichotomy is a function of bulge type: at the same , pseudobulges are in globally blue galaxies and classical bulges are in globally red galaxies. (2) Bulge type also predicts where the galaxy lies in other (bimodal) global structural parameters: global Sérsic index and central surface brightness. (3) Hence, the red – blue dichotomy is not due to decreasing bulge prominence alone, and the bulge type of a galaxy carries significance for the galaxy’s evolutionary history.
We interpret this result as showing that the type of bulge a galaxy has is a signpost of the evolutionary history of the whole galaxy. Classical bulges are thought to indicate that a galaxy has undergone violent relaxation, e.g. during a major merger (of smaller fragments) in its past. This is more likely to have happened earlier when merging was frequent, in higher-density environments, and when there was still enough gas to subsequently form the disk. Therefore, these galaxies are likely to be red today. Pseudobulges are disk components and therefore indicate a disk-only galaxy. Such a galaxy has not suffered a major merger since the formation of its disk. This is more likely at later epochs, when the merger rate is lower and in low-density environments. Therefore, these are likely to be younger, blue galaxies. In addition, there is evidence that pseudobulge galaxies harbor supermassive black holes that follow the – relation. We discuss the effect of black hole feedback in the host galaxy. If feedback during black hole growth in classical bulges is what quenches star formation in their host galaxies, why does this not happen in galaxies with pseudobulges?
Subject headings:
galaxies: bulges — galaxies: formation — galaxies: evolution — galaxies: structure — galaxies: fundamental parameters1. Introduction
The study of the statistical properties of galaxies has advanced rapidly due to the release of large amounts of homogeneously sampled data from wide area surveys such as the Sloan Digital Sky Survey (SDSS; York et al., 2000). The most notable result of recent years has been the bimodal distribution of many galaxy properties. Galaxies are bimodally distributed in the color–magnitude plane separating into a red sequence and a blue cloud (Strateva et al., 2001; Balogh et al., 2004; Baldry et al., 2004) and also (Liske et al., 2003; Driver et al., 2006). Other structural parameters, such as luminosity, size, surface density, and concentration, separate similarly into two sequences (Blanton et al., 2003; Shen et al., 2003; Kauffmann et al., 2003b; Driver et al., 2006). Stellar populations and stellar masses and mass surface density follow as well (Kauffmann et al., 2003a, b).
It is worth pointing out that some aspects of this bimodality in galaxy properties have been known in other forms for a while. An example is the existence of a tight color–magnitude relation for early-type galaxies and the non-existence of such a relation for late-type galaxies (de Vaucouleurs & de Vaucouleurs, 1973).
The fact that the bimodality is manifested in many parameters in a similar way is perhaps not surprising. Structural and stellar population related parameters of galaxies are known to be well correlated, giving rise to galaxy classification schemes such as the Hubble Sequence (Hubble, 1926; Sandage, 1961; see Roberts & Haynes, 1994 for a review of parameter correlations along the Hubble Sequence).
On the one extreme of the Hubble Sequence we find elliptical (E) galaxies, which are thought to be the prototypical red-sequence objects, and on the other extreme pure disk galaxies (Sd-Sm), which populate the blue cloud. Intermediate-type (Sa-Sbc) galaxies form a sequence in bulge-to-total ratio, , and therefore bridge the red and blue loci in the color–magnitude plane. It is therefore reasonable to attribute the bimodality seen in colors of galaxies to this bulge-disk two-component nature of galaxies, a point recently affirmed by Driver et al. (2006).
Yet, identifying the physical structures that are responsible for the bimodal distribution is not entirely straight-forward. Firstly, colors of disks and their associated bulges are correlated, such that redder disks harbor redder bulges (Peletier & Balcells, 1996; de Jong, 1996; MacArthur et al., 2004). Secondly, it has now been established that there are at least two types of bulges, where “bulge” is defined as the excess light over the inward extrapolation of the surface brightness profile of the outer disk. The common procedure in the literature to identify bulges is by surface brightness profile decomposition and this practice identifies all types of bulges in a common fashion. Thus we still refer to all the structures that are found in this way as “bulges”. A more physically motivated definition is given below, however the term “bulge” defined in such purely observational terms is still operationally useful and hence we will adopt this photometric definition in this paper. We will, however, prefix this observationally-motivated term “bulge” by physically-motivated qualifiers.
Many bulges are dynamically hot systems resembling elliptical galaxies that happen to have a disk around them (e.g. Renzini, 1999). These bulges are called “classical bulges”. Their formation is assumed to be similar to that of elliptical galaxies, which are thought to be the products of violent relaxation during major mergers. This happens in environmentally driven evolution (hierarchical clustering), which was the dominant process driving galaxy formation in the early universe.
On the other hand, “pseudobulges” are bulges that have structure and kinematics resembling that of disks. They are believed to have formed via dramatically different formation channels than those responsible for the formation of classical bulges (see Kormendy & Kennicutt, 2004 for a comprehensive review). Pseudobulges are dynamically cold (Kormendy, 1993). They have flattening similar to that of the outer disk (Kent, 1985; Kormendy, 1993; Fathi & Peletier, 2003; Kormendy & Fisher, 2005; Kormendy et al., 2006). Also, they may have embedded secondary bars, rings, and/or spiral structure (Carollo et al., 1997). All these are disk phenomena which do not occur in hot stellar systems. Therefore, these bulges could not have been formed by mergers involving violent relaxation. Instead, they are thought to form through slow rearrangement of disk material. Disk galaxies form their structural analogs to these nuclear features as a result of having high angular momentum compared to random motions. We expect a similar phenomenon is occurring in pseudobulges. Kormendy (1993) shows that some bulges do have stellar dynamics which resemble inclined disks better than they do oblate rotators.
What can drive disk galaxies to reshape themselves to form a pseudobulge? Non-axisymmetries in the gravitational potential (bars, ovals, spiral structure) redistribute energy and angular momentum in disks. A large body of literature reviewed by Kormendy & Kennicutt (2004) makes a strong case that bars rearrange disk gas into inner rings, outer rings, and dump gas into the center. All indications are that internal evolution builds up the central gas density, resulting in star formation and bulge-like stellar densities, thus forming pseudobulges. Internal evolution is mostly “secular” – its timescales are much longer than the collapse time. Fisher (2006) shows that pseudobulges are experiencing enhanced star formation over classical bulges. This further favors the idea that pseudobulges form through a slower process (secular evolution), and hence are still being built today. For recent reviews on this subject see Kormendy & Kennicutt (2004) and Athanassoula (2005).
Hence, if pseudobulges are truly disk phenomena (in some way like bars or rings), it is natural to expect that the dichotomy of galaxy properties is not merely a product of changing bulge-to-total ratio, but distinguishes disks (including their pseudobulges) from classical bulges. This imposes us to ask two questions. Do galaxies with pseudobulges behave like bulgeless pure disk galaxies? Secondly, is the location of a galaxy with respect to the (color) bimodality determined by the relative prominence of its bulge and disk components alone?
The existence of a dichotomy among bulges themselves offers an opportunity to test this. The question becomes whether at intermediate Hubble types of Sa-Sbc, where both bulge types are found, the color bimodality separates galaxies at some bulge-to-total ratio, or, whether it separates galaxies of different bulge type, irrespective of bulge-to-total ratio (or neither).
In this paper, we answer these questions by comparing the location of galaxies with pseudobulges to that of galaxies with classical bulges with respect to the bimodality of the color and structural distributions of galaxies in general, i.e. we look for a relationship between the type of bulge a galaxy has and the global properties of the galaxy harboring the bulge.
This paper is organized as follows. Sect. 2 discusses the galaxy sample used in this work and lays out the analysis methods and bulge classification scheme we use. In Sect. 3 we present and discuss the dependence of galaxy properties on bulge type. Finally, we summarize and discuss our results in Sect. 4.
2. The galaxy sample
The aim of this work is to compare the location of galaxies with pseudobulges to that of galaxies with classical bulges with respect to the bimodal distribution of global galaxy colors and structural properties. We will compare the loci of galaxies with pseudobulges to that of galaxies with classical bulges in the color–magnitude plane ( vs. ) and structure-color plane (central surface brightness, , and global Sérsic index, , vs. ).
We select a sample of 39 galaxies spanning Hubble types S0 to Sc by cross referencing the Third Reference Catalog of Bright Galaxies (RC3; de Vaucouleurs et al., 1991), the Sloan Digital Sky Survey Data Release Four (SDSS - DR4) database (Adelman-McCarthy et al., 2006), and the Hubble Space Telescope (HST) archive. We require that the galaxies have inclination to reduce the effect of dust. We will use the RC3 Hubble classification, colors and total magnitudes from SDSS images, and surface brightness profile fits to combined HST and SDSS surface photometry. We identify pseudobulges and classical bulges using the high-resolution HST images. We maintain a roughly even sampling of Hubble types from S0 to Sc.
2.1. Identification of pseudobulges
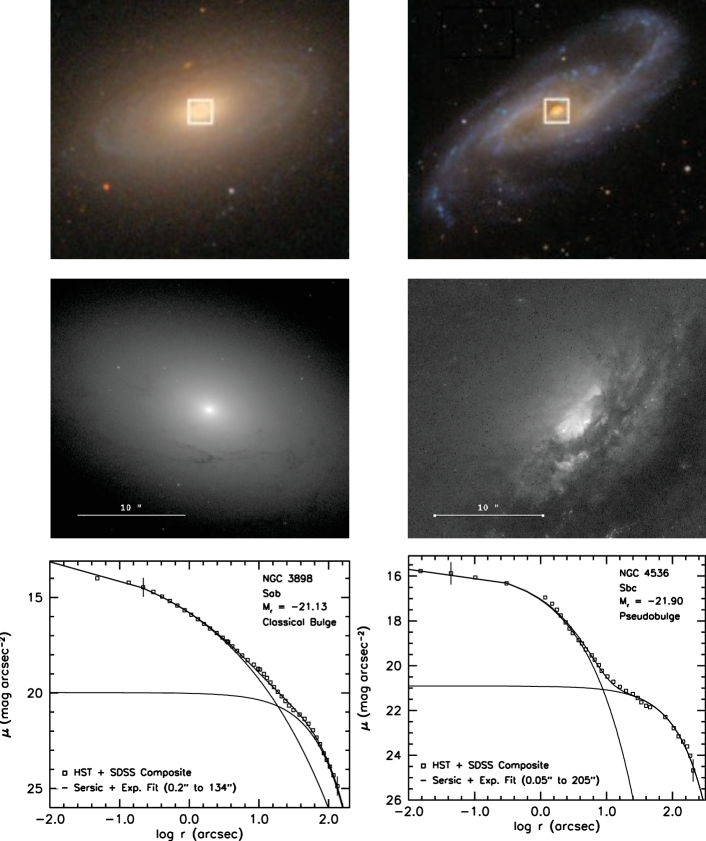
In this study, we classify galaxies as having a pseudobulge using bulge morphology; if the “bulge” is or contains a nuclear bar, nuclear spiral, and/or nuclear ring the “bulge” is actually a pseudobulge. Conversely if the bulge is featureless and more round than the outer disk, the bulge is called a classical bulge. Fig. 1 illustrates typical examples of what we identify as classical bulges (left panels) and a pseudobulges (right panels). Notice first, that the classical bulge (NGC 3898) has a smooth and regular stellar light profile as seen in the WFPC2 F547M image in the middle panel of Fig. 1. There is no reason evident in the image to think that this galaxy harbors a pseudobulge. On the other hand, NGC 4536 is a typical example of a galaxy with nuclear spiral structure and patchiness (i.e. a pseudobulge). A decomposition of the stellar surface brightness profile shows that the pseudobulge dominates the light profile to a radius of arcseconds. The WFPC2 F606W image in the middle panel implies that the entire pseudobulge appears to exhibit spiral structure. Notice that spiral structure exists in the small region inside the box on the wider field SDSS image. Also notice that the classical bulge has a profile, while the pseudobulge is nearly exponential.
We identify pseudobulges using HST archival images in the optical wavelength regime ( through ) . This makes bulge classification subject to the effects of dust. However, the structures used to identify pseudobulges are usually experiencing enhanced star formation rates, and are easier to detect in the optical region of the spectrum where the mass-to-light ratios are more affected by young stellar populations, rather than in the near infrared where the effects of dust are lesser. Classical bulges may have dust in their center, as do many elliptical galaxies (Lauer et al., 2005). The presence of dust alone is not enough to classify a galaxy as containing a pseudobulge.
Another caveat when using morphology is that the structures we wish to identify as well as the color of a galaxy can be distorted or altered during early stages of a merger. For example NGC 3169 and NGC 3166 form a close pair (separation is kpc). Sandage & Bedke (1994) note that NGC 3169 shows a warped disk and peculiar morphology. Both of these galaxies have nuclear structure that is similar to structure found in pseudobulges. However, given the presence of the companion, we cannot say whether the central structure represents a secularly-evolved pseudobulge or is due to short-term merger-induced gas inflow and star formation (see Kannappan et al., 2004).
We use the NASA Extragalactic Database (NED) to search for any evidence of close companions of similar magnitude, tidal distortions, or peculiar morphology. We remove those galaxies which seem to be interacting with other galaxies from our sample. Three galaxies in our sample have companions at kpc, which do not appear to affect the morphology of these galaxies’ disks.
Of the 39 galaxies in our sample, 10 galaxies are classified as having a classical bulge (3 S0, 3 Sa, and 4 Sab) and 29 galaxies are classified as having a pseudobulge (3 S0, 4 Sa, 1 Sab, 5 Sb, 6 Sbc, and 10 Sc). We do not distinguish between barred and unbarred galaxies in this work. The sample ends up favoring pseudobulges over classical bulges, most likely due to the constraint of even sampling along Hubble types as pseudobulges are more common in late type galaxies.
Table 1 lists the galaxies in our bulge sample along with their bulge classification, Hubble types, magnitudes, colors, and other derived quantities (described below).
2.2. Photometry
We calculate total magnitudes and colors from direct integration of 2D surface brightness profiles in the SDSS and band images. We use the code of Bender et al. (1988) on images available publicly from the SDSS archive (Adelman-McCarthy et al., 2006).
First, interfering foreground objects are identified in each image and masked manually. Then, isophotes are sampled by 256 points equally spaced in an angle relating to polar angle by , where is the polar angle and is the axial ratio. An ellipse is then fitted to each isophote by least squares. The software determines six parameters for each ellipse: relative surface brightness, center position, major and minor axis lengths, and position angle along the major axis.
To calculate the structural quantities central surface brightness, , and global Sérsic index, , we fit a Sérsic function,
| (1) |
to the mean isophote axis of SDSS surface brightness profiles. It is well known that surface brightness profiles of intermediate type galaxies are not well described by single component models. At least two component functions (bulge plus outer disk) are required; also, many galaxies contain bars, rings and ovals that further complicate the surface brightness profile. For the nearby galaxies in our bulge sample a single-component Sérsic fit is clearly not an excellent fit to the galaxies’ light profiles. However, we wish to compare these fits to the published manifestations of the galaxy bimodality. Therefore, we must calculate quantities similar to those in large surveys. Typical root-mean-square deviations of our Sérsic fits to the galaxy profiles are 0.1-0.2 mag arcsec-2.
Bulge-to-total () ratios are calculated by fitting Sérsic functions combined with an exponential for the outer disk to the 1D surface brightness profile of each galaxy:
| (2) |
where the and reflect central surface brightness and scale length of the bulge, while and are the analogous quantities for the outer disk. is the Sérsic index of the bulge.
Equation 2 is fit to surface brightness profiles generated from HST archival images combined with SDSS band photometry as discussed above. For calculating , we allow the bulge and the disk component to have individual ellipticities, which we take to be the average ellipticity within each component. This definitely adds a little uncertainty to the resulting , as both bulges and disks are known to have varying ellipticity profiles (Fathi & Peletier, 2003). However, for our purposes this method is sufficient. Finally, the that we quote is the ratio of the radially integrated Sérsic function and the radially integrated sum of the Sérsic and the exponential. We have checked that there is no trend of with inclination for pseudobulges, classical bulges, or the combined sample.
We refer the reader to Table 1, where these quantities are listed for all our bulge galaxies.
3. Dependence of bimodal galaxy properties on bulge type
Does the shift from the blue cloud to the red sequence coincide with a shift in predominance of the disk to the bulge?
Using extensive 2D photometry, Driver et al. (2006) find that the bimodality of galaxies in color–magnitude space becomes more pronounced when the color is constrained to the central region of the galaxy. They also show that the concentration of the galaxy, parameterized by global Sérsic index, participates in the bimodality in galaxy properties as well. This motivates them to suggest that the fundamental division of galaxies is merely that of bulges (old, red, high concentration) and disks (star forming, blue, diffuse). With this two-component nature of galaxies, the position of an object on the blue–red divide is thought of as a function of the bulge-to-total ratio, , alone.
The existence of intermediate-type Sa-Sbc galaxies on both the red and blue sequence challenges the suggestion that the bimodality of galaxies divides along the disk-bulge dichotomy. Intermediate type galaxies have roughly constant (and large) bulge-to-total ratios on average (Simien & de Vaucouleurs, 1986). Bulge-to-total ratios begin to fall much more rapidly only at Hubble types Sbc-Sc and later. Moreover, disk color and bulge color are correlated: redder bulges reside in redder disks (Peletier & Balcells, 1996; de Jong, 1996; MacArthur et al., 2004). Galaxies are not made by randomly mixing disk and bulge components.
At issue, therefore, is whether the galaxy bimodality is just a product of changing emphasis of each subcomponent (i.e. simply ), or possibly a signature of differing evolutionary histories of the whole galaxy.
The existence of a dichotomy among bulges themselves offers the opportunity to test this. The question becomes whether at intermediate Hubble types of Sa-Sbc, where both bulge types are found, the color bimodality separates galaxies at some bulge-to-total ratio, or, whether it separates galaxies of different bulge type, irrespective of bulge-to-total ratio.
3.1. The color – magnitude plane and Hubble types
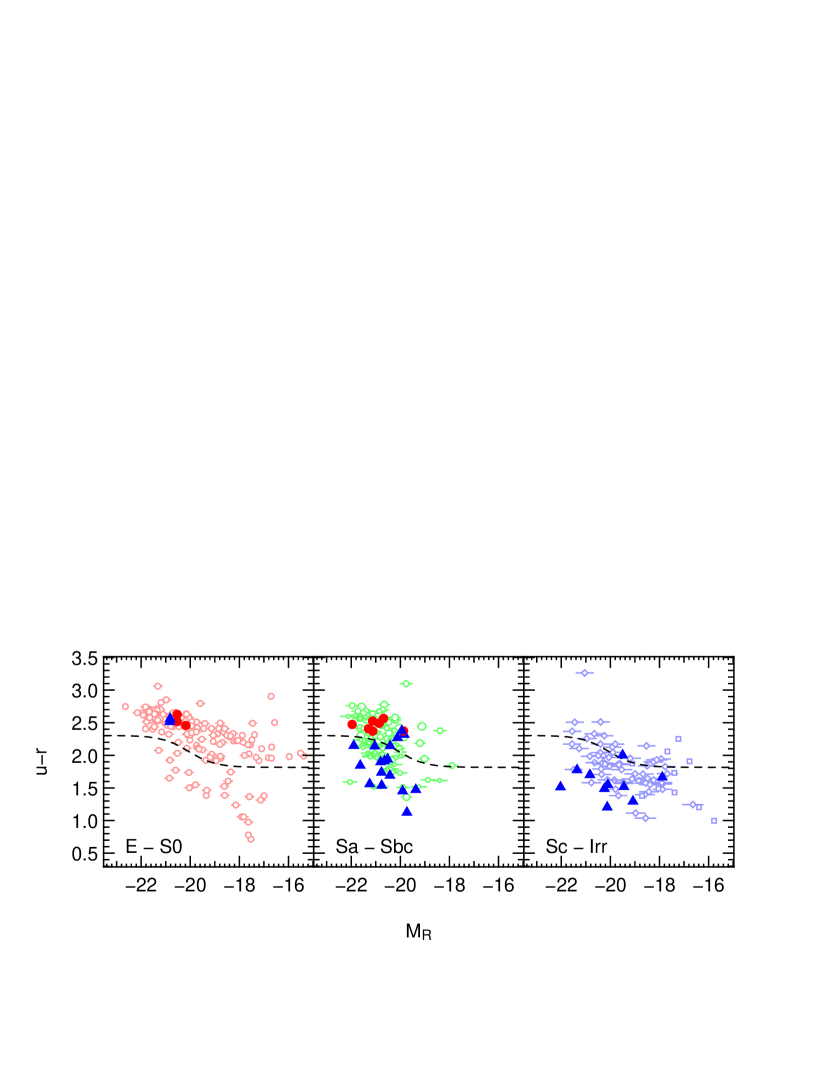
We examine galaxies of Hubble types spanning S0-Sc in the global color () versus total magnitude () plane, and we mark them according to their bulge type. Fig. 2 shows the location of galaxies with classical bulges (round symbols) and galaxies with pseudobulges (triangles; identified by bulge morphology as discussed in Sect. 2.1) in our sample in the vs. plane. Note that we plot the total galaxy color and total magnitude, not the bulge color and magnitude. We merely label the galaxies by their bulge type.
As a reference sample, we also plot 542 galaxies selected from the intersection of the SDSS-DR4 spectroscopic catalog and the RC3, having inclination , and that are at a distance . These galaxies divide into Hubble types as follows: 50 E, 112 S0, 48 Sa, 36 Sab, 67 Sb, 57 Sbc, 52 Sc, 40 Scd, 47 Sd, 17 Sm and 16 Irr. We use SDSS redshifts for distances and SDSS “model” magnitudes for colors and total magnitudes for these objects.
We note here that the magnitudes of the galaxies that we classify as having classical bulges or pseudobulges are computed by our own ellipse fitting discussed in Sect. 2.2. This may give different results compared to the SDSS model magnitudes which we use only for the reference sample objects in the color–magnitude plane. However, for galaxies with low total Sérsic index (as the intermediate types mainly are) there is very little difference in the type of magnitude (Graham et al., 2005). Also note that we do not correct the colors and magnitudes for the effects of extinction by dust. This may cause some disk galaxies to appear redder than their stellar populations are. We moderate this effect by restricting ourselves to low-inclination galaxies. However, some disk galaxies at the locus of the red sequence may have been moved there by the effect of dust. For illustrative reasons, we also plot the line dividing blue from red galaxies following Baldry et al. (2004).
Late types (Right panel in Fig. 2). As has been shown, late type galaxies (type Sc and later) are almost entirely on the blue sequence (e.g. Strateva et al., 2001). Note the caveat on dust extinction in disk galaxies discussed above; the reddest galaxies in this bin are most likely affected by dust extinction. We emphasize that the panel with Sc-Irr galaxies does not contain a single classical bulge. As the Hubble sequence progresses toward later types, galaxies tend to have small bulges or no bulge at all. This is indicative of a less violent past, as it is very likely that these galaxies have not experienced a merger event that would have formed a (classical) bulge since the time of formation of their disks. The fact that these galaxies seem to contain pseudobulges if they have a bulge at all, provides a strong reinforcement of this statement.
Intermediate types (Middle panel in Fig. 2). The intermediate type Sa-Sbc galaxies give us a sample on which to test our hypothesis. Nearly all (87%) galaxies with pseudobulges are bluer than the red–blue divide, while all the galaxies with classical bulges are redder than the divide. To show that this is not simply the consequence of the pseudobulge galaxies having lower bulge-to-total ratios than the classical bulge galaxies, recall first that the number of pseudobulges in our sample is not a step function at some late Hubble type (5 Sa, 2 Sab, 4 Sb, 6 Sbc) and that as noted above, at these intermediate types the Hubble sequence is not a strong sequence of bulge-to-total ratios (see Simien & de Vaucouleurs, 1986 and the review by Roberts & Haynes, 1994).
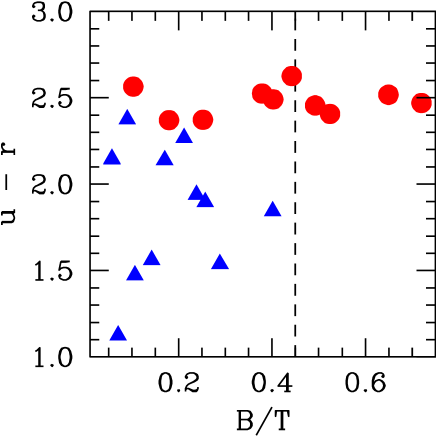
In fact, in the range of values spanned by galaxies with pseudobulges we find plenty of classical bulge galaxies as well. This is illustrated in Fig. 3, where we plot global against for 24 of our bulge galaxies. We calculate for all 10 classical bulge galaxies and all the 16 intermediate-type pseudobulge galaxies. Two of the latter (NGC 1068 and NGC 5691) are not well-fit by a two-component model (Equation 2) and hence we cannot obtain reliable numbers for these and they are not included in the plot (see also Table 1). Therefore the plot contains 14 pseudobulge galaxies.
In our sample, galaxies on the red sequence with classical bulges have ratios as low as 10%. Galaxies with pseudobulges have ratios as high as 40%. The majority of galaxies with classical bulges in our (small) sample have values in the same range as the galaxies with pseudobulges. Even at the lowest values in our intermediate type Sa-Sbc galaxies, the assignment of a galaxy to the red sequence or the blue cloud is predicted by its bulge type.
It is true that classical bulge galaxies extend to greater values than do pseudobulge galaxies. This is easily understood given the different formation channels that are thought to lead to classical bulges and to pseudobulges. Classical bulges are an extension of elliptical galaxies (formed via mergers) that happen to have a disk around them. This sort of evolution naturally extends all the way to (i.e. a pure elliptical galaxy; see also Kormendy & Bender, 1996). Pseudobulges form secularly by rearranging disk material. Therefore it seems unlikely that a disk would be able to make a pseudobulge equal in size to itself () through secular evolution.
Also note that in Fig. 2, there is no significant difference in the range of absolute magnitudes spanned by the pseudobulge galaxies and that of the classical-bulge galaxies. Pseudobulge galaxies are not systematically fainter in .
Concluding this discussion, we find that the red–blue bimodality cannot be a function of decreasing bulge prominence alone. Our results show that it is a function of bulge type. Pseudobulges are in blue galaxies and classical bulges are in red galaxies. Furthermore, galaxies with pseudobulges behave just like pure disk galaxies if we compare their distribution in global color to the distribution of pure disk (late-type) galaxies in Fig. 2. The type of bulge a galaxy has is a signpost for an evolutionary history of the total galaxy.
Early types (Left panel in Fig. 2). The early-type bin (E - S0) is almost entirely populated by red sequence galaxies. There are three galaxies that we identify as harboring pseudobulges in this panel. All three peudobulges are in S0 galaxies and these are on the red sequence. This illustrates a caveat when dealing with pseudobulges. They do not have to be young. A disk galaxy could have undergone secular evolution long ago and formed a pseudobulge. This is well illustrated by the aforementioned correlation between disk color and bulge color. As a side note, this implies that identifying pseudobulges using color only is bound to misclassify some pseudobulges and underestimate their number. Also, S0 galaxies exist at a wide range of bulge-to-total ratios, a point noticed by van den Bergh (1976). The processes that are thought to make S0 galaxies (e.g. gas stripping by ram pressure, harassment; Moore et al., 1996) operate independently of the processes that make bulges. It is reasonable to believe that the evolution which makes a galaxy an S0 happens independently of the secular evolution that makes a pseudobulge (see the discussion in Kormendy & Kennicutt, 2004). Therefore the position of S0 galaxies in color–magnitude space may be due to separate phenomenona, rather than posing a counter example to our hypothesis.
3.2. Global galaxy structure
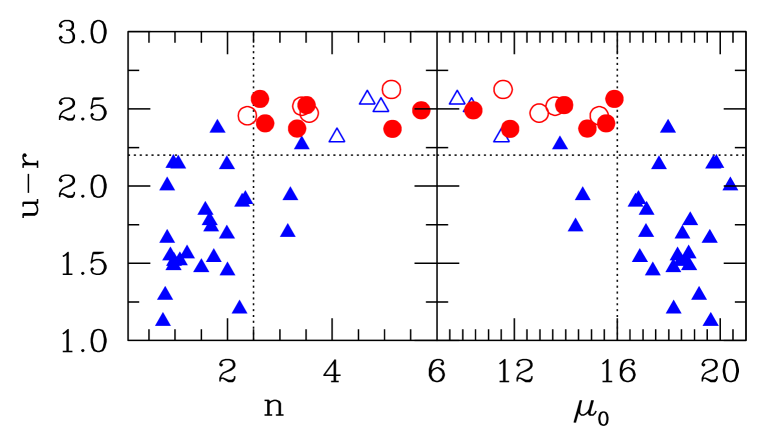
Blanton et al. (2003) show that the relation of structure to galaxy color is markedly different for red and blue galaxies. This can be illustrated by plotting the Sérsic index and a characteristic surface brightness against color. In Fig. 4, we illustrate the dependence of galaxy structure on bulge type. We mark the dividing line of red and blue galaxies with a horizontal line at (Strateva et al., 2001). Open symbols represent S0 galaxies, which likely arise due to distinct phenomena not related to bulge formation as discussed above, and thus do not follow the normal behavior for pseudobulge galaxies. In general, blue galaxies are more diffuse and have lower Sérsic index than galaxies with classical bulges. In both structural parameters there is a sharp transition from galaxies with pseudobulges to galaxies with classical bulges. Again, as in Fig. 2, we plot total color and Sérsic parameters from a global single-component fit. We mark galaxies by the type of their bulge.
The surface brightness at zero radius is recovered from the single component Sérsic fits (Eq. 1). Note that we report the fit value, which should be taken as a characteristic value of the galaxy as a whole. It is also worth noting that central surface brightness is more sensitive to the dichotomy in bulge types than surface brightness at the effective radius. Galaxies with classical bulges form a tight sequence in color that begins at (vertical line in the left panel) and extends to higher central surface densities, well populated by giant elliptical galaxies. There is a sharp transition at . Below this surface density, the diagram becomes completely populated by galaxies with pseudobulges.
The Sérsic index is normally interpreted as a parametrization of the shape of a surface brightness profile of a galaxy. A typical disk galaxy has and an intermediately sized elliptical galaxy has . In the right panel of Fig. 4, galaxies with pseudobulges have lower global Sérsic index than galaxies with classical bulges. And galaxies with classical bulges do not have global Sérsic index smaller than (vertical line in the right panel).
Galaxies with pseudobulges populate a broader range of color, yet the majority of pseudobulge galaxies are restricted to a more narrow range in central surface brightness than classical bulges. The smaller variation in and exponential surface brightness profiles are well known properties of disk galaxies (Freeman, 1970). We restate that our galaxies with pseudobulges and galaxies with classical bulges both populate the intermediate Hubble types Sa-Sbc. Thus, at the same Hubble type, galaxies with pseudobulges are more like pure disk galaxies than galaxies with classical bulges.
What is compelling is not only that global Sérsic index and central surface density are lower. In fact, the distribution of central surface brightness alone is not dichotomous. It is the combination of these quantities that reveals the structural dichotomies. The distribution in both the color – Sérsic and the color – plane is completely different for galaxies with pseudobulges and classical bulges. Further, the transition in this behavior is coincident with the transition from red galaxies to blue.
The behavior of color and structure is definitely more regular among classical bulges. This makes sense in context of the formation picture of these two types of bulges. Pseudobulges are structures that are continuously evolving. Therefore when we look at a sample of pseudobulge galaxies we are seeing them in many different stages of evolution. As the pseudobulge grows galaxy properties such as color, and will certainly change. However, classical bulges are thought to form in one or multiple discrete and short-lived events separated by periods of passive evolution. If the young stellar populations made in these events age into old, red populations on a timescale that is shorter than the time between star formation events, then classical bulges will spend most of their time looking homogeneously red. We find that the galaxies harboring these classical bulges are globally red. This implies that since the formation of the classical bulge, there has been relatively little evolution in the galaxy that contains it as a whole. Thus, properties of galaxies with classical bulges show little scatter compared to pseudobulge galaxies. Studies considering bulges as a heterogeneous class will likely shed light on such differences.
| Identifier | Type | Inclination | Bulge(a)(a)p – pseudobulge; c – classical bulge. | (b)(b)global Sérsic index and central surface brightness determined by a fit of Eq. 1 to the profiles of all classical bulge galaxies and the intermediate-type pseudobulge galaxies. | (b)(b)global Sérsic index and central surface brightness determined by a fit of Eq. 1 to the profiles of all classical bulge galaxies and the intermediate-type pseudobulge galaxies. | (c)(c) determined by a fit of Eq. 2 to the profile. | |||
|---|---|---|---|---|---|---|---|---|---|
| RC3 | degrees | mag | mag | mag | mag/arcsec2 | global Sérsic | |||
| NGC 2639 | Sa | 44 | 33.24 | c | 2.47 | -21.96 | 12.97 | 3.56 | 0.72 |
| NGC 2775 | Sab | 40 | 30.95 | c | 2.41 | -21.29 | 15.57 | 2.72 | 0.52 |
| NGC 2880(d)(d)Erwin (2004) finds nuclear bar or inner disk, we do not. | S0 | 68 | 31.83 | c | 2.52 | -20.53 | 13.59 | 3.42 | 0.65 |
| NGC 2962(d)(d)Erwin (2004) finds nuclear bar or inner disk, we do not. | S0 | 67 | 32.12 | c | 2.63 | -20.53 | 11.57 | 5.13 | 0.44 |
| NGC 3031 | Sab | 59 | 27.63 | c | 2.49 | -20.86 | 10.41 | 5.70 | 0.40 |
| NGC 3898 | Sab | 57 | 31.49 | c | 2.53 | -21.13 | 13.94 | 3.51 | 0.38 |
| NGC 4379 | S0 | 43 | 31.59 | c | 2.46 | -20.18 | 15.30 | 2.38 | 0.49 |
| NGC 4698 | Sab | 51 | 31.59 | c | 2.37 | -21.13 | 11.84 | 5.15 | 0.18 |
| NGC 4772 | Sa | 64 | 30.64 | c | 2.37 | -19.87 | 14.84 | 3.33 | 0.25 |
| NGC 5448 | Sa | 64 | 32.34 | c | 2.57 | -20.68 | 15.89 | 2.62 | 0.10 |
| NGC 1068 | Sb | 21 | 30.46 | p | 1.74 | -20.77 | 14.38 | 1.69 | —(e)(e)These galaxies are not well-fit by a two-component model. |
| NGC 1084 | Sc | 46 | 30.56 | p | 1.55 | -20.10 | 18.34 | 0.91 | … |
| NGC 2681 | S0 | 0 | 30.20 | p | 2.32 | -19.84 | 11.51 | 4.09 | … |
| NGC 2782 | Sa | 49 | 32.70 | p | 1.56 | -21.25 | 18.77 | 1.23 | 0.14 |
| NGC 2859 | S0 | 33 | 31.78 | p | 2.51 | -20.83 | 10.34 | 4.93 | … |
| NGC 2950 | S0 | 62 | 31.49 | p | 2.56 | -20.82 | 9.79 | 4.67 | … |
| NGC 2976 | Sc | 61 | 27.63 | p | 1.66 | -17.88 | 19.59 | 0.85 | … |
| NGC 3259 | Sbc | 61 | 31.97 | p | 1.47 | -19.37 | 18.18 | 1.50 | 0.11 |
| NGC 3338 | Sc | 54 | 32.06 | p | 1.78 | -21.36 | 18.83 | 1.66 | … |
| NGC 3351 | Sb | 42 | 29.24 | p | 2.38 | -19.94 | 17.97 | 1.81 | 0.09 |
| NGC 3359 | Sc | 53 | 30.98 | p | 1.21 | -20.13 | 18.19 | 2.23 | … |
| NGC 3368 | Sab | 55 | 29.24 | p | 2.27 | -20.12 | 13.78 | 3.42 | 0.21 |
| NGC 3627 | Sb | 57 | 29.17 | p | 1.94 | -20.52 | 14.66 | 3.20 | 0.24 |
| NGC 3642 | Sbc | 32 | 32.09 | p | 1.92 | -20.64 | 16.82 | 2.34 | 0.13 |
| NGC 3810 | Sc | 48 | 29.80 | p | 1.52 | -19.45 | 18.65 | 1.09 | … |
| NGC 4030 | Sbc | 40 | 31.70 | p | 1.85 | -21.63 | 17.14 | 1.58 | 0.40 |
| NGC 4051 | Sbc | 36 | 30.74 | p | 1.69 | -20.42 | 18.53 | 1.99 | 0.07 |
| NGC 4123 | Sc | 48 | 30.91 | p | 2.00 | -19.50 | 20.39 | 0.85 | … |
| NGC 4152 | Sc | 40 | 32.31 | p | 1.49 | -20.25 | 18.79 | 0.97 | … |
| NGC 4254 | Sc | 32 | 31.59 | p | 1.51 | -22.03 | 18.47 | 0.98 | … |
| NGC 4380 | Sb | 59 | 31.59 | p | 2.15 | -20.42 | 19.73 | 1.06 | 0.06 |
| NGC 4384 | Sa | 42 | 32.60 | p | 1.13 | -19.73 | 19.63 | 0.77 | 0.07 |
| NGC 4500 | Sa | 50 | 33.18 | p | 1.54 | -20.76 | 16.88 | 1.74 | 0.29 |
| NGC 4536 | Sbc | 59 | 32.02 | p | 2.15 | -21.90 | 19.85 | 0.97 | 0.06 |
| NGC 4647 | Sc | 38 | 31.59 | p | 1.70 | -20.83 | 17.12 | 3.15 | … |
| NGC 4900 | Sc | 19 | 30.41 | p | 1.30 | -19.08 | 19.18 | 0.81 | … |
| NGC 5055 | Sbc | 56 | 29.21 | p | 1.90 | -20.80 | 16.71 | 2.28 | 0.26 |
| NGC 5691 | Sa | 42 | 31.97 | p | 1.45 | -19.91 | 17.38 | 2.00 | —(e)(e)These galaxies are not well-fit by a two-component model. |
| NGC 5806 | Sb | 60 | 32.05 | p | 2.14 | -21.04 | 17.62 | 1.99 | 0.17 |
4. Summary and Discussion
We examine galaxies of Hubble types spanning S0-Sc in the global color versus magnitude plane, marking them according to their bulge type. We classify them as having pseudobulges or classical bulges by analyzing the morphology of the bulge using HST imaging.
We show that the type of bulge a galaxy has is a good predictor of where that galaxy will fall in the red-blue and structural galaxy dichotomies. Galaxies with pseudobulges lie in the blue cloud. They have the same global color as galaxies with no bulge at all (pure disk galaxies). On the other hand, galaxies having a classical bulge (and elliptical galaxies) lie on the red sequence. We have further shown that this is not an effect of lower bulge-to-total ratios in pseudobulge galaxies. Additionally, we show that galaxies with pseudobulges have lower global Sérsic index and lower central surface density than galaxies with classical bulges.
Our results imply that the processes involved in the formation of galactic bulges are coupled to the processes that form the entire galaxy. Galactic disks and classical bulges remain the two fundamental structural components of galaxies, yet their relative prominence is not what determines the location of an (intermediate-type) galaxy with respect to the color and structural bimodalities. It is the presence of a classical bulge and the influence this bulge has and its formation had on the galaxy that places the galaxy on the red sequence today. Another way of putting this is to say that increasing the bulge-to-total ratio of an intermediate-type galaxy with a pseudobulge will not automatically move the galaxy to the red sequence, and likewise, a galaxy with a classical bulge is on the red sequence no matter how small that bulge is.
Thus, the location of a galaxy with respect to the bimodality does – at least in part – reflect differing evolutionary paths of the whole galactic system. It is not merely a reflection of different emphasis of the disk and bulge subcomponents.
We wish to reiterate that interpreting the red-blue bimodality as due to the fundamental distinction between disks and classical bulges is not necessarily incorrect. However what is incorrect is to say that the bimodality is merely the linear combination of these two components that determines the location of a galaxy with respect to the bimodality. Also, if one defines the components by photometric decomposition only as has been common practice in the literature, then one is likely to obtain ambiguous results.
As reviewed in Kormendy & Kennicutt (2004) and outlined in Sect. 1, a pseudobulge forms through dynamical processes inside the disk. We also know that the existence of a thin disk signals that the galaxy has not undergone a major merger since the formation of the disk (Toth & Ostriker, 1992). The exact mass ratio in a merger event that is needed to destroy a disk is still under debate (Velazquez & White, 1999; Hayashi & Chiba, 2006), however, it is believed to be of the order of 0.2. All merger events above this mass ratio are believed to result in dynamically hot stellar systems. This leads to the well-known problem of forming late-type disks in cosmological simulations; the disks in these simulations suffer too many mergers and thicken or are destroyed (Steinmetz & Navarro, 2002). The problem of forming these galaxies in cosmological simulations gets much worse when we realize that galaxies with pseudobulges should be included with pure disk galaxies in this sense: they have not suffered a major merger event since the formation of the disk.
The processes that are believed to make pseudobulges require not only a disk to be present, but that disk must be dynamically very cold in order to be unstable to non-axisymmetric instabilities such as bars that are needed to rearrange gas and stars to form a pseudobulge (see Kormendy & Kennicutt, 2004 for a detailed review). Thus, pseudobulges, like thin disks, are signatures of a quiet merger history. Pseudobulge formation timescales have been estimated as Gyr (Kormendy & Kennicutt, 2004; Fisher, 2006) based on current star formation rates. Now consider the time necessary to form a bar and build up a sufficiently high nuclear gas density to form stars. It is quite plausible that these galaxies have remained cold (and thus free of significant mergers) since the formation of their disks.
How can we explain our result that classical-bulge galaxies lie exclusively on the red sequence? Classical bulge galaxies are thought to have undergone violent relaxation, most likely during a major merger in their past, presumably one involving lower-mass galaxies to form a typical bulge of today’s intermediate type Sa-Sbc galaxies. Intermediate mass mergers happen predominantly in the earlier universe, when the halos harboring these objects assemble. Today, the surviving halos of this mass scale are incorporated into bigger structures. For example, the large and small Magellanic Clouds are sub-halos of the Milky Way system. At early times, intermediate-mass mergers frequently occur, and there is still enough gas left to be accreted, so that a disk forms around the newly formed bulge. The result is a disk galaxy that contains a classical bulge.
As the merger rate was much higher at early times in the universe, it is less likely that a pure disk galaxy would have survived this epoch (Steinmetz & Navarro, 2002). Therefore old, red galaxies of Hubble type Sc and later do not commonly exist today. Also, the only way to grow a pseudobulge is to have a relatively long period of disk evolution (of the order of a few Gyr) undisturbed by mergers. This is much more likely to happen in low-density environments at later epochs, possibly . Therefore, it is natural that pseudobulges live in blue, relatively younger galactic systems that are more typical of low-density environments today.
Parenthetically, in high-density environments a few objects may evolve toward the red sequence within Gyr (Blanton, 2006) by gas stripping and quenching of their star formation irrespective of their merger history and resulting bulge type, most likely to become S0s.
The environmental dependence of galaxy colors is well established by studies that link galaxy properties to the environment in which they are found. We first recall the morphology-density relation (Dressler, 1980), namely that early-type (and thus red) galaxies are more clustered than late-type (and thus blue) galaxies. Li et al. (2006) restate this in the modern context, showing that not only color, but also surface density, concentration, and 4000Å break strength all correlate with environmental density in the same way (see also Blanton et al., 2005). Since we find all our (non-S0) pseudobulges in blue-cloud galaxies which are preferentially found in low-density environment, we take this as a reinforcement of the conclusion that pseudobulges indicate galaxies with quiescent merger histories.
Evidence for a quiet merger history of blue galaxies is also given by Blanton (2006). He finds that the number density of blue-sequence galaxies does not change significantly from to . It seems likely that blue sequence is experiencing a quiescent form of evolution over the recent epochs (), and therefore the blue (disk) galaxies have had time to form pseudobulges. We are compelled to point out an important caveat for interpreting any high redshift results on galaxy evolution. Blue galaxies at high redshifts are not likely to be replicas of today’s blue sequence galaxies. It is unfortunate that pseudobulge detection requires such high resolution techniques, otherwise we could test our hypothesis at higher redshifts. The evolution in blue galaxies beyond (Gerke et al., 2006) is possibly due to separate phenomenon from what shapes todays blue galaxies (e.g. the movement of galaxies from the blue sequence to the red). However, the result that the blue sequence appears to be less violent over the past few billion years appears established.
This leads to a picture where a classical bulge is indicative of a halo formation and assembly history of the galaxy that occurred earlier, leading to older stars in the bulge and in the disk, was more violent, and ultimately the system is red today. On the contrary, a pseudobulge, even at the same Hubble type, is indicative of a quiet assembly history that is much more likely at later times and therefore also leads to bluer and younger systems (See Gottlöber et al., 2001 for the dependence of halo merger histories on environment). Thus, the presence of a classical bulge or the presence of a pseudobulge (or no bulge at all) are indicators of different evolutionary histories of the whole galaxy.
Along another line of thought it has suggested that feedback from accreting black holes might be responsible for quenching the star formation history of elliptical galaxies and classical bulges and thereby contribute to the formation of the red sequence (Springel et al., 2005; Scannapieco et al., 2005; De Lucia et al., 2006; Bower et al., 2006, e.g.). We know that some pseudobulges contain supermassive black holes since they contain AGN (for example NGC 1068, NGC 3368, and NGC 4051). Furthermore, there is compelling evidence that these lie on the – relation (Kormendy & Gebhardt, 2001). If this turned out to be true, we need to explain why pseudobulges and their supermassive black holes obey the same – relation as classical bulges and ellipticals do despite their disk-like properties, and at the same time why feedback was not able to quench their star formation in spite of doing just the same in classical bulges of the same size. We do not know of convincing answers to these two questions. The latter might imply that AGN feedback is not important in shaping the star formation history of low-mass systems, or, it might be related to different formation timescales of the mergers that form classical bulges and the secular evolution processes that are thought to lead to pseudobulge formation. In fact, Filippenko & Ho (2003) find an AGN that obeys the in – relation in NGC 4395, a low-mass galaxy that does not contain any bulge, classical or pseudo Greene & Ho, 2006; Greene et al., 2006, see also.
We take our result as clear observational evidence that initial environmental conditions are responsible for many global properties of a galaxy. The merging history of a galaxy is ultimately the driver behind the observed bimodality in the structural, stellar population, and kinematic properties of a galaxy. Bulge types are a signpost of merger history and because of this they predict the position of the whole galaxy with respect to the bimodality in color and structural properties.
References
- Adelman-McCarthy et al. (2006) Adelman-McCarthy, J. K., et al. 2006, ApJS, 162, 38
- Athanassoula (2005) Athanassoula, E. 2005, MNRAS, 358, 1477
- Baldry et al. (2004) Baldry, I. K., Glazebrook, K., Brinkmann, J., Ivezić, Ž., Lupton, R. H., Nichol, R. C., & Szalay, A. S. 2004, ApJ, 600, 681
- Balogh et al. (2004) Balogh, M. L., Baldry, I. K., Nichol, R., Miller, C., Bower, R., & Glazebrook, K. 2004, ApJ, 615, L101
- Bender et al. (1988) Bender, R., Doebereiner, S., & Moellenhoff, C. 1988, A&AS, 74, 385
- Blanton (2006) Blanton, M. R. 2006, ApJ, 648, 268
- Blanton et al. (2005) Blanton, M. R., Eisenstein, D., Hogg, D. W., Schlegel, D. J., & Brinkmann, J. 2005, ApJ, 629, 143
- Blanton et al. (2003) Blanton, M. R., et al. 2003, ApJ, 594, 186
- Bower et al. (2006) Bower, R. G., Benson, A. J., Malbon, R., Helly, J. C., Frenk, C. S., Baugh, C. M., Cole, S., & Lacey, C. G. 2006, MNRAS, 370, 645
- Carollo et al. (1997) Carollo, C. M., Stiavelli, M., de Zeeuw, P. T., & Mack, J. 1997, AJ, 114, 2366
- de Jong (1996) de Jong, R. S. 1996, A&A, 313, 377
- De Lucia et al. (2006) De Lucia, G., Springel, V., White, S. D. M., Croton, D., & Kauffmann, G. 2006, MNRAS, 366, 499
- de Vaucouleurs & de Vaucouleurs (1973) de Vaucouleurs, G., & de Vaucouleurs, A. 1973, MNRAS, 161, 465
- de Vaucouleurs et al. (1991) de Vaucouleurs, G., de Vaucouleurs, A., Corwin, H. G., Jr., Buta, R. J., Paturel, G., & Fouque, P. 1991, Third Reference Catalogue of Bright Galaxies (Volume 1-3, XII, 2069 pp. 7 figs.. Springer-Verlag Berlin Heidelberg New York)
- Dressler (1980) Dressler, A. 1980, ApJ, 236, 351
- Driver et al. (2006) Driver, S. P., et al. 2006, MNRAS, 368, 414
- Erwin (2004) Erwin, P. 2004, A&A, 415, 941
- Fathi & Peletier (2003) Fathi, K., & Peletier, R. F. 2003, A&A, 407, 61
- Filippenko & Ho (2003) Filippenko, A. V., & Ho, L. C. 2003, ApJ, 588, L13
- Fisher (2006) Fisher, D. B. 2006, ApJ, 642, L17
- Freeman (1970) Freeman, K. C. 1970, ApJ, 160, 811
- Gerke et al. (2006) Gerke, B. F., et al. 2006, ArXiv Astrophysics e-prints
- Gottlöber et al. (2001) Gottlöber, S., Klypin, A., & Kravtsov, A. V. 2001, ApJ, 546, 223
- Graham et al. (2005) Graham, A. W., Driver, S. P., Petrosian, V., Conselice, C. J., Bershady, M. A., Crawford, S. M., & Goto, T. 2005, AJ, 130, 1535
- Greene et al. (2006) Greene, J. E., Barth, A. J., & Ho, L. C. 2006, New Astronomy Review, 50, 739
- Greene & Ho (2006) Greene, J. E., & Ho, L. C. 2006, ApJ, 641, L21
- Hayashi & Chiba (2006) Hayashi, H., & Chiba, M. 2006, ArXiv Astrophysics e-prints
- Hubble (1926) Hubble, E. P. 1926, ApJ, 64, 321
- Kannappan et al. (2004) Kannappan, S. J., Jansen, R. A., & Barton, E. J. 2004, AJ, 127, 1371
- Kauffmann et al. (2003a) Kauffmann, G., et al. 2003a, MNRAS, 341, 33
- Kauffmann et al. (2003b) Kauffmann, G., et al. 2003b, MNRAS, 341, 54
- Kent (1985) Kent, S. M. 1985, ApJS, 59, 115
- Kormendy (1993) Kormendy, J. 1993, in IAU Symp. 153: Galactic Bulges, 209
- Kormendy & Bender (1996) Kormendy, J., & Bender, R. 1996, ApJ, 464, L119
- Kormendy et al. (2006) Kormendy, J., Cornell, M. E., Block, D. L., Knapen, J. H., & Allard, E. L. 2006, ApJ, 642, 765
- Kormendy & Fisher (2005) Kormendy, J., & Fisher, D. B. 2005, in Revista Mexicana de Astronomia y Astrofisica Conference Series, ed. S. Torres-Peimbert & G. MacAlpine, 101
- Kormendy & Gebhardt (2001) Kormendy, J., & Gebhardt, K. 2001, in American Institute of Physics Conference Series, Vol. 586, 20th Texas Symposium on relativistic astrophysics, ed. J. C. Wheeler & H. Martel, 363
- Kormendy & Kennicutt (2004) Kormendy, J., & Kennicutt, R. C., Jr. 2004, ARA&A, 42, 603
- Lauer et al. (2005) Lauer, T. R., et al. 2005, AJ, 129, 2138
- Li et al. (2006) Li, C., Kauffmann, G., Jing, Y. P., White, S. D. M., Börner, G., & Cheng, F. Z. 2006, MNRAS, 368, 21
- Liske et al. (2003) Liske, J., Lemon, D. J., Driver, S. P., Cross, N. J. G., & Couch, W. J. 2003, MNRAS, 344, 307
- MacArthur et al. (2004) MacArthur, L. A., Courteau, S., Bell, E., & Holtzman, J. A. 2004, ApJS, 152, 175
- Moore et al. (1996) Moore, B., Katz, N., Lake, G., Dressler, A., & Oemler, A., Jr. 1996, Nature, 379, 613
- Peletier & Balcells (1996) Peletier, R. F., & Balcells, M. 1996, AJ, 111, 2238
- Renzini (1999) Renzini, A. 1999, in The Formation of Galactic Bulges, ed. C. M. Carollo, H. C. Ferguson, & R. F. G. Wyse, 9
- Roberts & Haynes (1994) Roberts, M. S., & Haynes, M. P. 1994, ARA&A, 32, 115
- Sandage (1961) Sandage, A. 1961, The Hubble Atlas of Galaxies. (Carnegie Institution of Washington)
- Sandage & Bedke (1994) Sandage, A., & Bedke, J. 1994, The Carnegie atlas of galaxies (Washington, DC: Carnegie Institution of Washington with The Flintridge Foundation, —c1994)
- Scannapieco et al. (2005) Scannapieco, E., Silk, J., & Bouwens, R. 2005, ApJ, 635, L13
- Shen et al. (2003) Shen, S., Mo, H. J., White, S. D. M., Blanton, M. R., Kauffmann, G., Voges, W., Brinkmann, J., & Csabai, I. 2003, MNRAS, 343, 978
- Simien & de Vaucouleurs (1986) Simien, F., & de Vaucouleurs, G. 1986, ApJ, 302, 564
- Springel et al. (2005) Springel, V., Di Matteo, T., & Hernquist, L. 2005, MNRAS, 361, 776
- Steinmetz & Navarro (2002) Steinmetz, M., & Navarro, J. F. 2002, New Astronomy, 7, 155
- Strateva et al. (2001) Strateva, I., et al. 2001, AJ, 122, 1861
- Toth & Ostriker (1992) Toth, G., & Ostriker, J. P. 1992, ApJ, 389, 5
- van den Bergh (1976) van den Bergh, S. 1976, ApJ, 206, 883
- Velazquez & White (1999) Velazquez, H., & White, S. D. M. 1999, MNRAS, 304, 254
- York et al. (2000) York, D. G., et al. 2000, AJ, 120, 1579