HUDF-JD2: Mid-infrared Evidence for a Luminous Infrared Galaxy
Abstract
The Hubble Ultra Deep Field source JD2 presented in Mobasher et al. (2005) is an unusual galaxy that is very faint at all wavelengths shortward of 1.1m. Photometric redshift fits to data at 0.4 to 8 m yield a significant probability that it is an extremely massive galaxy at . In this paper we present new photometry at 16 m and 22 m from Spitzer Infrared Spectrograph (IRS) peak-up imaging of the Great Observatories Origins Deep Survey (GOODS) fields. We find that the spectral energy distribution shows a factor of 4 rise in flux density between the 16 m and 22 m bandpass which is most likely due to the entrance of polycyclic aromatic hydrocarbon emission features into the 22 m and 24m passbands. The flux ratio between these bandpasses can be best fit by a luminous infrared galaxy with a bolometric luminosity of (26)1011 L☉ corresponding to a star-formation rate of 80 M☉ yr-1. The predicted flux density values at other longer wavelengths are below the detection limits of current instrumentation but such sources could potentially be detected in lensed submillimeter surveys. Re-evaluation of the optical/near-infrared photometry continues to favor photometric redshift solutions, but we argue that the consistency of the multiwavelength parameters of this galaxy with other dusty starbursts favor the mid-infrared photometric redshift. The data presented here provide evidence that optically undetected near-infrared sources which are detected at 24 m are most likely dusty, starburst galaxies at a redshift of with stellar masses 1010 M☉.
1 Introduction
JD2 is an interesting object in the Hubble Ultradeep Field (UDF; Thompson et al., 2005; Beckwith et al., 2006). Its non-detection shortward of the 1.1m bandpass, even in ultradeep Advanced Camera for Surveys (ACS) UDF optical data which are sensitive down to 29 AB mag, has been interpreted as being due to the redshifted Lyman break. In addition, it displays a break in its broad band spectral energy distribution (SED) between 2.2m and 3.6m which has been interpreted as the redshifted Balmer break. Mobasher et al. (2005) argue that it may be a very massive (61011 M☉) galaxy with very little ongoing star-formation at . The large stellar mass of this galaxy derived from fitting population synthesis models to the multiband photometry, and high source density implied by the presence of one such object in the small area subtended by the Near-infrared Camera and Multi-object Spectrograph (NICMOS) UDF, suggest that UV-faint objects, if indeed at such high redshifts, contribute as much to the stellar mass density at as rest-frame ultraviolet-bright Lyman break galaxies. Since the age of the stellar population in JD2 is thought to be 600 Myr, galaxies like JD2 might harbor remnants of the first epoch of star-formation, and play an important role in the reionization of the intergalactic medium (IGM). Such an object, if truly at high redshift, would challenge current models of galaxy formation, which do not predict a large number density of galaxies more massive than 1011 M☉ at (Davé et al., 2006).
The photometric redshift solutions in Mobasher et al. (2005) favor a solution but provide a 15% probability that the source is at , with the most likely alternative solution implying a dusty galaxy at . There are a few inconsistencies in the high-redshift interpretation of JD2. The optical/near-infrared SED is best fit by a template without significant extinction or star-formation. However, the object is detected in the Great Observatories Origins Deep Survey (GOODS) Spitzer Multiband Imaging Photometer and Spectrometer (MIPS) 24m survey with a flux density of 51.44Jy. Since the 24m flux would be dominated by redshifted hot dust and polycyclic aromatic hydrocarbon emission, it indicates the presence of dust within the galaxy. The age-extinction degeneracy is very well known for red galaxies. Most recently, Stern et al. (2006) have shown that the optical/near-infrared photometry of dusty, extremely red objects (EROs) is almost identical to that of evolved, passive EROs, and that only the detection of reprocessed emission at mid- and far-infrared wavelengths can break the degeneracy. Nevertheless, Mobasher et al. (2006) suggest that the 24m emission could be explained by the presence of an obscured active nucleus. While this is possible, at , the Chandra 28 keV band traces 1560 keV emission, energies which are relatively immune to absorption. The detection limit corresponds to LX of 31043 erg s-1 at while the mid-infrared detection implies Lν at rest 3 m of 31045 erg s-1. The 10 m to X-ray luminosity ratios of local Seyfert nuclei are 3 (e.g. Krabbe et al., 2001), and the flat spectrum of Seyferts in , implies that either large (N cm-2) column densities of neutral gas must be obscuring the hard X-ray emission or the active galactic nucleus (AGN) is an unusually low luminosity X-ray source.
In a recent paper, Dunlop et al. (2007) question the optical limits in the , , and passbands adopted by Mobasher et al. (2005) and demonstrate that the values in the redshift fits are skewed in the Mobasher et al. (2005) analysis by adopting optical flux limits which are too stringent. By refitting the source with revised optical limits, they conclude the source to be at rather than at . We also note that JD2 has been visited in work by Yan et al. (2004) and Chen & Marzke (2004) prior to the Mobasher et al. (2005) analysis, and had been classified as a ERO.
In this paper, we present new 16 m and 22m photometry of this source from Spitzer Infrared Spectrograph (IRS) peak-up imaging of the GOODS fields (Teplitz et al., 2006). We fit the photometry at these two wavelengths and the published 24 m data with a variety of dust spectral energy distributions and demonstrate that the mid-infrared photometry is most consistent with a redshift of for JD2. We assess the accuracy of the optical/near-infrared photometry and refit the data with this redshift constraint to determine physical properties of the galaxy. We conclude that it is a luminous infrared galaxy with L L☉ and not a galaxy with a dust obscured AGN. Throughout this paper, we adopt a , , H0=71 km s-1 Mpc-1 cosmology.
2 IRS Peak-Up Imaging of GOODS-S
The 16m and 22m observations were carried out using the peak-up imaging capability of the Infrared Spectrograph (IRS) instrument (Houck et al., 2004) on the Spitzer Space Telescope. The field of view of the peak-up imaging camera is 5480. The central 130 arcmin2 of the GOODS-S field was observed with 60s frame times. Most of the area within the GOODS fields had four dithers per position while the UDF area had 32 dithers per position. Each frame was distortion corrected and background subtracted. The dithered frames were combined using “drizzle” (Fruchter & Hook, 2002). Due to the limited number of dithers per position, point kernel drizzling, which would have minimized the correlated noise in the mosaics was not possible. The final mosaics have a plate scale of 0.9 per pixel. The exposure time in the final mosaics is 4 min pix-1 over most of the GOODS area while the UDF area was observed with 32 min pix-1. JD2, although in the UDF region, seredipitously lies in a part of the coverage map where the exposure time is 68 min, twice that of the nominal UDF. As a result, the statistical uncertainty on its flux is lower than for the average UDF source of the same brightness.
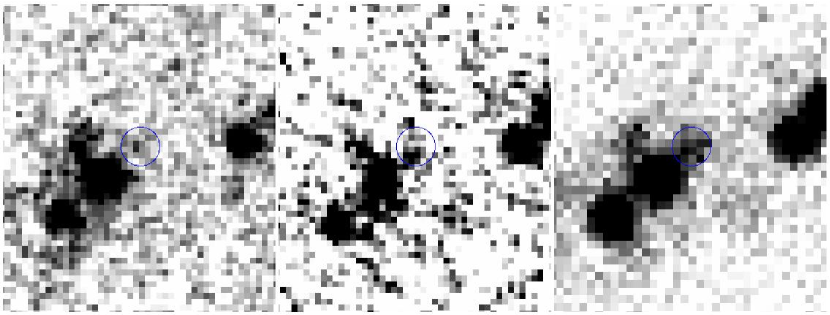
The spatial resolution of at 16m and 22m is 4.1 and 5.2 full width at half maximum (FWHM), respectively. At this resolution, the majority of sources, including JD2, are point sources. This makes it possible to use prior positions from higher resolution data, such as the GOODS 3.68 m imaging (Dickinson et al., 2003, Dickinson et al., in prep.) and apply point-source fitting techniques to measure the flux density of the source. The technique has successfully been used for cataloging 24m sources from the GOODS/MIPS imaging survey. The results are consistent with aperture photometry, with appropriate aperture corrections, for isolated sources and alleviate the contamination to the photometry from the wings of the point spread function for sources which have nearby companions. Postage stamp image cutouts of JD2 are shown in Figure 1.
The 16m and 22m flux densities of the source are 13.53.5 Jy and 5612 Jy respectively. In comparison, the 24 m flux density of the source from the GOODS imaging of the field is 514 Jy. HUDF-JD2 is separated by 7 from a brighter mid-infrared source to the south east which is a spiral galaxy (Stern et al., in prep.). In order to estimate the systematic uncertainty associated with fitting the flux density of a faint source near a bright one, we performed a Monte-Carlo simulation. We identified a relatively isolated source in the mosaic with about the same flux density as the spiral galaxy: this is the galaxy at 3:32:43.49, -27:45:56.45 (J2000) which has a flux density of 12110Jy at 16m. We added an artificial source at a distance between 7 and 8 from this source and extracted the flux density using the positional priors. The process was repeated 100 times each for a range of flux densities straddling the measured flux density of the source. The extracted flux was compared with the input flux density to assess the systematic uncertainty and/or flux bias in the measurement. For a source with a brightness comparable to JD2, the Monte-Carlo analysis yielded 1 uncertainties of 14Jy, 12Jy and 10Jy at 16, 22 and 24 m, respectively. This systematic uncertainty is primarily due to the extended wings of the brighter source and is a factor of 2-3 larger than the statistical uncertainty. We therefore adopt values of 1414Jy at 16m, 5612Jy at 22m and 5110Jy at 24m for JD2.
The sharp increase in flux density between 16m and 22m can either be due to the entrance of polycyclic aromatic hydrocarbons into the 22 and 24 m bandpasses or the 9.7m silicate absorption feature entering the 16m bandpass. A third possibility is the decreasing contribution from hot dust surrounding an AGN because the dust is close to its sublimation temperature. We evaluate each of these possibilities in the following sections.
We note that the IRS is calibrated with respect to a constant Fν source spectrum. Color correction terms to the observed flux are smaller than 1% for the 16m and 22m data for the observed source spectrum and can be neglected. Furthermore, when we estimate fits to the observed photometry, we integrate template spectra over the filter bandpasses (Figure 2).
3 Derived Source Parameters
The optical/near-infrared photometry of JD2 has been discussed in Mobasher et al. (2005) and Dunlop et al. (2007). Spectral energy distribution fits to the photometry, which provide a photometric redshift solution, show a bimodal distribution of minimum values at and . One set of values are favored over the other depending on the choice of optical photometry. Mobasher et al. (2005), with their stringent limits, derive the probability of a source to be 15%. Dunlop et al. (2007) instead adopt marginal detections of the source in the bandpasses which we discuss in Secion 3.2. Any significant detection of the galaxy at optical wavelengths would rule out a photometric redshift solution which favors . Dunlop et al. (2007) find a minimum in the distribution at .
The detection of HUDF-JD2 in the deep GOODS 24m images did not break the degeneracy. Mobasher et al. (2005) suggests the hot dust emission is from an obscured AGN in the galaxy. Alternately, the 24 m emission could be dominated from polycyclic aromatic hydrocarbon (PAH) features which would be present if the object is an extremely red, dusty starburst galaxy at (Yan et al., 2004; Stern et al., 2006). Inclusion of the 16 and 22 m data allows us to measure a photometric redshift from the mid-infrared which could potentially break this degeneracy, independent of the optical/near-infrared SED fits. Although fitting optical to mid-infrared simultaneously is more elegant, it is virtually impossible since there is virtually no correlation between optical/near-infrared SEDs and mid-infrared SEDs of galaxies.
3.1 Mid-Infrared Photometric Redshifts
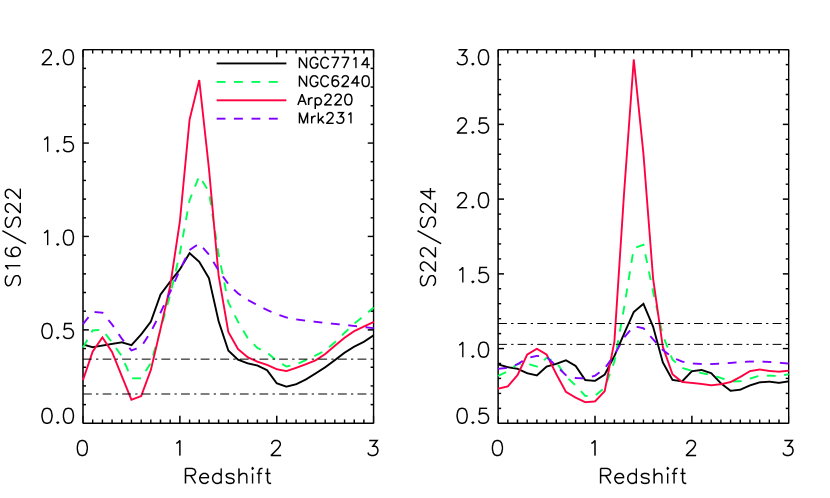
The mid-infrared SED of a star-forming galaxy is a complicated interplay of warm dust continuum, PAH emission and silicate absorption features. The ratio of flux densities in the three abutting Spitzer passbands at 16, 22 and 24 m allow redshifts of objects to be constrained as these dust features move through these filters. PAH are only 0.5-1m wide, while the 9.7m silicate feature is 34m wide, depending on the continuum level adopted. As a result, adjacent passbands can show widely different flux density ratios as a function of redshift (Figure 3).
At , the 9.7 m silicate feature enters the 16m bandpass while the 22 and 24 m bandpasses are tracing the warm dust and 11 and 12 m PAH features. At these redshifts, sources show low 16 m/22 m flux density ratios. At , the 9.7m features moves out of the 16 m bandpass and into the 22 m bandpass, while the 6.2 m and 7.7 m PAH features fall in the 16 m window, boosting the 16 m/22 m ratio. At , the 9.7 m feature moves into the 24 m band. Since the 22 m bandpass is 2 m wider than the MIPS 24 m band, the 7.7 m feature enters the 22 m bandpass. The net effect is to boost the 22 m/24 m flux ratio while lowering the 16 m/22 m ratio. At , the PAH emission shifts out of the 16 m band, decreasing the 16 m/22 m ratio while the 22 m/24 m flux ratio varies as the 6.2 and 7.7 m PAH features move within the passbands. This variation in flux ratios is illustrated in Figure 3 for four different SED types derived from spectral observations of galaxies in the local Universe (Armus et al., 2007; Brandl et al., 2004).
While it is true that variation of PAH line ratios or strength of silicate absorption can cause broadband fluxes to vary significantly, the combination of photometric redshifts from the optical/near-infrared and mid-infrared photometric redshifts using these three bandpasses can help break redshift degeneracies.
The flux density ratios observed for HUDF-JD2 are a 16 m/22 m ratio of 0.25 and a 22 m/24 m ratio of 1.1. This indicates that the galaxy must either be at if it has very strong silicate absorption or at if it is a typical starburst galaxy with strong PAH emission.
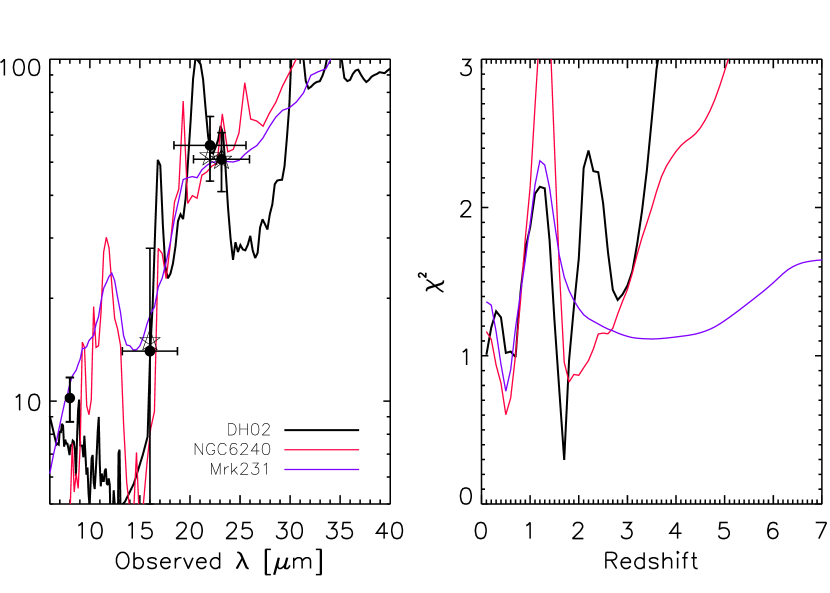
In Figure 4 and Table 1, we illustrate the quality of fits to the photometry at 16, 22 and 24m from different mid-infrared template spectral energy distributions. We consider starbursts, AGN and composite sources which span the range of strong PAH, weak PAH and strong silicate absorption (Chary & Elbaz, 2001; Forster-Schreiber et al., 2001; Le Floc’h et al., 2001; Dale & Helou, 2002; Brandl et al., 2004; Armus et al., 2007). We also consider the non-detection of JD2 in deep 70 m observations of the GOODS fields which achieve 5 flux density limits of 2 mJy (Frayer et al., 2006). The best fit to the 16m, 22 m and 24 m photometry is from a starburst source with strong PAH emission at . The increase in the 22m and 24m flux relative to 16m is due to the entrance of the 7.7m PAH complex into the 22m and 24m bandpasses. The flux in the 16m bandpass is lower since the 6.2m PAH feature is much weaker.
Extrapolating the templates that are fit to the mid-infrared photometry also yields an estimate of the far-infrared luminosity for the galaxy. The LIR=L(81000 m) luminosity of the source is 51011 L☉, which corresponds to a star-formation rate of 80 M☉ yr-1. We compare this with optical/UV estimates of star-formation in the following section. Using the radio-FIR correlation in Yun et al. (2001), we predict the 1.4 GHz to be 12Jy and the 8.4 GHz flux density to be 3.7Jy while the predicted fluxes at 70 m and 850 m are shown in Table 1. The deepest 70 m and 850 m surveys are currently sensitive to 1.52 mJy. The predicted intensities of JD2 are below these limits implying that confirmation of the derived far-infrared luminosity will have to await deeper observations by Herschel and ALMA.
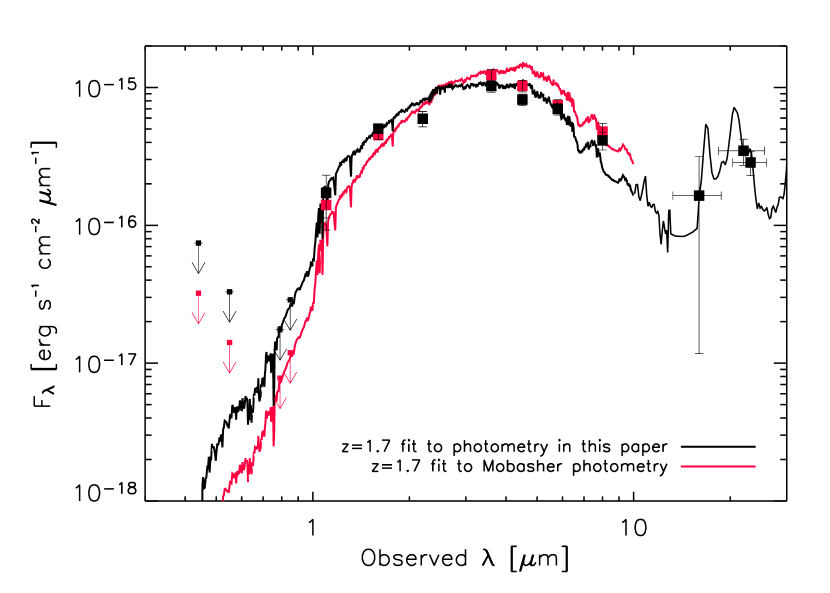
values are also reduced for an obscured AGN template at which has the observed 16 m flux density suppressed relative to the flux density at 22 m and 24 m due to the entrance of the 9.7 m silicate absorption feature. An obscured AGN template like Mrk231 can also fit the 8 m flux density of the source as shown in Figure 4 while the starburst template fits at require the optical/near-infrared flux to be dominated by starlight (Figure 6). The non-detection of any spectral lines in the optical/near-infrared spectroscopic data presented by Mobasher et al. (2005), as well as the difficulty in accounting for the non-detection of the source at optical wavelengths (Section 3.3) makes the hypothesis unlikely. On the other hand, lies within the so-called redshift “desert”, where the [OII] 3727 doublet, [OIII] 5007 line and H+[NII] lines are all severely affected by atmospheric transmission and strong OH sky lines. Furthermore, as we discuss in Section 3.3, at , the red SED of the source between 2.2m and IRAC 38 m could be due to the broad 1.6 m bump in the stellar SED being in the IRAC passbands.
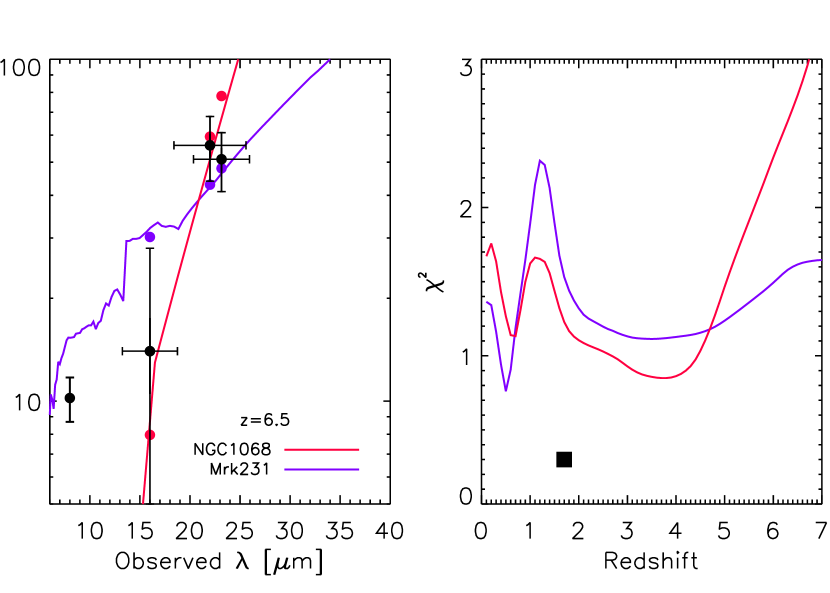
We now consider the implications of the IRS detections to the high redshift advocated in Mobasher et al. (2005). If we adopt the hypothesis that JD2 is at and the 24 m emission is dominated by AGN light, we must first subtract the stellar contribution to the mid-infrared flux densities. We find that for the SED fit by Mobasher et al. (2005), the contribution of stellar photospheric emission to the flux densities at 16, 22 and 24 m are 10.7, 6.5 and 6.0 Jy respectively. We then attempt to fit the starlight-subtracted mid-infrared photometry with the two mid-infrared AGN templates presented in Mobasher et al. (2005). The values are significantly worse than the best fits at (Table 1 and Figure 5). The Mrk231 template, fairly typical of an obscured AGN, is bluer in its 16 m/22 m flux ratios at than what the observations indicate. NGC1068, which is a Compton-thick AGN with decreasing hot dust continuum at shorter wavelengths due to dust sublimation, would best fit the observed mid-infrared photometry at . The hot dust emission falls off too rapidly for it to account for the 22 m flux density with respect to the 24 m flux density if it were at . One could imagine that varying the AGN template could allow for the mid-infrared photometry here to be fit but given that the fit using typical mid-infrared templates agrees with the parameters derived from the optical/near-infrared fits, we find the interpretation for JD2 substantially weakened.
3.2 The Optical/Near-infrared Photometry
Given the derived redshift based on the mid-infrared photometry of the source, we critically investigate the optical/near-infrared photometry to assess potential sources of error.
The ACS photometric measurements are very important to the interpretation of JD2, since a significant optical detection would almost certainly rule out the hypothesis. We note that Mobasher et al. (2005) erroneously reported that their ACS photometry was measured in an diameter aperture, when in fact a smaller, diameter aperture was used (M. Dickinson, private communication). A larger aperture size would lead to more conservative photometric limits, and is probably to be recommended, given the size of the galaxy as measured from the NICMOS -band images (measured half-light radius , uncorrected for PSF effects, see Mobasher et al.). However, a larger aperture risks including light from three faint, neighboring galaxies located about 1″ away from JD2. We have masked out regions with diameter around those three galaxies111In another typographical error, Mobasher et al. (2005) reported masking regions in diameter around the neighboring galaxies. In fact, the masking diameter was , which we also adopt here. before measuring photometry for JD2 in a diameter circular aperture.
The ACS images were drizzled using a point kernel (see Beckwith et al., 2006) which should lead to noise that is uncorrelated between adjacent pixels. We verified that this is the case by measuring the autocorrelation function of the noise after masking galaxies. We measured the noise on various scales, including 50 pixel apertures as used by Beckwith et al. (2006). Our most conservative (largest) noise measurements are 31 to 37% smaller than those reported by Beckwith et al. (2006, their Table 5).
Dunlop et al. (2007) report faint detections of positive flux in the ACS , and -bands, which, taken together, drive their photometric redshift estimate to favor a lower value, . We do not reproduce these measurements; using a diameter aperture and our noise measurements, and the correction of 0.1 mag for the energy falling outside the aperture reported in Sirianni et al. (2005, Table 3), we find the photometric limits given in Table 2. These are 0.8 mag brighter than the limits reported in Mobasher et al. (2005), mainly due to the larger aperture adopted here. It is possible that the positive flux detected in the Dunlop et al. measurements arises in part from the faint neighboring galaxies.
The NICMOS photometry and photometry in Mobasher et al. (2005) are very similar to those in the UDF catalog of Thompson et al. (2005). As a result, we have not remeasured these values. However, we note that the photometric values in Mobasher et al. (2005) do not include the NICMOS count rate dependent non-linearity correction discussed in de Jong et al. (2006). The effect of this non-linearity correction is to make the photometry brighter by 0.22 mag in the band and 0.12 mag in the band as shown in Table 2.
We also remeasured the photometry of the source at IRAC wavelengths. We used SExtractor catalogs and measured the photometry in 3 diameter beams, similar to Mobasher et al. (2005). To derive aperture corrections and systematic uncertainties, we adopt a different approach. The primary systematic uncertainty in this measurement is the uncertain sky level due to the bright galaxy 7 to the South-East. We input an artificial point source whose brightness is that of JD2 into the final mosaic. The centroid of the source with respect to the bright galaxy is kept similar to that of JD2, i.e the artificial source has a centroid which is between 7 and 8 from the galaxy. The SExtractor routine was run on this fake image and the photometry of the fake source measured. We find a systematic uncertainty whereby the extracted flux of the fake source in the catalog was brighter at 3.6 and 4.5 m but fainter at 5.8 and 8.0 m. The process was repeated a 100 times to measure the average systematic and statistical error using the corresponding point spread function at each of the four IRAC wavelengths. We revise the aperture corrected magnitudes for JD2 to 22.24, 22.00, 21.63 and 21.51 AB mag at 3.6, 4.5, 5.8 and 8.0 m respectively. There is, however, a correction to be applied to these magnitudes.
There are three faint galaxies within 1 of JD2. Two of these are rather faint and blue while the brightest of the three falls within the IRAC 3 beam. These galaxies are detected at all wavelength between the and band. To estimate the contribution of these sources to the photometry within the IRAC beam, we fit Bruzual & Charlot (2003) templates to the multiband photometry of these sources, leaving redshift as a free parameter. We use the best fit SEDs to estimate the redshift and corresponding flux densities at the IRAC wavelengths. We find the brightest of these three sources, located at 3:32:38.76,-27:48:28.91 (J2000), to be at redshift 3.4 with magnitudes of 25.95, 25.83, 25.82 and 25.80 at 3.6, 4.5, 5.8 and 8.0 m respectively. The second source, located at 3:32:38.81,-27:48:39.79, is at with a contribution that is about 0.6 mag fainter at each of the four passbands. We subtracted the contribution of both these sources from the photometry of JD2.
To summarize, the corrected limits for JD2 in the ACS bands are about 0.8 mag brighter due to the larger aperture, the photometry in the NICMOS and bands is brighter by % due to the non-linearity correction and the photometry in the IRAC bands is about 10% fainter on average than those adopted in Mobasher et al. (2005). The net effect is to reduce the amplitude of the apparent near-infrared to IRAC “break” slightly. The optical/near-infrared photometry of JD2 after these corrections have been applied is shown in Table 2 and which we fit for in Section 3.3. For the sake of completeness, we also investigate redshift constrained fits to the Dunlop et al. (2007) and Mobasher et al. (2005) optical/near-infrared photometry.
In addition, we attempted to fit elliptical isophotes to the galaxy to the SE and subtracted it out from the image. This process left significant residuals due to the asymmetric nature of the Spitzer/IRAC point spread function. The aperture corrected point source photometry we measure for JD2 in images with the galaxy subtracted is 22.36, 21.95, 21.72 and 21.64 AB mag. The difference between these values and those quoted in Table 2 can be attributed almost entirely to the difficulty in measuring the absolute sky background. Thus, we provide photometric uncertainties of 0.15 mag for all 4 bands.
3.3 Revisiting the Optical/Near-Infrared Photometric Fits
We first evaluate the quality of the fits to the optical/near-infrared photometry at using the Bruzual & Charlot (2003) population synthesis models. The range of parameter space for the models was solar and 0.2 solar metallicity, 19 e-folding timescales () for the starburst from an instantaneous starburst to constant star-formation, ages () from 0.1 Myr to the age of the Universe at the chosen redshift and extinction (AV) between 0 and 10 mags. At , the 8 m flux density is affected by dust emission and is ignored in the fits.
If JD2 is a starburst like NGC6240 but with silicate absorption which suppresses the observed 16 m flux density, the weakness/non-detection of the source in the passbands requires AV=9.9 mag of visual extinction irrespective of whether we adopt the Dunlop et al. (2007) or Mobasher et al. (2005) photometry. This is not impossible but unusually large. It would imply a young 8 Myr old starburst with a mass of 2109 M☉ and a true star-formation rate, as derived from extinction correction of the ultraviolet flux, of 100 M☉ yr-1, all of which is dust obscured. The fits to the mid-infrared photometry at imply a much lower dust-obscured star-formation rate of 5 M☉ yr-1. Although it is possible for optically thick star-formation, such as that found in local ULIRGs, to result in the mid- and far-infrared luminosity of galaxies exceeding their extinction corrected ultraviolet luminosity, the converse is rarely true. This weakens the possibility of a starburst.
If the source is a obscured AGN like Mrk231, then the contribution of the hot dust around the AGN to the near-infrared photometry needs to be subtracted before fitting. For the Mrk231 template, we find this to be 0.8, 1.2, 1.4, 2.6, 3.5, 5.6 and 10.5Jy at 1.2, 1.6, 2.2, 3.6, 4.5, 5.8 and 8.0m respectively. The photometry at 1.1 and 1.6 m of the source is a factor of below the expected values again indicating that a Mrk231 type source, while consistent with the mid-infrared photometry, cannot fit the entire SED.
Thus, a dusty star-forming galaxy SED is most consistent with all the photometry. We adopt this redshift and re-fit the optical/near-infrared data using the BC03 models. Results are shown in Table 3. HUDF-JD2 is best fit with a solar metallicity template from the BC03 library with A mag of visual extinction using a Calzetti (2001) dust extinction law. We caution that the metallicity is not strongly constrained. The best-fit model is a post-starburst BC03 SED with Myr, =30 Myr and a stellar mass of 61010 M☉. This is similar to the fits presented in Mobasher et al. (2005). The result is not surprising since post-starburst galaxies could have significant dust content from dust produced in supernovae and AGB stars. In fact, it has been observationally shown that the host galaxies of core-collapse and Type Ia supernovae are dustier than field galaxies with the same observed optical brightness (Chary et al., 2005). We caution however, that the post-starburst hypothesis, motivated by the large value of , would be weakened if most of the star-formation takes place in optically thick regions of the galaxy.
From the SED fits, we estimate that the star-formation rate, as measured by the 1500Å flux escaping the galaxy, is very small (210-4 M☉ yr-1). Application of an extinction correction to the UV luminosity results in a star-formation rate of 1 M☉ yr-1. In contrast, its true star-formation rate as derived from the mid-infrared fits is 80-90 M☉ yr-1. The fact that JD2 is a compact near-infrared source with a scale length of 0.3, combined with the large ratio of infrared to ultraviolet star-formation rate estimates, strongly suggests that JD2 is being powered by a compact, optically-thick starburst in its nucleus.
There is a caveat. If we use the Bruzual & Charlot (2003) models to solve for an independent redshift from the optical/near-infrared photometry presented in this paper, we continue to get a high redshift minimum at which has a reduced of 1.05 compared to the reduced values of 1.9 and 2.4 at and respectively. Thus, optical/near-infrared photometric redshifts continue to favor the high redshift hypothesis, while mid-infrared photometric redshifts favor the lower redshift hypothesis. We favor the mid-infrared photometric redshifts derived here since optical photometric redshifts for dusty galaxies have been shown to have a large scatter based on a comparison between spectroscopic and photometric redshifts for 24 m detected sources in GOODS-N (Chary, 2006).
A comparison of the properties of HUDF-JD2 with the massive, red galaxy population at is illustrative. Papovich et al. (2006) show that the star-formation rate of galaxies scale with the stellar mass at these redshifts and that the specific star-formation rate of a dusty starburst with mass of 61010 M☉ is about Gyr-1. UDF-JD2, for , has a specific star-formation rate of 1.6 Gyr-1 which is consistent with the massive, dusty starbursts at these redshifts. The optical extinction derived for this galaxy is rather large, corresponding to =1.2. Spectroscopically confirmed galaxies at these redshifts which are 24m detected have values derived from their ultraviolet slopes of 0.3. This is most likely a bias since spectroscopic confirmation requires the detection of optical/ultraviolet lines which are preferentially detected in galaxies that are relatively transparent and have low extinction values. A better comparison is with the derived extinction values for local dusty starbursts presented in Hopkins et al. (2001). The average to the stellar continuum for that sample at an infrared luminosity of 51011 L☉ is about 0.25. Thus, HUDF-JD2 does not appear to be dissimilar from dusty, luminous infrared galaxies (LIRGs) at . However, its derived appears to be a factor of 4 higher than other LIRG samples, consistent with its significant detection at mid-infrared wavelengths and compact morphology in the NICMOS 1.6 m image which suggests a compact, nuclear starburst similar to many local infrared luminous galaxies.
JD2 is about 1.4 mags redder in observed [3.6] colors and about 3 mags fainter at 3.6 m than HR10, a spectroscopically confirmed dusty starburst (Stern et al., 2006). The predicted H line flux for this galaxy, including the extinction in the line, is 10-18 erg s-1 cm-2. This is a factor of 3 below the sensitivity of the existing observations in Mobasher et al. (2005) but should be detectable with a space-based near-infrared spectrograph.
4 Conclusions
We present new 16 and 22 m mid-infrared photometry of the HUDF source JD2 which had tentatively been classified as a massive galaxy. The mid-infrared spectral energy distribution shows a sharp increase in flux density between 16 m and 22 m, most consistent with the 7.7 m PAH feature entering the 22 m bandpass. Our analysis concludes that the galaxy is a starbursting, luminous infrared galaxy (LIRG) at a redshift of . The non-detection of the source in the UDF data is due to the presence of mag of dust internal to the galaxy. We have re-evaluated the optical/near-infrared photometry of this source and find the stringent limits in Mobasher et al. (2005) are more consistent with the data rather than the marginal detection reported in Dunlop et al. (2007). Photometric redshift fits to the optical/near-infrared data alone continue to favor a solution. However, the unusually high LMIR/LX for JD2 compared to other obscured AGN, the large scatter in optical photometric redshift solutions for dusty galaxies and the similarity between the multiwavelength properties of this galaxy and other dusty starbursts in the range lead us to favor the mid-infrared photometric redshift solution. The non-detection of a LIRG in the deepest optical data taken to date strongly cautions against interpreting near-infrared dropout sources in shallower surveys as galaxies.
References
- Armus et al. (2007) Armus, L., et al., 2007, ApJ, in press, astro-ph/0610218
- Beckwith et al. (2006) Beckwith, S. V. W., et al., 2006, AJ, 132, 1729
- Brandl et al. (2004) Brandl, B., et al., 2004, ApJS, 154, 188
- Bruzual & Charlot (2003) Bruzual, G., & Charlot, S., 2003, MNRAS, 344, 1000
- Calzetti (2001) Calzetti, D., 2001, PASP, 113, 1449
- Chary (2006) Chary, R., 2006, Proceedings of “At the Edge of the Universe”, astro-ph/0612736
- Chary et al. (2005) Chary, R., et al., 2005, ApJ, 635, 1022
- Chary & Elbaz (2001) Chary, R., & Elbaz, D., 2001, ApJ, 556, 562
- Chen & Marzke (2004) Chen, H.-W., & Marzke, R. O., 2004, ApJ, 615, 603
- Dale & Helou (2002) Dale, D., & Helou, G., 2002, ApJ, 576, 159
- Davé et al. (2006) Davé, R., Finlator, K., & Oppenheimer, B. D., 2006, MNRAS, 370, 273
- de Jong et al. (2006) de Jong, R., et al., 2006, Proceedings of The 2005 HST Calibration Workshop, eds. A. Koekemoer, P. Goudfrooij, L. Dressel, 121
- Dickinson et al. (2003) Dickinson, M., et al., 2003, Proceedings of the Mass of Galaxies at Low and High Redshift, 324, Springer-Verlag
- Dunlop et al. (2007) Dunlop, J., Cirasuolo, M., & McLure, R. J., 2007, MNRAS, submitted, astro-ph/0606192
- Forster-Schreiber et al. (2001) Forster-Schreiber, N. M., et al., ApJ, 552, 544
- Frayer et al. (2006) Frayer, D., et al., 2006, ApJ, 647, L9
- Fruchter & Hook (2002) Fruchter, A. S., & Hook, R. N., 2002, PASP, 114, 144
- Hopkins et al. (2001) Hopkins, A. M., et al., 2001, AJ, 122, 288
- Houck et al. (2004) Houck, J., et al., 2004, ApJS, 154, 18
- Krabbe et al. (2001) Krabbe, A., Boeker, T., & Maiolino, R., 2001, ApJ, 557, 626
- Le Floc’h et al. (2001) Le Floc’h, E., et al., 2001, A&A, 367, 487
- Mobasher et al. (2005) Mobasher, B., et al., 2005, ApJ, 635, 832
- Papovich et al. (2006) Papovich, C., et al., 2006, ApJ, 640, 92
- Sirianni et al. (2005) Sirianni, M., et al., 2005, PASP, 117, 1049
- Stern et al. (2006) Stern, D., Chary, R., Eisenhardt, P., & Moustakas, L., 2006, AJ, 132, 1405
- Thompson et al. (2005) Thompson, R. I., et al., 2005, AJ, 130, 1
- Teplitz et al. (2006) Teplitz, H. I., et al., 2006, BAAS, 2091, 3203
- Yan et al. (2004) Yan, H., et al., 2004, ApJ, 616, 63
- Yun et al. (2001) Yun, M. S., Reddy, N. A., & Condon, J., 2001, ApJ, 554, 803
‘

| Template Adopted | Best fit redshift | LIRaaFor the star-forming templates, the star-formation rate is 1.7110LIR. | Predicted Fluxes | Type of ObjectbbFor the AGN templates at , the stellar photospheric emission has been subtracted from the mid-infrared photometry. To identify the best-fit mid-infrared redshift for the AGN templates the actual mid-infrared photometry was used. | Notes | |
|---|---|---|---|---|---|---|
| L☉ | (70, 850m in mJy) | |||||
| Dale & Helou | 1.7 | 4.71011 | 0.30 | 0.6, 0.5 | … | |
| Chary & Elbaz | 1.6 | 5.61011 | 0.37 | 0.9, 0.4 | … | |
| NGC7714 | 1.6 | 2.51011 | 0.42 | 0.4, 0.2 | Starburst | |
| M82 | 1.7 | 1.61011 | 0.48 | 0.2, 0.09 | Starburst | |
| NGC6240 | 0.5 | 1.51010 | 0.60 | 1.0, 0.02 | Compton thick AGN+SB | large AV |
| inconsistent UV/IR SFR | ||||||
| Mrk231 | 0.5 | 6.9109 | 0.76 | 0.4, 0.004 | Obscured AGN | exceed NIR flux |
| Arp220 | 1.8 | 2.11012 | 0.95 | 1.7, 1.5 | Starburst | |
| NGC1068-nucleus | 3.7 | 1.41012 | 1.02 | 0.3, 1.0 | Obscured AGN | Worse |
| Mrk231 | 6.5 | 7.41012 | 2.0 | 0.2, 2.4 | Obscured AGN | Worse |
| NGC1068-nucleus | 6.5 | 1.31013 | 1.1 | 0.6, 7.1 | Obscured AGN | Worse |
| Wavelength | Photometry (AB mag)aaPhotometric limits, where provided, are 2. See text for details. |
|---|---|
| B | 29.7 |
| V | 30.1 |
| i | 30.0 |
| z | 29.3 |
| 26.80.3 | |
| 24.820.07 | |
| 23.950.132 | |
| 3.6 m | 22.290.15 |
| 4.5 m | 22.050.15 |
| 5.8 m | 21.670.15 |
| 8.0 m | 21.540.15 |
| 16 m | 21.04 |
| 22 m | 19.530.21 |
| 24 m | 19.630.21 |
| Mass | AV | Age | UV SFR | Corrected SFR | aa4 degrees of freedom with 7 data points and 3 parameters (Age, Extinction and ) for the Mobasher et al. (2005) photometry. The Dunlop et al. (2007) photometry has 10 data points. | Notes | |
|---|---|---|---|---|---|---|---|
| M☉ | mag | Myr | Myr | M☉ yr-1 | M☉ yr-1 | ||
| 6.31010 | 3.6 | 570 | 30 | 1.710-4 | 0.74 | 2.4 | Photometry from Table 2, Solar metallicity BC03 |
| 9.81010 | 4.7 | 400 | 0 | 810-5 | 5 | 3.9 | Mobasher et al. photometry, Solar metallicity BC03 |
| 1.31011 | 4.6 | 1020 | 30 | 410-5 | 1.8 | 4.0 | Mobasher et al. photometry, 0.2 solar metallicity BC03 |
| 4.61010 | 4.3 | 453 | 700 | 0.003 | 93 | 1.6 | Dunlop et al. photometry, Solar metallicity BC03 |
| 1.91010 | 4.7 | 47.5 | 50 | 0.005 | 308 | 1.6 | Dunlop et al. photometry, 0.2 solar metallicity BC03 |