Structure and magnetism of self-organized Ge1-xMnx nano-columns
Abstract
We report on the structural and magnetic properties of thin Ge1-xMnx films grown by molecular beam epitaxy (MBE) on Ge(001) substrates at temperatures () ranging from C to 200∘C, with average Mn contents between 1 % and 11 %. Their crystalline structure, morphology and composition have been investigated by transmission electron microscopy (TEM), electron energy loss spectroscopy and x-ray diffraction. In the whole range of growth temperatures and Mn concentrations, we observed the formation of manganese rich nanostructures embedded in a nearly pure germanium matrix. Growth temperature mostly determines the structural properties of Mn-rich nanostructures. For low growth temperatures (below 120∘C), we evidenced a two-dimensional spinodal decomposition resulting in the formation of vertical one-dimensional nanostructures (nanocolumns). Moreover we show in this paper the influence of growth parameters ( and Mn content) on this decomposition i.e. on nanocolumns size and density. For temperatures higher than C, we observed the formation of Ge3Mn5 clusters. For intermediate growth temperatures nanocolumns and nanoclusters coexist. Combining high resolution TEM and superconducting quantum interference device magnetometry, we could evidence at least four different magnetic phases in Ge1-xMnx films: paramagnetic diluted Mn atoms in the germanium matrix, superparamagnetic and ferromagnetic low- nanocolumns (120 K 170 K), high- nanocolumns ( 400 K) and Ge3Mn5 clusters.
pacs:
75.50.Pp, 75.75.+a, 61.46.-wI introduction
In the past few years, the synthesis of ferromagnetic semiconductors has become a major challenge for spintronics. Actually, growing a magnetic and semiconducting material could lead to promising advances like spin injection into non magnetic semiconductors, or electrical manipulation of carrier induced magnetism in magnetic semiconductors Ohno et al. (2000); Boukari et al. (2002). Up to now, major efforts have focused on diluted magnetic semiconductors (DMS) in which the host semiconducting matrix is randomly substituted by transition metal (TM) ions such as Mn, Cr, Ni, Fe or Co Dietl (2002). However Curie temperatures () in DMS remain rather low and TM concentrations must be drastically raised in order to increase up to room temperature. That usually leads to phase separation and the formation of secondary phases. It was recently shown that phase separation induced by spinodal decomposition could lead to a significant increase of Dietl (2006); Fukushima et al. (2006). For semiconductors showing higher than room temperature one can foresee the fabrication of nanodevices such as memory nanodots, or nanochannels for spin injection. Therefore, the precise control of inhomogeneities appears as a new challenge which may open a way to industrial applications of ferromagnetism in semiconductors.
The increasing interest in group-IV magnetic semiconductors can also be explained by their potential compatibility with the existing silicon technology. In 2002, carrier mediated ferromagnetism was reported in MBE grown Ge0.94Mn0.06 films by Park et al. Park et al. (2002). The maximum critical temperature was 116 K. Recently many publications indicate a significant increase of in Ge1-xMnx material depending on growth conditions Pinto et al. (2005); Li et al. (2005); Tsui et al. (2003). Cho et al. reported a Curie temperature as high as 285 K Cho et al. (2002).
Taking into account the strong tendency of Mn ions to form intermetallic compounds in germanium, a detailed investigation of the nanoscale structure is required. Up to now, only a few studies have focused on the nanoscale composition in Ge1-xMnx films. Local chemical inhomogeneities have been recently reported by Kang et al. Kang et al. (2005) who evidenced a micrometer scale segregation of manganese in large Mn rich stripes. Ge3Mn5 as well as Ge8Mn11 clusters embedded in a germanium matrix have been reported by many authors. However, Curie temperatures never exceed 300 K Bihler et al. (2006); Morresi et al. (2006); Passacantando et al. (2006); Ahlers et al. (2006). Ge3Mn5 clusters exhibit a Curie temperature of 296 K Massalski (1990). This phase frequently observed in Ge1-xMnx films is the most stable (Ge,Mn) alloy. The other stable compound Ge8Mn11 has also been observed in nanocrystallites surrounded with pure germanium Park et al. (2001). Ge8Mn11 and Ge3Mn5 phases are ferromagnetic but their metallic character considerably complicates their potential use as spin injectors.
Recently, some new Mn-rich nanostructures have been evidenced in Ge1-xMnx layers. Sugahara et al. Sugahara et al. (2005) reported the formation of high Mn content (between 10 % and 20 % of Mn) amorphous Ge1-xMnx precipitates in a Mn-free germanium matrix. Mn-rich coherent cubic clusters were observed by Ahlers et al. Ahlers et al. (2006) which exhibit a Curie temperatures below 200 K. Finally, high- ( 400 K) Mn-rich nanocolumns have been evidenced Jamet et al. (2006) which could lead to silicon compatible room temperature operational devices.
In the present paper, we investigate the structural and magnetic properties of Ge1-xMnx thin films for low growth temperatures ( 200∘C) and low Mn concentrations (between 1 % and 11 %). By combining TEM, x-Ray diffraction and SQUID magnetometry, we could identify different magnetic phases. We show that depending on growth conditions, we obtain either Mn-rich nanocolumns or Ge3Mn5 clusters embedded in a germanium matrix. We discuss the structural and magnetic properties of these nanostructures as a function of manganese concentration and growth temperature. We also discuss the magnetic anisotropy of nanocolumns and
Ge3Mn5 clusters.
II Sample growth
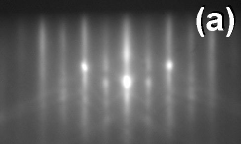
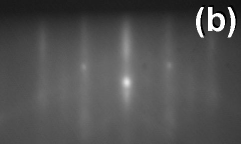
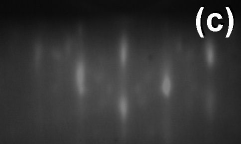
Growth was performed using solid sources molecular beam epitaxy (MBE) by co-depositing Ge and Mn evaporated from standard Knudsen effusion cells. Deposition rate was low ( 0.2 Å.s-1). Germanium substrates were epi-ready Ge(001) wafers with a residual n-type doping and resistivity of 1015 cm-3 and 5 respectively. After thermal desorption of the surface oxide, a 40 nm thick Ge buffer layer was grown at 250∘C, resulting in a 2 1 surface reconstruction as observed by reflection high energy electron diffraction (RHEED) (see Fig. 1a). Next, 80 nm thick Ge1-xMnx films were subsequently grown at low substrate temperature (from 80∘C to 200∘C). Mn content has been determined by x-ray fluorescence measurements performed on thick samples ( 1 thick) and complementary Rutherford Back Scattering (RBS) on thin Ge1-xMnx films grown on silicon. Mn concentrations range from 1 % to 11% Mn.
For Ge1-xMnx films grown at substrate temperatures below 180∘C, after the first monolayer (ML) deposition, the 2 1 surface reconstruction almost totally disappears. After depositing few MLs, a slightly diffuse 1 1 streaky RHEED pattern and a very weak 2 1 reconstruction (Fig. 1b) indicate a predominantly two-dimensional growth. For growth temperatures above 180∘C additional spots appear in the RHEED pattern during the Ge1-xMnx growth (Fig. 1c). These spots may correspond to the formation of very small secondary phase crystallites. The nature of these crystallites will be discussed below.
Transmission electron microscopy (TEM) observations were performed using a JEOL 4000EX microscope with an acceleration voltage of 400 kV. Energy filtered transmission electron microscopy (EFTEM) was done using a JEOL 3010 microscope equipped with a Gatan Image Filter . Sample preparation was carried out by standard mechanical polishing and argon ion milling for cross-section investigations and plane views were prepared by wet etching with H3PO4-H2O2 solution Kagawa et al. (1982).
III Structural properties
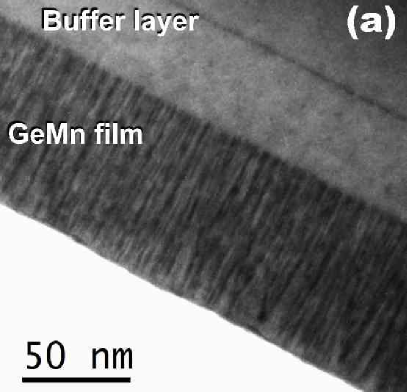
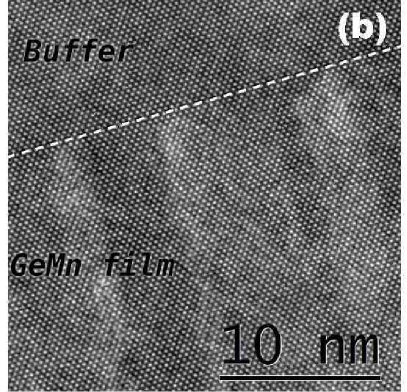
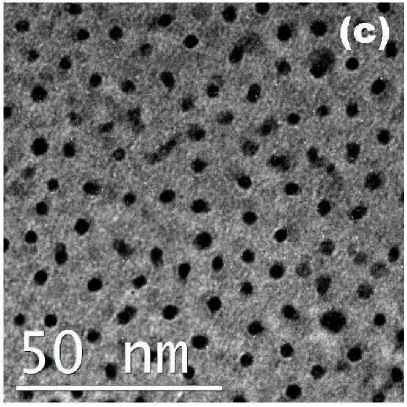
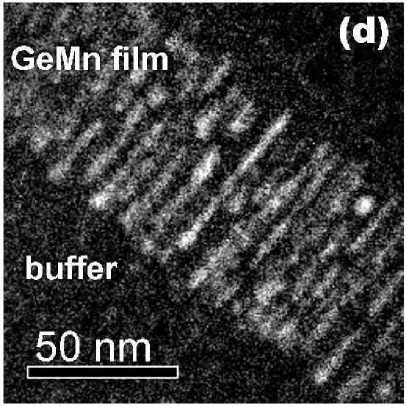
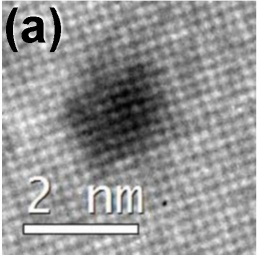
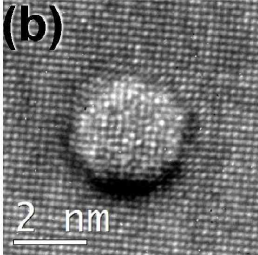
In samples grown at 130∘C and containing 6 % Mn, we can observe vertical elongated nanostructures i.e. nanocolumns as shown in Fig. 2a. Nanocolumns extend through the whole Ge1-xMnx film thickness. From the high resolution TEM image shown in Fig. 2b, we deduce their average diameter around 3 nm. Moreover in Fig. 2b, the interface between the Ge buffer layer and the Ge1-xMnx film is flat and no defect propagates from the interface into the film. The Ge1-xMnx film is a perfect single crystal in epitaxial relationship with the substrate. In Fig. 2c is shown a plane view micrograph of the same sample confirming the presence of nanocolumns in the film. From this image, we can deduce the size and density of nanocolumns. The nanocolumns density is 13000 with a mean diameter of 3 nm which is coherent with cross-section measurements. In order to estimate the chemical composition of these nanocolumns, we further performed chemical mapping using EFTEM. In Fig. 2d we show a cross sectional Mn chemical map of the Ge1-xMnx film. This map shows that the formation of nanocolumns is a consequence of Mn segregation. Nanocolumns are Mn rich and the surrounding matrix is Mn poor. However, it is impossible to deduce the Mn concentration in Ge1-xMnx nanocolumns from this cross section. Indeed, in cross section observations, the columns diameter is much smaller than the probed film thickness and the signal comes from the superposititon of the Ge matrix and Mn-rich nanocolumns. In order to quantify Mn concentration inside the nanocolumns and inside the Ge matrix, EELS measurements (not shown here) have been performed in a plane view geometry Jamet et al. (2006). These observations revealed that the matrix Mn content is below 1 % (detection limit of our instrument). Measuring the surface occupied by the matrix and the nanocolumns in plane view TEM images, and considering the average Mn concentration in the sample (6 %), we can estimate the Mn concentration in the nanocolumns. The Mn concentration measured by EELS being between 0% and 1%, we can conclude that the Mn content in the nanocolumns is between 30 % and 38 %.
For samples grown between 80∘C and 150∘C cross section and plane view TEM observations reveal the presence of Mn rich nanocolumns surrounded with a Mn poor Ge matrix. In order to investigate the influence of Mn concentration on the structural properties of Ge1-xMnx films, ten samples have been grown at 100∘C and at 150∘C with Mn concentrations of 1.3 %, 2.3 %, 4 %, 7 % and 11.3 %. Their structural properties have been investigated by plane view TEM observations.
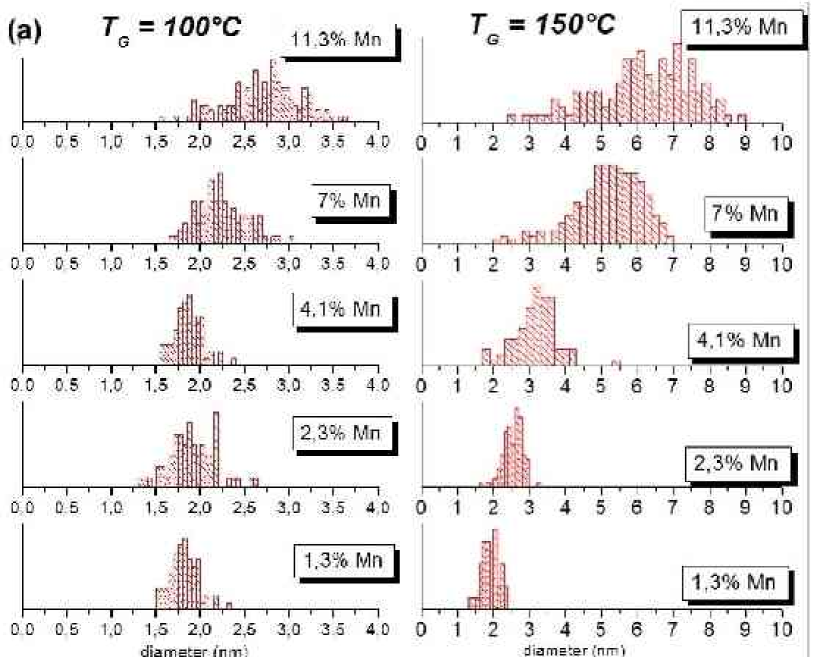
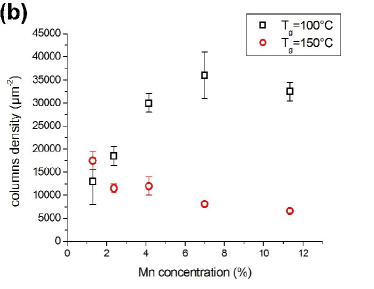
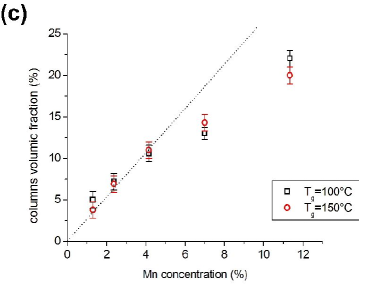
For samples grown at 100∘C with Mn concentrations below 5 % the nanocolumns mean diameter is 1.80.2 nm. The evolution of columns density as a fonction of Mn concentration is reported in figure 3b. By increasing the Mn concentration from 1.3 % to 4 % we observe a significant increase of the columns density from 13000 to 30000 . For Mn concentrations higher than 5 % the density seems to reach a plateau corresponding to 35000 and their diameter slightly increases from 1.8 nm at 4 % to 2.8 nm at 11.3 %. By plotting the volume fraction occupied by the columns in the film as a function of Mn concentration, we observe a linear dependence for Mn contents below 5 %. The non-linear behavior above 5 % may indicate that the mechanism of Mn incorporation is different in this concentration range, leading to an increase of Mn concentration in the columns or in the matrix. For samples grown at 100∘C, nanocolumns are always fully coherent with the surrounding matrix (Fig. 4a).
Increasing the Mn content in the samples grown at 150∘C from 1.3 % to 11.3 % leads to a decrease of the columns density (fig 3b). Moreover, their average diameter increases significantly and size distributions become very broad (see Fig. 3a). For the highest Mn concentration (11.3 %) we observe the coexistence of very small columns with a diameter of 2.5 nm and very large columns with a diameter of 9 nm. In samples grown at 150∘C containing 11.3 % of Mn, the crystalline structure of nanocolumns is also highly modified. In plane view TEM micrographs, one can see columns exhibiting several different crystalline structures. We still observe some columns which are fully coherent with the Ge matrix like in the samples grown at lower temperature. Nevertheless, observations performed on these samples grown at 150∘C and with 11.3% Mn reveal some uniaxially Jamet et al. (2006) or fully relaxed columns exhibiting a misfit of 4 % between the matrix and the columns and leading to misfit dislocations at the interface between the column and the matrix (see fig. 4b). Thus we can conclude that coherent columns are probably in strong compression and the surrounding matrix in tension. On the same samples (Tg=150∘C, 11.3% Mn), we also observe a large number of highly disordered nanocolumns leading to an amorphous like TEM contrast(fig. 4c).

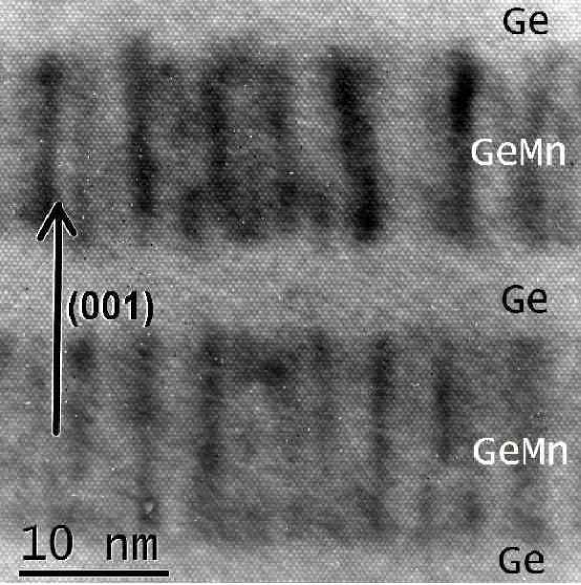
In conclusion, we have evidenced a complex mechanism of Mn incorporation in Mn doped Ge films grown at low temperature. In particular Mn incorporation is highly inhomogeneous. For very low growth temperatures (below 120∘C) the diffusion of Mn atoms leads to the formation of Mn rich, vertical nanocolumns. Their density mostly depends on Mn concentration and their mean diameter is about 2 nm. These results can be compared with the theoretical predictions of Fukushima et al. Fukushima et al. (2006): they proposed a model of spinodal decomposition in (Ga,Mn)N and (Zn,Cr)Te based on layer by layer growth conditions and a strong pair attraction between Mn atoms which leads to the formation of nanocolumns. This model may also properly describe the formation of Mn rich nanocolumns in our samples. Layer by layer growth conditions can be deduced from RHEED pattern evolution during growth. For all the samples grown at low temperature, RHEED observations clearly indicate two-dimensional growth. Moreover, Ge/Ge1-xMnx/Ge heterostructures have been grown and observed by TEM (see Fig. 5). Ge1-xMnx/Ge (as well as Ge/Ge1-xMnx) interfaces are very flat and sharp thus confirming a two-dimensional, layer by layer growth mode. Therefore we can assume that the formation of Mn rich nanocolumns is a consequence of 2D-spinodal decomposition.
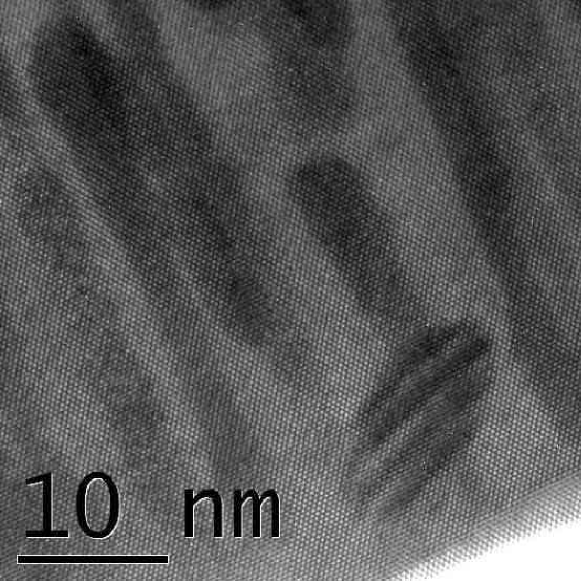
For growth temperatures higher than 160∘C, cross section TEM and EFTEM observations (not shown here) reveal the coexistence of two Mn-rich phases: nanocolumns and Ge3Mn5 nanoclusters embedded in the germanium matrix. A typical high resolution TEM image is shown in figure 6. Ge3Mn5 clusters are not visible in RHEED patterns for temperatures below 180∘C. To investigate the nature of these clusters, we performed x-ray diffraction in mode. Diffraction scans were acquired on a high resolution diffractometer using the copper Kα radiation and on the GMT station of the BM32 beamline at the European Synchrotron Radiation Facility (ESRF). Three samples grown at different temperatures and/or annealed at high temperature were investigated. The two first samples are Ge1-xMnx films grown at 130∘C and 170∘C respectively. The third one has been grown at 130∘C and post-growth annealed at 650∘C. By analysing x-ray diffraction spectra, we can evidence two different crystalline structures. For the sample grown at 130∘C, the scan only reveals the (004) Bragg peak of the germanium crystal, confirming the good epitaxial relationship between the layer and the substrate, and the absence of secondary phases in the film in spite of a high dynamics of the order of 107. For both samples grown at 170∘C and annealed at 650∘C, spectra are identical. In addition to the (004) peak of germanium, we observe three additional weak peaks. The first one corresponds to the (002) germanium forbidden peak which probably comes from a small distortion of the germanium crystal, and the two other peaks are respectively attributed to the (002) and (004) Bragg peaks of a secondary phase. The lattice parameter of Ge3Mn5 hexagonal crystal is 5.053 Å Forsyth and Brown (1990) which is in very good agreement with the values obtained from diffraction data for both (002) and (004) lines assuming that the axis of Ge3Mn5 is along the [001] direction of the Ge substrate.
In summary, in a wide range of growth temperatures and Mn concentrations, we have evidenced a two-dimensional spinodal decomposition leading to the formation of Mn-rich nanocolumns in Ge1-xMnx films. This decomposition is probably the consequence of: a strong pair attraction between Mn atoms, a strong surface diffusion of Mn atoms in germanium even at low growth temperatures and layer by layer growth conditions. We have also investigated the influence of growth parameters on the spinodal decomposition: at low growth temperatures (100∘C), increasing the Mn content leads to higher columns densities while at higher growth temperatures (150∘C), the columns density remains nearly constant whereas their size increases drastically. By plotting the nanocolumns density as a function of Mn content, we have shown that the mechanism of Mn incorporation in Ge changes above 5 % of Mn. Finally, using TEM observations and x-ray diffraction, we have shown that Ge3Mn5 nanoclusters start to form at growth temperatures higher than 160∘C.
IV Magnetic properties
We have thoroughly investigated the magnetic properties of thin Ge1-xMnx films for different growth temperatures and Mn concentrations. In this section, we focus on Mn concentrations between 2 % and 11 %. We could clearly identify four different magnetic phases in Ge1-xMnx films : diluted Mn atoms in the germanium matrix, low nanocolumns ( 170 K), high nanocolumns ( 400 K) and Ge3Mn5 clusters ( 300 K). The relative weight of each phase clearly depends on the growth temperature and to a lesser extend on Mn concentration. For low growth temperature ( 120∘C), we show that nanocolumns are actually made of four uncorrelated superparamagnetic nanostructures. Increasing Tg above 120∘C, we first obtain continuous columns exhibiting low ( 170 K) and high ( 400 K) for 130∘C. The larger columns become ferromagnetic i.e. . Meanwhile Ge3Mn5 clusters start to form. Finally for higher , the magnetic contribution from Ge3Mn5 clusters keeps increasing while the nanocolumns signal progressively disappears.
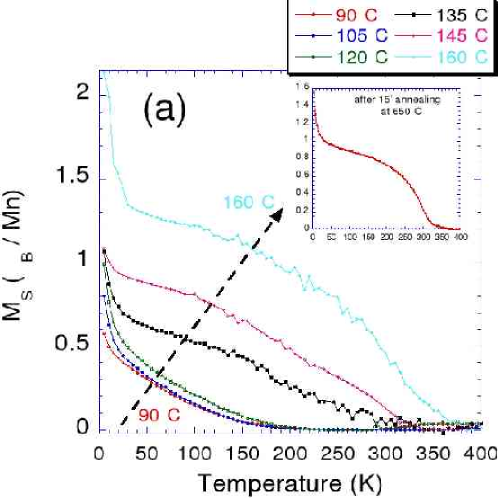
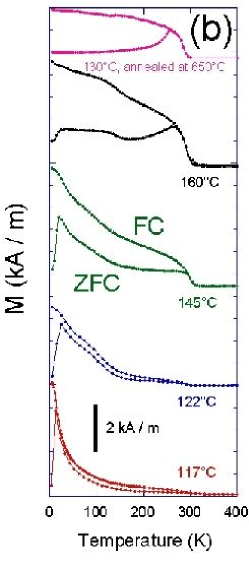
In Fig. 7a, the saturation magnetization at 2 Tesla in /Mn of Ge1-xMnx films with 7 % of Mn is plotted as a function of temperature for different growth temperatures ranging from =90∘C up to 160∘C. The inset shows the temperature dependence of the magnetization at 2 Tesla after annealing at 650∘C during 15 minutes. Figure 7b displays the corresponding Zero Field Cooled - Field Cooled (ZFC-FC) curves recorded at 0.015 Tesla. In the ZFC-FC procedure, the sample is first cooled down to 5 K in zero magnetic field and the susceptibility is subsequently recorded at 0.015 Tesla while increasing the temperature up to 400 K (ZFC curve). Then, the susceptibility is recorded under the same magnetic field while decreasing the temperature down to 5 K (FC curve). Three different regimes can be clearly distinguished.
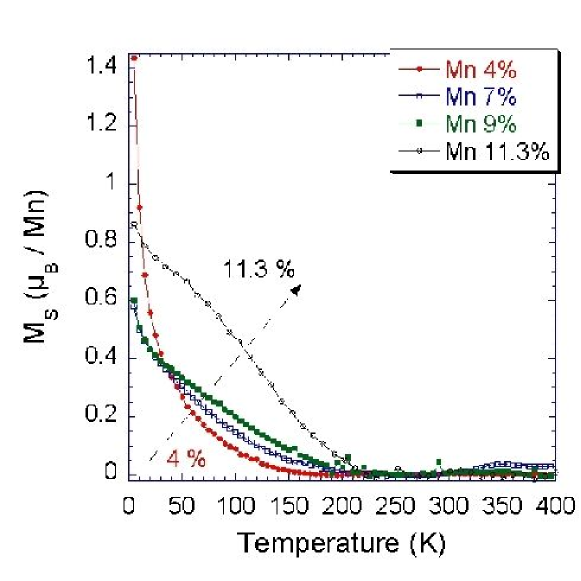
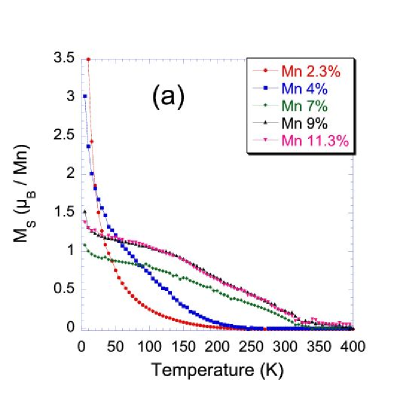
For 120∘C, the temperature dependence of the saturation magnetization remains nearly the same while increasing growth temperature. The overall magnetic signal vanishing above 200 K is attributed to the nanocolumns whereas the increasing signal below 50 K originates from diluted Mn atoms in the surrounding matrix. The Mn concentration dependence of the saturation magnetization is displayed in figure 8. For the lowest Mn concentration (4 %), the contribution from diluted Mn atoms is very high and drops sharply for higher Mn concentrations (7 %, 9 % and 11.3 %). Therefore the fraction of Mn atoms in the diluted matrix decreases with Mn concentration probably because Mn atoms are more and more incorporated in the nanocolumns. In parallel, the Curie temperature of nanocolumns increases with the Mn concentration reaching 170 K for 11.3 % of Mn. This behavior may be related to different Mn compositions and to the increasing diameter of nanocolumns (from 1.8 nm to 2.8 nm) as discussed in section III.
ZFC-FC measurements show that the nanocolumns are superparamagnetic. The magnetic signal from the diluted Mn atoms in the matrix is too weak to be detected in susceptibility measurements at low temperature. In samples containing 4 % of Mn, ZFC and FC curves superimpose down to low temperatures. As we do not observe hysteresis loops at low temperature, we believe that at this Mn concentration nanocolumns are superparamagnetic in the whole temperature range and the blocking temperature cannot be measured. For higher Mn contents, the ZFC curve exhibits a very narrow peak with a maximum at the blocking temperature of 15 K whatever the Mn concentration and growth temperature (see Fig. 7b). Therefore the anisotropy barrier distribution is narrow and assuming that nanocolumns have the same magnetic anisotropy, this is a consequence of the very narrow size distribution of the nanocolumns as observed by TEM. To probe the anisotropy barrier distribution, we have performed ZFC-FC measurements but instead of warming the sample up to 400 K, we stopped at a lower temperature .

If this temperature falls into the anisotropy barrier distribution as depicted in Fig. 9, the FC curve deviates from the ZFC curve. Indeed the smallest nanostructures have become superparamagnetic at and when decreasing again the temperature, their magnetization freezes along a direction close to the magnetic field and the FC susceptibility is higher than the ZFC susceptibility. Therefore any irreversibility in this procedure points at the presence of superparamagnetic nanostructures. The results are given in Fig. 10a. ZFC and FC curves clearly superimpose up to =250 K thus the nanocolumns are superparamagnetic up to their Curie temperature and no Ge3Mn5 clusters could be detected. Moreover for low values, a peak appears at low temperature in FC curves which evidences strong antiferromagnetic interactions between the nanocolumns Chantrell et al. (2000).
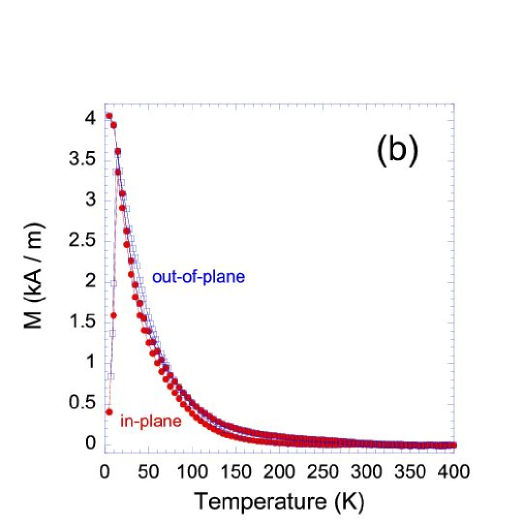
In order to derive the magnetic size and anisotropy of the Mn-rich nanocolumns embedded in the Ge matrix, we have fitted the inverse normalized in-plane (resp. out-of-plane) susceptibility: (resp. ). The corresponding experimental ZFC-FC curves are reported in Fig. 10b. Since susceptibility measurements are performed at low field (0.015 T), the matrix magnetic signal remains negligible. In order to normalize susceptibility data, we need to divide the magnetic moment by the saturated magnetic moment recorded at 5 T. However the matrix magnetic signal becomes very strong at 5 T and low temperature so that we need to subtract it from the saturated magnetic moment using a simple Curie function. From Fig. 10b, we can conclude that nanocolumns are isotropic. Therefore to fit experimental data we use the following expression well suited for isotropic systems or cubic anisotropy: . is the Boltzmann constant, is the magnetic moment of a single-domain nanostructure (macrospin approximation) where is its magnetization and its volume. The in-plane magnetic field is applied along or crystal axes. Since the nanostructures Curie temperature does not exceed 170 K, the temperature dependence of the saturation magnetization is also accounted for by writting . Antiferromagnetic interactions between nanostructures are also considered by adding an effective field estimated in the mean field approximation Fruchart et al. (2002): . The only fitting parameters are the maximum magnetic moment (i.e. at low temperature) per nanostructure: (in Bohr magnetons ) and the maximum interaction field (i.e. at low temperature): .
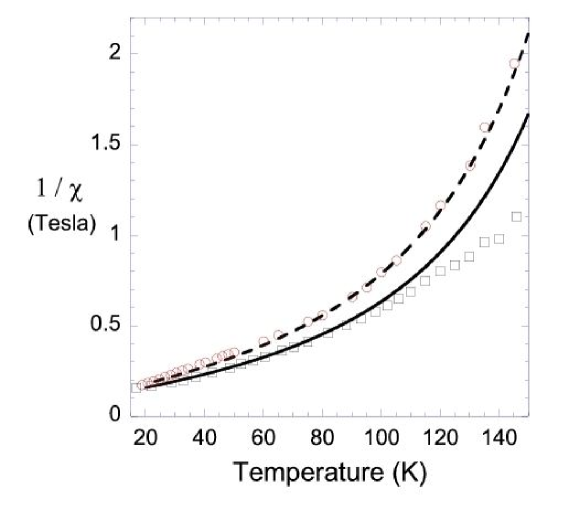
In Fig. 11, the best fits lead to 1250 and 102 mT for in-plane susceptibility and 1600 and 98 mT for out-of-plane susceptibility. It gives an average magnetic moment of 1425 per column and an effective interaction field of 100 mT. Using this magnetic moment and its temperature dependence, magnetization curves could be fitted using a Langevin function and curves superimpose for 100 K. However, from the saturated magnetic moment of the columns and their density (35000 ), we find almost 6000 per column. Therefore, for low growth temperatures, we need to assume that nanocolumns are actually made of almost four independent elongated magnetic nanostructures. The effective field for antiferromagnetic interactions between nanostructures estimated from the susceptibility fits is at least one order of magnitude larger than what is expected from pure magnetostatic coupling. This difference may be due to either an additional antiferromagnetic coupling through the matrix which origin remains unexplained or to the mean field approximation which is no more valid in this strong coupling regime. As for magnetic anisotropy, the nanostructures behave as isotropic magnetic systems or exhibit a cubic magnetic anisotropy. First we can confirm that nanostructures are not amorphous otherwise shape anisotropy would dominate leading to out-of-plane anisotropy. We can also rule out a random distribution of magnetic easy axes since the nanostructures are clearly crystallized in the diamond structure and would exhibit at least a cubic anisotropy (except if the random distribution of Mn atoms within the nanostructures can yield random easy axes). Since the nanostructures are in strong in-plane compression (their lattice parameter is larger than the matrix one), the cubic symmetry of the diamond structure is broken and magnetic cubic anisotropy is thus unlikely. We rather believe that out-of-plane shape anisotropy is nearly compensated by in-plane magnetoelastic anisotropy due to compression leading to a pseudo cubic anisotropy. From the blocking temperature (15 K) and the magnetic volume of the nanostructures , we can derive their magnetic anisotropy constant using : K10 kJ.m-3 which is of the same order of magnitude as shape anisotropy.
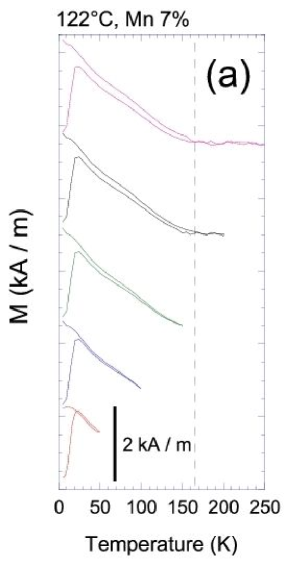
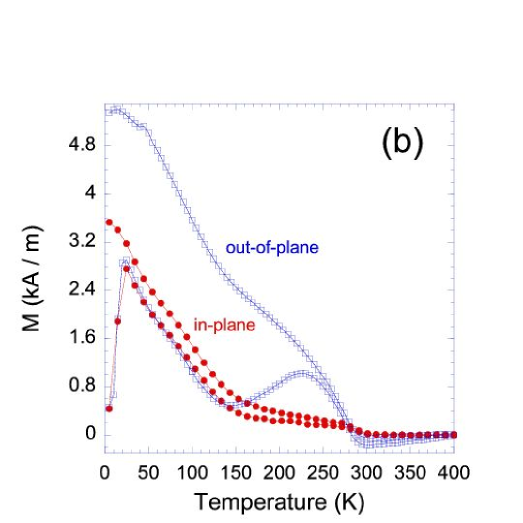
For growth temperatures 120∘C and Mn concentrations 7 %, samples exhibit a magnetic signal above 200 K corresponding to Ge3Mn5 clusters (see Fig. 7a). As we can see, SQUID measurements are much more sensitive to the presence of Ge3Mn5 clusters, even at low concentration, than TEM and x-ray diffraction used in section III. We also observe a sharp transition in the ZFC curve (see Fig. 7b, Fig. 12a and 12b): the peak becomes very large and is shifted towards high blocking temperatures (the signal is maximum at 23 K). This can be easily understood as a magnetic percolation of the four independent nanostructures obtained at low growth temperatures into a single magnetic nanocolumn. Therefore the magnetic volume increases sharply as well as blocking temperatures. At the same time, the size distribution widens as observed in TEM. In Fig. 12a, we have performed ZFC-FC measurements at different temperatures. The ZFC-FC irreversibility is observed up to the Curie temperature of 120 K meaning that a fraction of nanocolumns is ferromagnetic (i.e. ). In Fig. 12b, in-plane and out-of-plane ZFC curves nearly superimpose for 150 K due to the isotropic magnetic behavior of the nanocolumns: in-plane magnetoelastic anisotropy is still compensating out-of-plane shape anisotropy. Moreover the magnetic signal above 150 K corresponding to Ge3Mn5 clusters that start to form in this growth temperature range is strongly anisotropic. This perpendicular anisotropy confirms the epitaxial relation: (0002) Ge3Mn5 (002) Ge discussed in Ref.Bihler et al. (2006). The magnetic easy axis of the clusters lies along the hexagonal -axis which is perpendicular to the film plane.
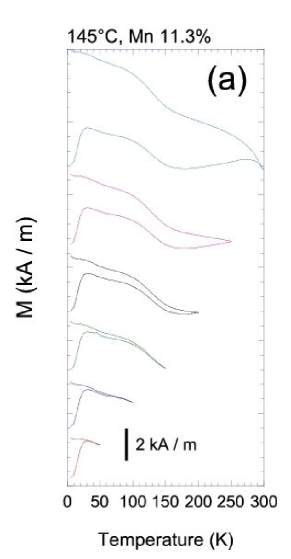
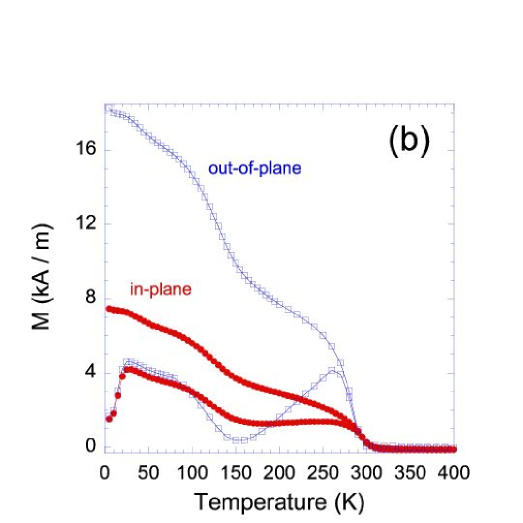
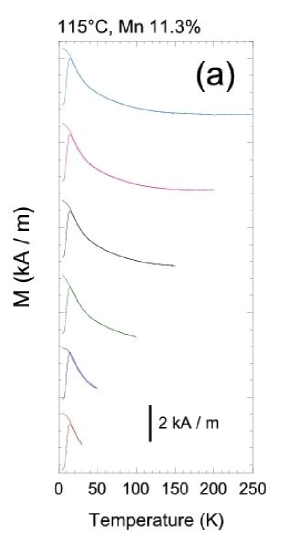
For growth temperatures 145∘C the cluster magnetic signal dominates (Fig. 13b). Superparamagnetic nanostructures are investigated performing ZFC-FC measurements at different temperatures (Fig. 13a). The first ZFC peak at low temperature i.e. 150 K is attributed to low- nanocolumns (130 K). This peak is wider than for lower growth temperatures and its maximum is further shifted up to 30 K. These results are in agreement with TEM observations: increasing leads to larger nanocolumns (i.e. higher blocking temperatures) and wider size distributions. ZFC-FC irreversibility is observed up to the Curie temperature due to the presence of ferromagnetic columns. The second peak above 180 K in the ZFC curve is attributed to Ge3Mn5 clusters and the corresponding ZFC-FC irreversibility persisting up to 300 K means that some clusters are ferromagnetic. We clearly evidence the out-of-plane anisotropy of Ge3Mn5 clusters and the isotropic magnetic behavior of nanocolumns (Fig. 13b). In this growth temperature range, we have also investigated the Mn concentration dependence of magnetic properties.
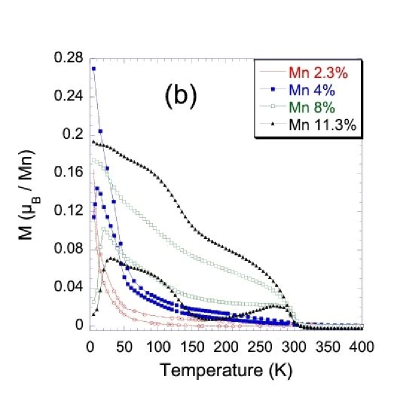
In Fig. 14a, for low Mn concentrations (2.3 % and 4 %) the contribution from diluted Mn atoms in the germanium matrix to the saturation magnetization is very high and nearly vanishes for higher Mn concentrations (7 %, 9 % and 13 %) as observed for low growth temperatures. Above 7 %, the magnetic signal mainly comes from nanocolumns and Ge3Mn5 clusters. We can derive more information from ZFC-FC measurements (Fig. 14b). Indeed, for 2.3 % of Mn, ZFC and FC curves nearly superimpose down to low temperature meaning that nanocolumns are superparamagnetic in the whole temperature range. Moreover the weak irreversibility arising at 300 K means that some Ge3Mn5 clusters have already formed in the samples even at very low Mn concentrations. For 4 % of Mn, we can observe a peak with a maximum at the blocking temperature (12 K) in the ZFC curve. We can also derive the Curie temperature of nanocolumns: 45 K. The irresversibility arising at 300 K still comes from Ge3Mn5 clusters. Increasing the Mn concentration above 7 % leads to: higher blocking temperatures (20 K and 30 K) due to larger nanocolumns and wider ZFC peaks due to wider size distributions in agreement with TEM observations (see Fig. 3a). Curie temperatures also increase (110 K and 130 K) as well as the contribution from Ge3Mn5 clusters.
Finally when increasing above 160∘C, the nanocolumns magnetic signal vanishes and only Ge3Mn5 clusters and diluted Mn atoms coexist. The overall magnetic signal becomes comparable to the one measured on annealed samples in which only Ge3Mn5 clusters are observed by TEM (see Fig. 7a).
The magnetic properties of high- nanocolumns obtained for close to 130∘C are discussed in detail in Ref.Jamet et al. (2006).
In conclusion, at low growth temperatures (120∘C), nanocolumns are made of almost 4 independent elongated magnetic nanostructures. For 120∘C, these independent nanostructures percolate into a single nanocolumn sharply leading to higher blocking temperatures. Increasing leads to larger columns with a wider size distribution as evidenced by ZFC-FC measurements and given by TEM observations. In parallel, some Ge3Mn5 clusters start to form and their contribution increases when increasing . Results on magnetic anisotropy seems counter-intuitive. Indeed Ge3Mn5 clusters exhibit strong out-of-plane anisotropy whereas nanocolumns which are highly elongated magnetic structures are almost isotropic. This effect is probably due to compensating in-plane magnetoelastic coupling (due to the columns compression) and out-of-plane shape anisotropy.
V Conclusion
In this paper, we have investigated the structural and magnetic properties of thin Ge1-xMnx films grown by low temperature molecular beam epitaxy. A wide range of growth temperatures and Mn concentrations have been explored. All the samples contain Mn-rich nanocolumns as a consequence of 2D-spinodal decomposition. However their size, crystalline structure and magnetic properties depend on growth temperature and Mn concentration. For low growth temperatures, nanocolumns are very small (their diameter ranges between 1.8 nm for 1.3 % of Mn and 2.8 nm for 11.3 % of Mn), their Curie temperature is rather low ( 170 K) and they behave as almost four uncorrelated superparamagnetic nanostructures. Increasing Mn concentration leads to higher columns densities while diameters remain nearly unchanged. For higher growth temperatures, the nanocolumns mean diameter increases and their size distribution widens. Moreover the 4 independent magnetic nanostructures percolate into a single magnetic nanocolumn. Some columns are ferromagnetic even if Curie temperatures remain quite low. In this regime, increasing Mn concentration leads to larger columns while their density remains nearly the same. In parallel, Ge3Mn5 nanoclusters start to form in the film with their -axis perpendicular to the film plane. In both temperature regimes, the Mn incorporation mechanism in the nanocolumns and/or in the matrix changes above 5 % of Mn and nanocolumns exhibit an isotropic magnetic behaviour due to the competing effects of out-of-plane shape anisotropy and in-plane magnetoelastic coupling. Finally for a narrow range of growth temperatures around 130∘C, nanocolumns exhibit Curie temperatures higher than 400 K. Our goal is now to investigate the crystalline structure inside the nanocolumns, in particular the position of Mn atoms in the distorted diamond structure, which is essential to understand magnetic and future transport properties in Ge1-xMnx films.
VI Aknowledgements
The authors would like to thank Dr. F. Rieutord for grazing incidence x-ray diffraction measurements performed on the GMT station of BM32 beamline at the European Synchrotron Radiation Facility.
References
- Ohno et al. (2000) H. Ohno, D. Chiba, F. Matsukura, T. Omiya, E. Abe, T. Dietl, Y. Ohno, and K. Ohtani, Nature 408, 944 (2000).
- Boukari et al. (2002) H. Boukari, P. Kossacki, M. Bertolini, D. Ferrand, J. Cibert, S. Tatarenko, A. Wasiela, J. A. Gaj, and T. Dietl, Phys. Rev. Lett. 88, 207204 (2002).
- Dietl (2002) T. Dietl, Semicond. Sci. Technol. 17, 377 (2002).
- Dietl (2006) T. Dietl, Nature Mat. 5, 673 (2006).
- Fukushima et al. (2006) T. Fukushima, K. Sato, H. Katayama-Yoshida, and P. H. Dederichs, Jpn. J. Appl. Phys 45, L416 (2006).
- Park et al. (2002) Y. D. Park, A. T. Hanbicki, S. C. Erwin, C. S. Hellberg, J. M. Sullivan, J. E. Mattson, T. F. Ambrose, A. Wilson, G. Spanos, and B. T. Jonker, Science 295, 651 (2002).
- Pinto et al. (2005) N. Pinto, L. Morresi, M. Ficcadenti, R. Murri, F. D’Orazio, F. Lucari, L. Boarino, and G. Amato, Phys. Rev. B 72, 165203 (2005).
- Li et al. (2005) A. P. Li, J. F. Wendelken, L. C. Feldman, J. R. Thompson, and H. H. Weitering, Appl. Phys. Lett. 86, 152507 (2005).
- Tsui et al. (2003) F. Tsui, L. He, L. Ma, A. Tkachuk, Y. S. Chu, K. Nakajima, and T. Chikyow, Phys. Rev. Lett. 91, 177203 (2003).
- Cho et al. (2002) S. Cho, S. Choi, S. C. Hong, Y. Kim, J. B. Ketterson, B.-J. Kim, Y. C. Kim, and J. H. Jung, Phys. Rev. B 66, 033303 (2002).
- Kang et al. (2005) J.-S. Kang, G. Kim, S. C. Wi, S. S. Lee, S. Choi, S. Cho, S. Han, K. H. Kim, H. J. Song, H. J. Shin, et al., Phys. Rev. Lett. 94, 147202 (2005).
- Bihler et al. (2006) C. Bihler, C. Jaeger, T. Vallaitis, M. Gjukic, M. S. Brandt, E. Pippel, J. Woltersdorf, and U. Gösele, Appl. Phys. Lett. 88, 112506 (2006).
- Morresi et al. (2006) L. Morresi, J. Ayoub, N. Pinto, M. Ficcadenti, R. Murri, A. Ronda, and I. Berbezier, Mat. Sci. Semicond. Process 9, 836 (2006).
- Passacantando et al. (2006) M. Passacantando, L. Ottaviano, F. D’Orazio, F. Lucari, M. D. Biase, G. Impellizzeri, and F. Priolo, Phys. Rev. B 73, 195207 (2006).
- Ahlers et al. (2006) S. Ahlers, D. Bougeard, N. Sircar, G. Abstreiter, A. Trampert, M. Opel, and R. Gross, Phys. Rev. B 74, 214411 (2006).
- Massalski (1990) T. B. Massalski, Binary Alloy Phase Diagrams, vol. 2 (American Society for Metals, Metals Park, OH, 1990).
- Park et al. (2001) Y. D. Park, A. Wilson, A. T. Hanbicki, J. E. Mattson, T. Ambrose, G. Spanos, and B. T. Jonker, Appl. Phys. Lett. 78, 2739 (2001).
- Sugahara et al. (2005) S. Sugahara, K. L. Lee, S. Yada, and M. Tanaka, Jpn. J. Appl. Phys. 44, 1426 (2005).
- Jamet et al. (2006) M. Jamet, A. Barski, T. Devillers, V. Poydenot, R. Dujardin, P. Bayle-Guillemaud, J. Rothman, E. Bellet-Amalric, A. Marty, J. Cibert, et al., Nature Mat. 5, 653 (2006).
- Kagawa et al. (1982) S. Kagawa, T. Mikawa, and T. Kaneda, Jpn. J. Appl. Phys. 21, 1616 (1982).
- Forsyth and Brown (1990) J. B. Forsyth and P. J. Brown, J. Phys.: Condens. Matter 2, 2713 (1990).
- Chantrell et al. (2000) R. W. Chantrell, N. Walmsley, J. Gore, and M. Maylin, Phys. Rev. B 63, 024410 (2000).
- Fruchart et al. (2002) O. Fruchart, P.-O. Jubert, C. Meyer, M. Klaua, J. Barthel, and J. Kirschner, J. Magn. Magn. Mat. 239, 224 (2002).