The Garching-Bonn Deep Survey (GaBoDS) Wide-Field-Imaging Reduction Pipeline
Abstract
We introduce our publicly available Wide-Field-Imaging reduction pipeline THELI. The procedures applied for the efficient pre-reduction and astrometric calibration are presented. A special emphasis is put on the methods applied to the photometric calibration. As a test case the reduction of optical data from the ESO Deep Public Survey including the WFI-GOODS data is described. The end-products of this project are now available via the ESO archive Advanced Data Products section.
1 Introduction
Over the past years our group has developed a wide-field-imaging reduction pipeline called THELI which is now publicly available.111ftp://ftp.ing.iac.es/mischa/THELI/ Since data reduction for most optical and near-infrared cameras is very similar the pipeline was designed in an instrument-independent way from the beginning. It is easily adaptable to new cameras by use of instrument configuration files. Nearly fully automatic processing with little need for interaction quickly leads to scientifically exploitable results making the reduction of one night of wide-field-imaging data (e.g. from WFI@ESO/MPG2.2m) possible in a few hours. Large parts of the pipeline are parallelised increasing speed in presence of a multi-CPU machine. A graphical user interface (GUI) is available which facilitates the handling of reduction and configuration of THELI. A detailed description of the pipeline can be found in Erben et al. (2005). The modules for absolute photometric calibration which are not part of the public release at the moment are described in Hildebrandt et al. (2006).
2 Structure
The pipeline is based on a number of excellent existing open source software packages like the LDAC tools, different TERAPIX packages (SExtractor, SWarp, etc.), Eclipse, Astrometrix, and IMCAT, besides others. Bash scripts are wrapped around these packages in order to handle the communication between the different tasks, to control configuration parameters, and to produce some plots for quality control. Due to this modular structure the pipeline is easily extensible and modules can be exchanged if better ones become available. This was done several times in the past; e.g., for resampling and coaddition drizzle was replaced by SWarp.
Building up a pipeline from many different software packages naturally has some disadvantages when compared to a homogeneous system which is developed from scratch. The data flow is not as transparent and error handling becomes more complicated. For very large projects like the major upcoming imaging surveys it would be desirable to be able to track the history of each of the many thousand reduced images back to the raw images. This can only be done with a sophisticated database system which is at the moment not implemented in THELI.
3 Processing
3.1 Pre-Processing
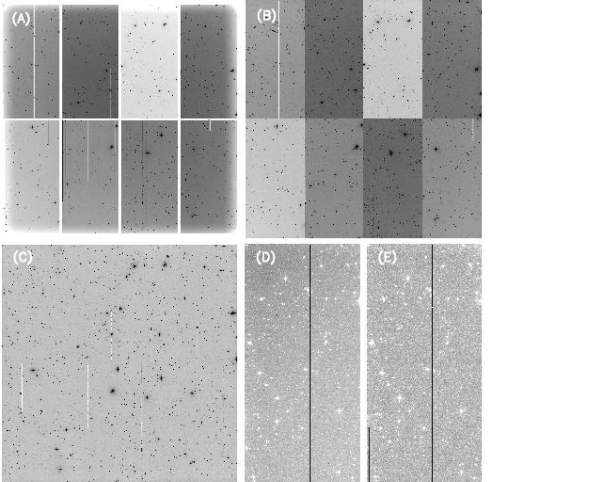
The pre-processing, i.e. the removal of instrumental signatures from the data, is done on a single chip basis and does not differ from well established procedures applied for single-chip cameras. A standard debiasing and flatfielding is combined with a superflat and, if necessary, a fringe-removal. See Fig. 1 for a visual impression of some WFI data at different reduction steps.
3.2 Astrometric Calibration
THELI was designed with weak-lensing applications in mind. Therefore, a highly accurate astrometric calibration was mandatory from the beginning to minimise the impact of coaddition on the shape of the PSF. Astrometrix is used in combination with overlapping astrometry between all chips entering a coaddition to achieve an internal astrometric accuracy of a tenth of a pixel. The external accuracy is obviously limited by the accuracy of today’s astrometric standard star catalogues.
3.3 Photometric Calibration
The different chips of a camera are brought to the same photometric zeropoint by division with the appropriately rescaled superflat. Since some residuals may be left after this procedure we perform an internal photometric calibration from overlap objects between different chips of different exposures to derive relative zeropoints, , which satisfy the additional condition .
All available Landolt/Stetson standard-star exposures of the considered nights are reduced in the same way as the science exposures. Absolute photometric zeropoints, colour terms, and extinction coefficients are estimated from these exposures. From those photometric parameters and the relative zeropoints we calculate corrected zeropoints, , for all images belonging to calibrated nights:
Theoretically these corrected zeropoints should all coincide. A plot showing the distribution of all corrected zeropoints is therefore an excellent tool to identify non-photometric nights that should not be used for absolute calibration (see Fig. 2).

Moreover, we check the absolute photometric calibration by means of galaxy number counts and, if images in more than one filter are available, by means of stellar colour-colour diagrams (see Fig. 3).

4 Reduction of the ESO Deep Public Survey
The ESO Deep Public Survey (DPS) is a deep multi-colour imaging survey overlapping with GOODS-South and carried out with WFI@ESO/MPG2.2m and SOFI@NTT. Here, we concentrate on the optical part in the filters . The survey covers three square degrees in total of which approximately two square degrees have full five-colour coverage to considerable depth. The reduction, quality control, and a comparison to a different reduction by the ESO Imaging Survey team is covered in Hildebrandt et al. (2006).
4.1 Survey Overview
In Table 1 the main characteristics of the DPS fields are summarised. The 5 limits in circular apertures of diameter are: , , , , )
| field | RA [h m s] | DEC [d m s] | avail. | comments |
|---|---|---|---|---|
| J2000.0 | J2000.0 | colours | ||
| Deep1a | 22:55:00.0 | 40:13:00 | ||
| b | 22:52:07.1 | 40:13:00 | ||
| c | 22:49:14.3 | 40:13:00 | ||
| d | 22:46:21.4 | 40:13:00 | — | |
| Deep2a | 03:37:27.5 | 27:48:46 | ||
| b | 03:34:58.2 | 27:48:46 | ||
| c | 03:32:29.0 | 27:48:46 | centred on GOODS-S | |
| d | 03:29:59.8 | 27:48:46 | ||
| Deep3a | 11:24:50.0 | 21:42:00 | ||
| b | 11:22:27.9 | 21:42:00 | ||
| c | 11:20:05.9 | 21:42:00 | ||
| d | 11:17:43.8 | 21:42:00 | ||
| Deep1e | 22:47:47.9 | 39:31:06 | ||
| f | 22:44:58.4 | 39:31:54 |
The reduction of the DPS was the first application of our pipeline to a large dataset consisting of more than 3000 raw science frames. During this reduction the pipeline was extensively debugged and optimised so that it is now in a very stable state.
4.2 Data Release
The data were released to the scientific community after reduction and careful checking. The images can be retrieved from our server222http://marvin.astro.uni-bonn.de/DPS/ or via the ESO archive Advanced Data Products section333http://archive.eso.org/archive/adp/GaBoDS/DPS_stacked_images_v1.0/. The DPS optical data are used by our group for studies of Lyman-break galaxies at (Hildebrandt et al. 2005, 2007a) and for weak-lensing studies supported by photometric redshifts (Hetterscheidt et al. 2006; Hildebrandt et al. 2007b).
References
- Erben et al. (2005) Erben, T., Schirmer, M., Dietrich, J. P., et al. 2005, Astronomische Nachrichten, 326, 432
- Girardi et al. (2002) Girardi, L., Bertelli, G., Bressan, A., et al. 2002, A&A, 391, 195
- Hetterscheidt et al. (2006) Hetterscheidt, M., Simon, P., Schirmer, M., et al. 2006, submitted to A&A, astro-ph/0606571
- Hildebrandt et al. (2005) Hildebrandt, H., Bomans, D. J., Erben, T., et al. 2005, A&A, 441, 905
- Hildebrandt et al. (2006) Hildebrandt, H., Erben, T., Dietrich, J. P., et al. 2006, A&A, 452, 1121
- Hildebrandt et al. (2007a) Hildebrandt, H., Pielorz, J., Erben, T., et al. 2007a, A&A, 462, 865
- Hildebrandt et al. (2007b) Hildebrandt, H., Wolf, C., & Benitez, N. 2007b, submitted to A&A