The Dynamical State of the Starless Dense Core FeSt 1-457: A Pulsating Globule?
Abstract
High resolution molecular line observations of CS (), HCO+ (), C18O (), C18O () and N2H+ () were obtained toward the starless globule FeSt 1-457 in order to investigate its kinematics and chemistry. The HCO+ and CS spectra show clear self-reversed and asymmetric profiles across the face of the globule. The sense of the observed asymmetry is indicative of the global presence of expansion motions in the outer layers of the globule. These motions appear to be subsonic and significantly below the escape velocity of the globule. Comparison of our observations with near-infrared extinction data indicate that the globule is gravitationally bound. Taken together these considerations lead us to suggest that the observed expansion has its origin in an oscillatory motion of the outer layers of the globule which itself is likely in a quasi-stable state near hydrostatic equilibrium. Analysis of the observed linewidths of C18O and N2H+ () confirm that thermal pressure is the dominant component of the cloud’s internal support. A simple calculation suggests that the dominant mode of pulsation would be an l = 2 mode with a period of yrs. Deformation of the globule due to the large amplitude l = 2 oscillation may be responsible for the double-peaked structure of the core detected in high resolution extinction maps.
Detailed comparison of the molecular-line observations and extinction data provides evidence for significant depletion of C18O and perhaps HCO+ while N2H+ () may be undepleted to a cloud depth of 40 magnitudes of visual extinction.
1 Introduction
A key component to understanding star formation lies in determining the dynamical nature of globules and cores of molecular clouds from which stars form. This is typically done using molecular lines, and observations of asymmetry or self-reversal in the line profiles of optically thick species portray the motion of the outer layers of material within a cloud. Many of the spectra measured from starless cores and globules have blue asymmetirc profiles, such that the blue side of the profile is stronger than the red side, suggestive of red-shifted self-absorption and infall motion. For example, in their survey of starless cores, Lee et al. (2001) found that approximately one third of the cores they observed displayed bona fide infall motions in the outer layers and therefore were consistent with expectations of collapse. In this survey and in a number of others, however, there were a number of cores that displayed evidence for blue-shifted self-absorption in their spectra, e.g., CB246, L1521F and L429-1. This is an indication of expansion but with no protostar in the core, what mechanism drives the expanding motions? There are also cores and globules which show both redshifted and blueshifted self-absorption simultaneously in a single map of one molecular transition, for example, L1512, L1689B, L1544 (Lee et al., 2001), and B68 (Lada et al., 2003). Other cores and globules have spectra that shift from redshifted to blueshifted self-absorption depending on which molecular transition is observed. For example, self -absorption in the source L1157 is redshifted in the HCO+() line profile but blueshifted in the HCO+() line profile (Gregersen et al., 1997). Clearly complex motions are occurring in the various layers of the cores but it is not clear what causes them.
Redman et al. (2004) concluded that the pattern of redshifted and blueshifted self-absorption observed across the source in L1689 is caused by rotational motion in the globule. In B68, where the spatial pattern switches from blueshifted to redshifted profiles both east and west of the center of the globule, the observed line profiles cannot be explained by rotation. Lada et al. (2003) proposed that B68 could be in a quasi-stable state near hydrostatic equilibrium, and the systematic velocity field observed is likely to be caused by oscillatory motions within the outer layers of the globule. For stable and quasi-stable clouds, such motions are predicted by theory, e.g., Matsumoto & Hanawa (2003) showed that small amounts of rotation can cause an initially gravitationally unstable cloud to stabilize and oscillate; Clarke & Pringle (1997) in considering the thermal and dynamical balance in low mass dense cores find that a quasi-equilibrium state can be established, which is not static but is pulsationally stable, and in their hydrodynamic study of starless cores, Keto & Field (2005) found that cores could oscillate with periods of about one million years (or the sound crossing time) if perturbed by a modest external force. Such oscillatory behavior is a signature of dynamical equilibrium, and therefore, the presence of such complex patterns in their spectral line maps could indicate pulsationally stable initial states for the star-forming cores and globules.
In this study, we have obtained high angular resolution spectra of the source listed in the catalogue of Feitzinger & Stüwe (1984) as FeSt 1-457. It is a small, round, dark globule situated in the Pipe Nebula with no associated IRAS, MSX or Spitzer Space Telescope point sources, and is therefore almost certainly starless. Its distance has not been directly determined but it is associated with the Pipe Nebula, for which some distance estimates have been made. The most reliable estimate to date is 130 pc determined by using infrared extinction measurements for Hipparcos stars, (Lombardi et al., 2006). In their Bonnor-Ebert sphere fitting analysis, however, Kandori et al. (2005) report a distance of 70 pc, which compares to the value of 90 pc derived in a similar fashion for B68, also, incidently, part of the Pipe Nebula complex. In this paper, we adopt the Lombardi et al. (2006) distance of 130 pc. The angular diameter of FeSt 1-457, as apparent in optical images, is 4.5, which is 35,000 AU (0.17 pc) at 130 pc. Section 2 describes our observations of FeSt 1-457, and §3, is a description of the results. We detected expanding motions in HCO+and CS line profiles across the surface of FeSt 1-457 but since no protostar has been detected, the source of this expansion is a mystery. In §4, we show that the core is bound and self-gravitating and we propose that pulsation or oscillatory motion within the cloud layers may account for the observed expanding motions. Finally, we present evidence for molecular depletion in the central regions of the core.
2 Observations
The observations reported here were made in July 2003 using the 30-m IRAM millimeter-wave telescope at Pico Veleta in Spain. The dual mixer, dual-channel receiver was tuned to observe the molecules listed with their respective frequencies, beamwidths and velocity resolutions in Table 1. The frequency-switching mode was used to obtain the observations, and system temperatures were 150 - 200 K. The chopper wheel method was used for calibration. The spectrometer is an autocorrelator configured to give the velocity resolutions listed in Table 1. Beam efficiencies were 0.75 for the lower frequency 80 - 115 GHz range, and 0.6 for the higher frequency 197 - 266 GHz range. Observations were made in a grid with a reference position at = 17h35m475, = -253320. HCO+, C18O () and C18O () were uniformly sampled such that a region centered on the reference position was observed every 24 out to a maximum distance of 96 in Right Ascension and 120 in Declination, a total of 9 11 or 99 spectra for each species. This grid spacing is approximately one beamwidth, slightly over for HCO+ and under for C18O. The N2H+ and CS emission was much weaker and less extended so the grid size was reduced to 5 5 around the reference point with an additional two measurements directly north, east, south and west of the center, resulting in a total of 33 spectra for these species. The spacing between measurements was also 24, approximately one beamwidth for each of the molecules. Data reduction was done using the standard IRAM package CLASS and IDL (Interactive Data Language by Research Systems, Inc.).
3 Results
3.1 Self-Reversed HCO+ and CS Lines
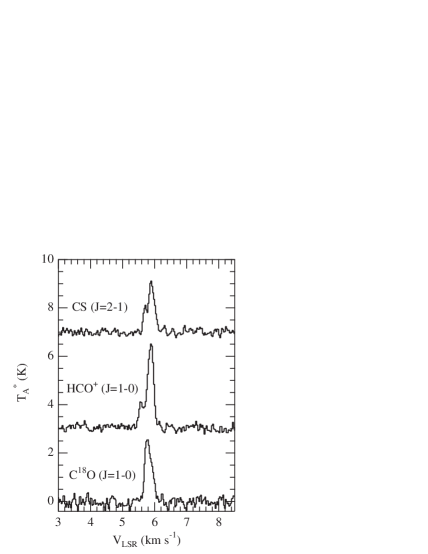
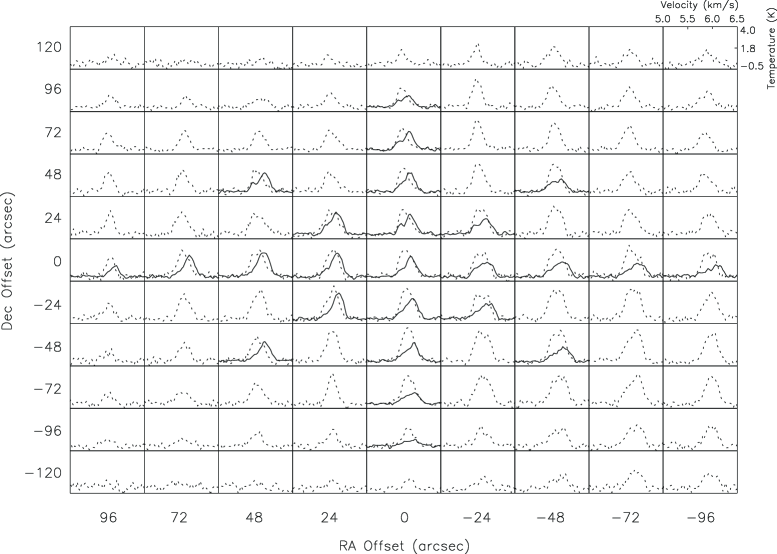
Figure 1 shows the CS (), HCO+ () and C18O () spectra at the reference position. The CS and HCO+ profiles display a split asymmetric, double-peaked shape while the C18O line is single-peaked, though slightly asymmetric. The C18O line appears to bisect the CS and HCO+ profiles in velocity indicating that the two latter lines are likely optically thick and self-reversed. The blue-shifted sense of the self-absorption in the self-reversals is indicative of expansion motions in the outer cloud layers. Individual spectra of the HCO+ and C18O () emission from across FeSt 1-457 are simultaneously displayed in Figure 2 for comparison. Examination of the figure shows similar double-peaked, self-reversed HCO+ emission profiles at several positions around the center of the globule. In all cases the sense of the asymmetry is the same suggesting expansion of the outer cloud layers. In most other positions the HCO+ lines display blue-shifted self-absorption relative to C18O, also consistent with expansion motions.
As can be seen in Figure 3 CS spectra are also clearly self-reversed with blue-shifted self-absorption similar to the HCO+ lines in positions where the HCO+ was also self-reversed, but the signals have lower intensity. Similar to HCO+, the other CS spectra appear to exhibit asymmetric profiles relative to C18O with a sense indicative of expansion motions. The critical density ( cm-3) at which CS emission occurs is the same as that for HCO+ emission (Ungerechts et al. 1997) so it is reasonable to assume that the two emission lines probe the same layer of material in the cloud.
A rough estimate of the expansion speed of material was determined by comparing the velocity of the stronger HCO+ peak to the peak velocity of a C18O spectrum at the same position. The peak velocities were obtained by fitting Gaussian line profiles to the spectral lines. This resulted in velocity differences = (C18O) - (HCO+) which are all negative confirming that the blueshifted profiles are characteristic of expansion, and indicating that material is expanding in the cloud over the whole layer under observation with a mean expansion velocity of -0.09 0.04 km s-1. The same process was applied to the CS spectra and the velocity differences ( = (C18O) - (CS)) were also found to be negative everywhere with a mean difference (expansion velocity) of -0.12 0.02 km s-1. This is similar to the range of for HCO+. This expanding motion is therefore also evident in the CS line emission profiles.
Another estimate of the expansion speed of material within the cloud was obtained using the model of Myers et al. (1996). This model can only be applied to positions (10 positions) where there is a clear double peak. In this model, the expansion velocity, is given by,
| (1) |
where is the brightness temperature of the dip, is the height of the blue peak above the dip with its corresponding velocity, , is the height of the red peak above the dip with its corresponding velocity, , is the velocity dispersion of an optically thin line (C18O here). For the HCO+ lines, the mean expansion speed was calculated to be -0.07 0.02 and and for the CS lines, -0.07 0.02 km s-1; both these estimates are somewhat lower than those derived from the peak velocity difference method in the previous paragraph. Nonetheless, though somewhat uncertain, the overall expansion speeds we estimate are formally less than the one dimensional sound speed of 0.19 km s-1 in a 10 K gas.
3.2 Velocity Field
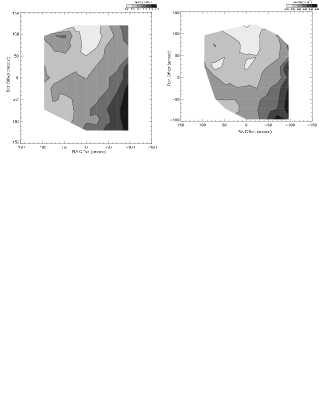
Figure 4 shows maps of the variation of the velocity of the peak in the C18O spectra. The peak velocities were determined from Gaussian fits to the line profiles. We note that a few of the C18O () and C18O () lines are flat-topped, broadened or slightly asymmetric, indicating that the lines are slightly optically thick. The two maps, however, do reveal a systematic velocity gradient increasing from upper left to lower right of the map.
To estimate the magnitude and direction of this gradient, the method of Goodman et al. (1993) was used as adapted by Lada et al. (2003). The velocity gradient is assumed to be linear when projected against the plane of the sky so the observed velocity can be related to the velocity gradient using
| (2) |
and are Right Ascension and Declination offsets in arcseconds. is the systemic velocity of the cloud and is the angle between north and the direction of the velocity gradient of magnitude . A least-squares fit of a two-dimensional plane to the observed (line center velocity) measurements of C18O (), C18O () and N2H+ () (the N2H+ () spectra contained hyperfine components, and so the isolated component at the same as the C18O () line was used in this analysis) provided estimates given in Table 2. The errors for the N2H+ are larger because there were only nine spectra measured that were useful for this purpose. The N2H+ emission was less extended than the C18O emission, therefore, more densely sampled observations are needed to confirm the estimates using the N2H+ data.
If the velocity gradient derived previously is removed, the average velocity difference between the neighboring spectra is then essentially zero ( km s-1).
3.3 Line Width Distribution
Line widths (FWHP) were determined from Gaussian fits to the observed C18O () and C18O () line profiles. The N2H+ () spectra have several hyperfine components so the line widths were determined from a Gaussian fit to the isolated () component. The resulting C18O () and C18O () line widths were found to be in a range from 0.19 to 0.35 km s-1. The N2H+ line widths were narrower, and were in the range 0.15 to 0.25 km s-1. Figure 5 shows the variation in line width of the C18O () line profiles. Because some of these lines are optically thick (see comment in § 3.2), the line widths determined from a single Gaussian fit are slightly larger than they would be if the lines were optically thin. Nevertheless, the line widths seem to increase slightly at positions away from the highly extincted region around offset (24, 0), marked with a white cross in Figure 5. This is similar to B68 where the linewidths also appeared to increase away from its center. The reason for this is not clear.
No independent measure of the kinetic temperature of FeSt 1-457 has as yet been made; a value of 10 K has therefore been adopted in this paper because data has shown that this applies to most globules and dense cores (e.g., Benson & Myers (1989)). The thermal line width, for C18O () lines was therefore calculated to be 0.123 km s-1, and for N2H+lines, 0.125 km s-1. The nonthermal contribution to the line width was then estimated using the relation,
| (3) |
where is the observed line width, is the thermal line width and is the nonthermal line width. The resulting average nonthermal line width for the C18O () lines was 0.25 km s-1, and for the N2H+ lines, 0.15 km s-1. To the extent that these lines are optically thin, this suggests that in producing the observed line profiles, nonthermal broadening mechanisms, e.g., turbulence, may play a role. There may be more turbulent motion in the outer layers probed by the C18O molecular lines than in the inner more dense layers probed by the N2H+ line. However, the corresponding one dimensional non-thermal velocity dispersions () are 0.11 and 0.06 km s-1 for the C18O and N2H+ emitting gas, respectively. These values are both subsonic, that is, less than the one dimensional sound speed (0.19 km s-1) in a 10 K gas.
3.4 Spatial Distributions of Molecular Emission and Dust Extinction
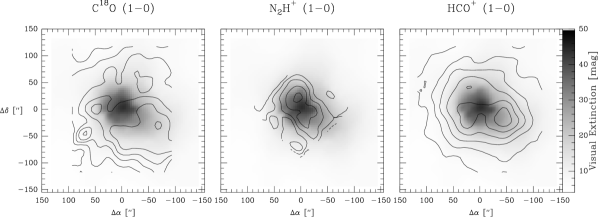
In Figure 6 we show contour maps of C18O (1–0), N2H+ (1–0), and HCO+ (1–0) integrated emission overlaid on a grey-scale map of the distribution of visual extinction. The extinction map was constructed from the data of Alves et al. (2002) and convolved with a 24 arc sec Gaussian smoothing kernel to match the resolution of the molecular-line data. The patterns seen in this figure are comparable to those seen in numerous other low-mass pre-stellar cores such as B68 or L1544 (Bergin et al. 2002; Tafalla et al. 2002). In particular, both C18O and HCO+ show emission distributions that are broader than the distribution in extinction with peaks well separated from the extinction maximum. In contrast N2H+ shows the highest degree of agreement with the dust extinction. This pattern is attributed to the freeze-out of molecules on the surfaces of cold dust grains in gas where the density exceeds 105 cm-3 (e.g. Bergin & Langer 1997; Aikawa et al. 2005). In this scenario the freeze-out of CO and its isotopologues leads to the formation of N2H+ in the dense gas dominated by freeze-out and traced by the dust. HCO+ has structure similar to CO which is not surprising since HCO+ likely forms from gas phase reactions involving CO. For a summary of this process in starless cores see Bergin & Tafalla (2007).
4 Discussion
4.1 Is FeSt 1-457 Gravitationally Bound?
One explanation for the expansion of material from FeSt 1-457 could be that the globule is simply unbound. This might be expected if the core is a transitory feature in a global turbulent sea (Ballesteros-Paredes et al., 2006). In this section, we assess this possibility by determining whether or not the core is bound. A mass for FeSt 1-457 of was derived by spatially integrating the extinction data over the area of the globule, after correcting for a significant foreground/background extinction component (AV 6 magnitudes) and an assumed distance of pc. The magnitude of the background extinction was derived from examination of the azmuthially averaged extinction profile of the globule constructed from the Alves et al. (2002) deep extinction data and is the same as that derived by Alves et al. (2007) for this core from a wavelet decomposition of their 2MASS extinction map of the Pipe cloud. The escape velocity () from FeSt 1-457 is estimated to be km s-1. The average three-dimensional velocity dispersion () of the bulk gas in the globule is 0.3-0.4 km s-1, and significantly less than the escape velocity. Thus the globule is likely to be gravitationally bound for the assumed distance of 130 pc or for any other plausible distance to the cloud. Moreover, the expansion speeds detected in the self-absorbed molecular line data ( 0.1 km s-1, see § 3.1) are also significantly less than the calculated escape speed. The expansion of the outer layers of the globlule appears not to be caused simply by evaporation of its gas as in an unbound, transient cloud.
A Jeans mass of M☉ was derived using M where is the globule’s kinetic temperature assumed to be 10 K. However, if we assume the lines are only thermally broadened, with no turbulence, then the kinetic temperature is 17 K and this doubles the Jeans mass estimate (§ 3.3). The average density = cm-3 was determined using the extinction data and a radius, cm. The radius was determined to be the point at which the radially averaged extinction profile reaches the background and marks the outer edge of the globule. Since the mass of FeSt 1-457 is comparable to its Jeans mass, we conclude that it is likely marginally stable against gravitational collapse. If thermal pressure is not the only source of internal support then the globule could be even more stable against collapse. More detailed analysis of the globule’s structure would be required to better evaluate its overall stability.
4.2 Possible Rotation?
There may be some contribution to stability of the globule from rotation. Assuming solid body rotation, , the ratio of rotational kinetic energy to gravitational energy, is given by (Goodman et al., 1993),
| (4) |
is the globule’s radius, its mass and is defined such that the moment of inertia, , and is defined such that the gravitational potential energy is . was estimated to be 0.01 for FeSt 1-457 using M cm, [1.5 km s-1 pc-1]/ (for C18O (), see Table 2), where is the inclination of the globule to the line of sight, and assuming as for a sphere with a density profile and . The contribution of rotation to the overall stability of FeSt 1-457 is therefore not significant. Note that of 0.01 is also consistent with the results of Goodman et al. (1993) that most clouds have .
4.3 Thermal vs. Turbulent Support
Thermal motions may be a significant source of pressure support for FeSt 1-457. This can be quantified by evaluating the ratio of thermal to nonthermal (turbulent) pressure given by,
| (5) |
where is the one dimensional isothermal sound speed and is the one dimensional nonthermal or turbulent velocity dispersion and . Assuming a gas temperature of 10 K, the average value of for all the C18O observations is 3.75 1.95, which may be an underestimate for those lines that may be somewhat thick. The average value of for the N2H+ data is 6.09 2.07. These values indicate that the thermal pressure significantly exceeds the turbulent pressure in the globule, and absent strong static magnetic fields, is the dominant source of internal support against gravity.
In comparing the turbulent velocity dispersion to the isothermal sound speed of 0.19 km s-1 in a 10 K molecular gas, the nonthermal motions appear to be subsonic over the surface of FeSt 1-457. If the N2H+ observations probe a deeper layer of the globule than the C18O lines, these motions are even more subsonic in the inner layers of the globule. These considerations further indicate that thermal motions provide a significant source of internal pressure.
The apparent velocity gradient in the C18O data was calculated and removed in § 3.2. The resulting average velocity difference between neighboring spectra was essentially zero ( km s-1) so there appears to be no residual scatter in peak velocities of the spectra on scale sizes comparable to the beam width that could be caused by turbulent motions. This also is consistent with significant thermal support for the globule.
4.4 Pulsating Globule?
In the absence of an embedded source in FeSt 1-457 that could cause outflow of material, it is difficult to explain the observations reported here. In the previous section we showed that the globule is gravitationally bound with thermal pressure as the dominant source of internal support. But what causes the observed expansion motions? The facts that 1- the globule is bound, 2- thermally supported and 3- does not exceed the Jean’s mass, suggest that this core is stable and not far from a state of hydrostatic equilibrium. Moreover, the expected (one-dimensional) virial velocity dispersion, , is 0.18 km s-1 and is comparable to the sound speed in a 10 K gas as would be expected for a thermally dominated, stable core. Indeed, we derive the velocity dispersion for the H2 gas in the core to be 0.21 km s-1 close to the predicted value. However, given that its outer layers are globally expanding, the globule cannot be presently in a strict equilibrium state. One viable explanation that can simultaneously account for all these facts, is that FeSt 1-457 is in dynamical oscillation around an equilibrium state. The outflowing motion is then part of a mode of oscillation such that its layers pulse in and out with a period of possibly a few hundred thousand years. We further explore this interesting possibility below.
In their study of molecular lines observed in the globule B68, Lada et al. (2003) concluded that that globule could be experiencing low order mode, nonradial oscillations of its outer layers. They suggest that the globule may have interacted with the shock of a supernova remnant, which instigated a perturbation that set at least its outer layers in oscillatory motion. Figure 7 of their paper displays the real parts of the spherical harmonic functions for a range of low order modes for an oscillating sphere. The mode corresponds closely to the pattern observed in B68. A study by Keto et al. (2006) demonstrated that linear perturbations on a pressure-bounded thermally supported sphere could indeed produce the spatial variation in profile shape observed in B68. FeSt 1-457 could also be oscillating in this mode but the geometry is such that we are looking ‘edge-on’ to the pulsating cloud. This means the mode of pulsation appears similar to the ‘breathing’ or mode, i.e., outflow motion over the whole surface of the cloud (Keto et al., 2006).
Calculations were carried out to find the modes of pulsation for an isothermal, spherical globule of gas with similar parameters (e.g., radius = cm, density = cm-3 , internal sound speed = 0.18 km s-1) as for FeSt 1-457. Small wave-like perturbations were introduced, and a differential wave equation was determined using the perturbed and unperturbed forms of its equations of state. The modes of oscillation postulated are likely to be acoustic, with relatively large amplitudes and energies, so that the linear approximation that we use for the mode frequencies is a simplification of the full dynamical problem. In this linear approximation, we ignore the gravitational modes, and find that the acoustic modes follow the dispersion relation
| (6) |
where is the frequency of the oscillations; is the unperturbed radius; are isothermal sound speeds inside and outside the globule respectively; are the unperturbed densities inside and outside the globule respectively; and, and are spherical Hankel and Bessel functions of the first kind or order , with the prime denoting differentiation with respect to the argument.
The frequency is complex and roots of the dispersion relation where has a negative imaginary part, correspond to decaying modes of oscillation. The required mode for pulsation is the least-damped mode or the mode which decays at the slowest rate; this is the mode with the smallest negative imaginary part of . This mode was calculated to be with a frequency of Hz corresponding to an oscillation period of years, comparable to the sound crossing time. It is plausible that this oscillation was excited by some transient dynamical event, such as a shock, that deposits an energy greater than about ergs, (our best estimate of the kinetic energy in coherent motions) into the outer regions of FeSt 1-457, where HCO+ molecules exhibit a coherent pattern of expansion motions. Calculations by Keto et al. (2006) show that such large amplitude motions (i.e., motions comparable to the sound speed) can cause significant geometrical distortions of a core. An important point to note is that in the high resolution extinction map of FeSt 1-457 obtained by Alves et al. (2002), a slight splitting of the core’s central regions is visible. This splitting could be another manifestation of an mode of oscillation.
FeSt 1-457 is situated in the direction of the Pipe Nebula, which lies at the edge of the Scorpio Centaurus OB Association. Onishi et al. (1999) suggested that stellar wind from the B0 type star Sco caused compression of the molecular gas, triggering star formation in the B59 cloud, situated 5 west and 3 north of FeSt 1-457. In Figure 5 of their paper, Onishi et al. (1999) show an observation of FeSt 1-457, designating it ‘Core 12’. In discussing the effect of the OB stars on the Pipe Nebula, Onishi et al. (1999) estimated that ergs has been deposited in the cloud over a period of years. If FeSt 1-457 is indeed near this OB association and was also able to intercept only 0.3% of the estimated energy deposition, then the effects of the postulated shock waves may be more widespread than previously speculated. Not only did they trigger star formation in B59, but they may have also set gaseous globules such as FeSt 1-457 and B68 (which is also part of the Pipe complex) into oscillation. More observations and comparison with theoretical models of cloud pulsation are needed to confirm this hypothesis.
4.5 Molecular Depletion
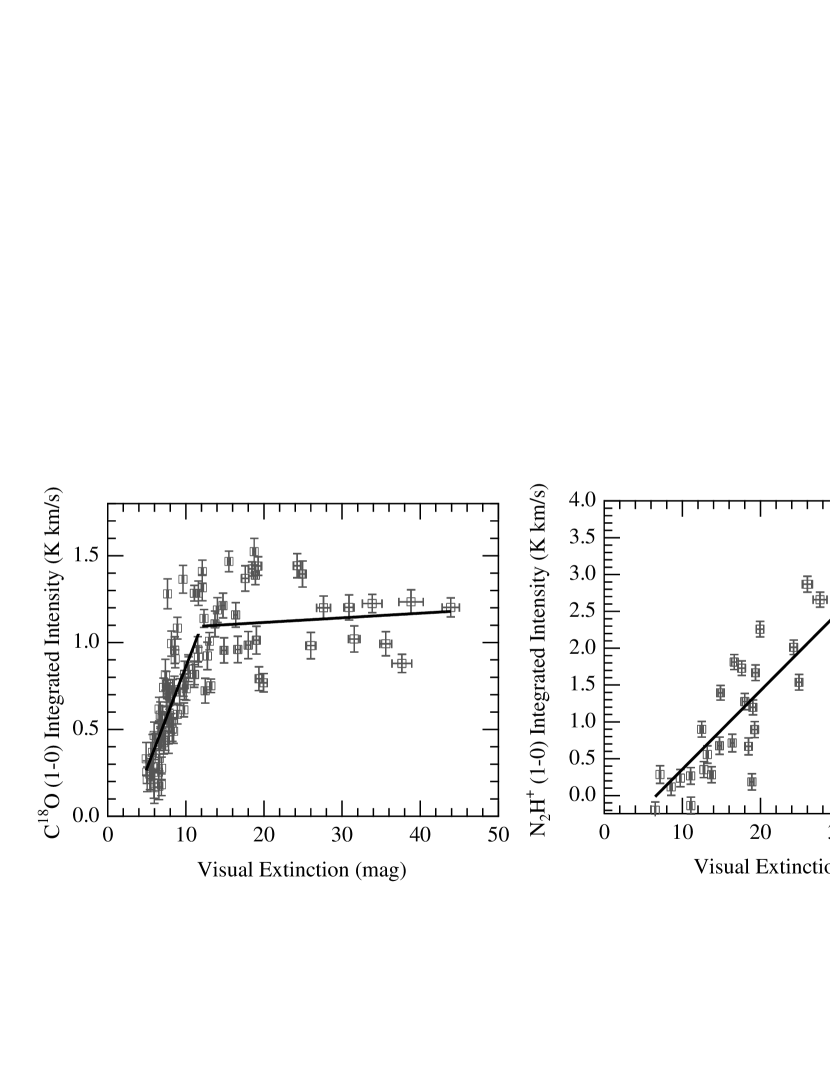
In Figure 7 we provide a direct comparison of the dependence of C18O (1–0) and N2H+ (1–0) emission with visual extinction at the same angular resolution. For both species the figures display trends that are similar to those seen in B68 by Bergin et al. (2002). In these plots, a linear correlation between integrated intensity and AV corresponds to a constant abundance throughout the cloud.
The C18O (1–0) emission shows a linear dependence with AV until mag whereupon the trend flattens. Given the drop in the the C18O integrated emission/AV relation near A mag we have fit the following function: to the data. We find an intercept of K km s-1 and a slope of
| (7) |
Thus for A 12m, where we see a significant linear correlation between gas emission and dust extinction, we estimate a C18O abundance of (relative to H2). This is comparable to that measured previously by Frerking, Langer, & Wilson (1982) of in Taurus and to that obtained from a similar comparison of extinction and CO measurements toward L 977 (Alves et al. 1999). For A the correlation is essentially flat, indicative of saturation or, as in B68, a drop in abundance towards denser regions. We can use the intercept to estimate average abundance in this gas and find that the abundance is between 20 and 40 magnitudes. Thus, we estimate that CO is depleted by a factor of 5. In §3.2 we noted that the C18O emission lines show indications of being slightly optically thick. Thus these abundance estimates are upper limits to the average depletion in the cloud.
The situation for N2H+ (1–0) in Figure 7 is more complicated. There is a rough correspondence between integrated emission and AV and it is well fit by a line with a slope of 0.1060.001 K km s-1 mag-1 and an intercept of -0.7110.031 K km s-1. This is consistent with an abundance of 10-10 relative to hydrogen. However, we cannot exclude the possibility that the trend becomes flat at mag. Fits to the intensities of the hyperfine lines of N2H+ () suggest that the total opacities are of order 12 at the emission peaks, so that all the hyperfine components are saturated. This is not the case at low AV, where the lines appear to be optically thin. Thus we believe that the line integrated intensity- correlation may be turning over at high AV as a result of saturation and rather than depletion. However, we also note that the spatial map of N2H+ in Figure 6 displays peaks northeast and southwest of the dust extinction peak and this could also be an indication of depletion of this species similar to what has been observed in B68 (Bergin et al. 2002). However, due to the high opacity of the line, it is not possible to separate the effects of spatial variations in excitation from those of column density without detailed chemical modeling.
5 Summary
High resolution radio observations were made of the globule FeSt 1-457. Molecular lines observed were CS (), HCO+ (), C18O (), C18O () and N2H+ (). The HCO+ and CS spectra showed clear self-reversed, asymmetric profiles across the face of the globule. The sense of the asymmetry is indicative of the presence of global expansion motions across the globule. These motions appear to be subsonic and significantly below the escape speed of the cloud. A search for IRAS, MSX sources and Spitzer sources showed the globule to be starless, and therefore the origins of these expansion motions is unclear.
In this paper, we propose the explanation that the globule is in a quasi-stable state near hydrodynamic equilibrium such that its outer layers are pulsating. It is possible that a passing shock wave from a nearby OB star association has excited the globule setting its outer layers into motion. Such oscillatory motion is visible in the layers on the Sun (where the fundamental radial period is 1 hour and other oscillation periods are 5 minutes) but in FeSt 1-457, the periods are thought to be of the order of hundreds of thousands of years. This is similar to what Lada et al. (2003) observed in B68. Calculations to determine the dominant mode of pulsation resulted in an mode with a frequency of Hz, and an oscillation period of years. A high resolution extinction map of FeSt 1-457 exhibits a double peak structure at the highest levels of opacity, corresponding to visual extinctions of 50 mag (Alves et al., 2002). It is possible that the proposed mode of oscillation could explain the observed splitting of the core in this column density map.
Finally, we find evidence for significant depletion of CO and perhaps HCO+ in this globule. However, N2H+ () may be undepleted to depths of about 40 magnitudes of visual extinction in the core of the cloud.
References
-
Aikawa et al. (2005)
Aikawa, Y., Herbst, E.,
Roberts, H., & Caselli, P. 2005, ApJ, 620, 330
-
Alves et al. (1999)
Alves, J. Lada, C.J., & Lada, E.A.
1999, ApJ, 515, 265
-
Alves et al. (2002)
Alves, J., Lada, C.,
Lada, E., Lombardi, M., & Bergin, E. A. 2002, in Proceedings of the
ESO Workshop Held in Garching, Germany, April, 24-27, 2001, ESO
Astrophysics Symposia, ed. J. F. Alves and M. J. McCaughrean (Berlin/Heidelberg: Springer-Verlag), 37
-
Alves et al (2007)
Alves, J., Lombardi, M. & Lada, C.J. 2007,
A&A, 462, L17
-
Ballesteros-Paredes et al. (2006)
Ballesteros-Paredes,
J., Klessen, R. S., Mac Low, M. -M., & Vázquez-Semadeni, E. 2006,
in Proceedings of “Protostars and Planets V”, Hilton
Waikoloa Village, Hawai’i, October 25-28, 2005, ed. B. Reipurth,
D. Jewitt, and K. Keil (Tucson: University of Arizona Press),
arXiv:astro-ph/0603357
-
Benson & Myers (1989)
Benson, P. J., & Myers,
P. C. ApJS, 71, 89
-
Bergin & Tafalla (2007)
Bergin, E. A., &
Tafalla, M. 2007, ARA&A, in press
-
Bergin et al. (2002)
Bergin, E. A., Alves,
J.,
Huard, T., & Lada, C. J. 2002, ApJ, 570, L101
-
Bergin & Langer (1997)
Bergin, E. A., & Langer,
W. D. ApJ, 486, 316
-
Clarke & Pringle (1997)
Clarke, C. J., & Pringle, J. E.
1997, MNRAS, 288, 674
-
Evans (2002)
Evans, N. J., II. 2001, in
Proceedings of “Chemistry as a Diagnostic of Star
Formation”, University of Waterloo, Canada, August 21-23, 2002,
ed. Charles L. Curry & Michel Fich (Ottawa: NRC Press) 27,
arXiv:astro-ph/0211526
-
Feitzinger & Stüwe (1984)
Feitzinger, J. V., &
Stüwe, J. A. 1984, Astron. Astrophys. Suppl. Ser., 58, 385
-
Frerking et al. (1982)
Frerking, M. A.,
Langer, W. D., & Wilson, R. W. 1982, ApJ, 262, 590
-
Goodman et al. (1993)
Goodman, A. A., Benson,
P. J., Fuller, G. A., & Myers, P. C. 1993, ApJ, 406, 528
-
Gregersen et al. (1997)
Gregersen, E. M., Evans, N. J., II.,
Zhou, S., & Choi, M. 1997, ApJ, 484, 256
-
Gregersen & Evans (2000)
Gregersen, E. M.& Evans, N. J.,
II. 2000, ApJ, 538, 260
-
Kandori et al. (2005)
Kandori, R., Nakajuma, N.,
Motohide, T., Tatematsu, K., Aikawa, Y., et al. 2005, ApJ, 130, 2166
-
Keto et al. (2004)
Keto, Rybicki, G. B., Bergin,
E. A., & Plume, R. 2004, ApJ, 613, 335
-
Keto & Field (2005)
Keto, E., & Field, G. 2005,
ApJ, 635, 1151
-
Keto et al. (2006)
Keto, E., Broderick,
A. E., Lada, C. J., & Narayan, R. 2006, ApJ, 652, 1366
-
Lada et al. (2003)
Lada, C. J., Bergin, E. A., Alves, J. F.,
& Huard, T. L. 2003, ApJ, 586, 286
-
Lee et al. (1999)
Lee, C. W., Myers, P. C., & Tafalla, M.
1999, ApJ, 526, 788
-
Lee et al. (2001)
Lee, C. W., Myers, P. C., & Tafalla, M.
2001, ApJS, 136, 703
-
Lombardi et al. (2006)
Lombardi, M., Alves,
J., & Lada, C. J. 2006, A&A, 454, 781
-
Mardones et al. (1997)
Mardones, D., Myers, P. C., Wilner, D.
J., Bachiller, R., & Garay, G. 1997, ApJ, 489, 719
-
Matsumoto & Hanawa (2003)
Matsumoto, T., & Hanawa, T.
2003, ApJ, 595, 913
-
Myers et al. (1996)
Myers, P. C., Mardones, D., Tafalla, M.,
Williams, J. P., & Wilner, D. J. 1996, ApJ, 465, L133
-
Onishi et al. (1999)
Onishi, T., Kawamura, A., Abe, R.,
Yamaguchi, N., Saito, H., Moriguchi, Y., Mizuno, A., Ogawa, H., & Fukui, Y.
1999, PASJ, 51, 871
-
Redman et al. (2004)
Redman, M., P., Keto, E.,
Rawlings, J. M. C., & Williams, D. A. 2004, MNRAS, 352, 1365
-
Tafalla et al. (2002)
Tafalla, M., Myers, P. C.,
Caselli, P., Walmsley, C. M., & Comito, C. 2002, ApJ, 569, 815
- Ungerechts et al. (1997) Ungerechts, H., Bergin, E. A., Goldsmith, P. F., Irvine, W. M., Schloerb, F. P., & Snell, R. L. 1997, ApJ, 482, 245


| Line | aaLine rest frequency | HPBWbbHalf power beam width | ccVelocity resolution |
|---|---|---|---|
| (GHz) | () | (km s-1) | |
| CS () | 97.980968 | 25 | 0.030 |
| HCO+ () | 89.188512 | 28 | 0.033 |
| C18O () | 109.78218 | 22 | 0.027 |
| C18O () | 219.560319 | 11 | 0.013 |
| N2H+ () | 93.173178 | 26 | 0.031 |
| Line | bbSystemic velocity | ccMagnitude of velocity gradient | at 160 pc | ddDirection of velocity gradient measured East of North |
|---|---|---|---|---|
| (km s-1) | (m s-1 arcsec-1) | (km s-1 pc-1) | () | |
| C18O () | 1.5 | |||
| C18O () | 1.4 | |||
| N2H+ () | 2.3 |