Information flow and optimization in transcriptional control
Abstract
In the simplest view of transcriptional regulation, the expression of a gene is turned on or off by changes in the concentration of a transcription factor (TF). We use recent data on noise levels in gene expression to show that it should be possible to transmit much more than just one regulatory bit. Realizing this optimal information capacity would require that the dynamic range of TF concentrations used by the cell, the input/output relation of the regulatory module, and the noise levels of binding and transcription satisfy certain matching relations. This parameter–free prediction is in good agreement with recent experiments on the Bicoid/Hunchback system in the early Drosophila embryo, and this system achieves of its theoretical maximum information transmission.
Cells control the expression of genes in part through transcription factors, proteins which bind to particular sites along the genome and thereby enhance or inhibit the transcription of nearby genes (Fig 1). We can think of this transcriptional control process as an input/output device in which the input is the concentration of transcription factor and the output is the concentration of the gene product. Although this qualitative picture has been with us for roughly forty years jacob+monod , only recently have there been quantitative measurements of in vivo input/output relations and of the noise in output level when the input is fixed elowitz+al_02 ; ozbudak+al_02 ; blake+al_03 ; setty+al_03 ; raser+oshea_04 ; rosenfeld+al_05 ; pedraza+oudenaarden_05 ; golding+al_05 ; kuhlman+al_07 ; gregor+al_06b . Because these input/output relations have a limited dynamic range, noise limits the “power” of the cell to control gene expression levels. In this paper, we quantify these limits and derive the strategies that cells should use to take maximum advantage of the available power. We show that, to make optimal use of its regulatory capacity, cells must achieve the proper quantitative matching among the input/output relation, the noise level, and the distribution of transcription factor concentrations used during the life of the cell. We test these predictions against recent experiments on the Bicoid and Hunchback morphogens in the early Drosophila embryo gregor+al_06b , and find that the observed distributions have a nontrivial structure which is in good agreement with theory, with no adjustable parameters. This suggests that, in this system at least, cells make nearly optimal use of the available regulatory capacity and transmit substantially more than the simple on/off bit that might suffice to delineate a spatial expression boundary.
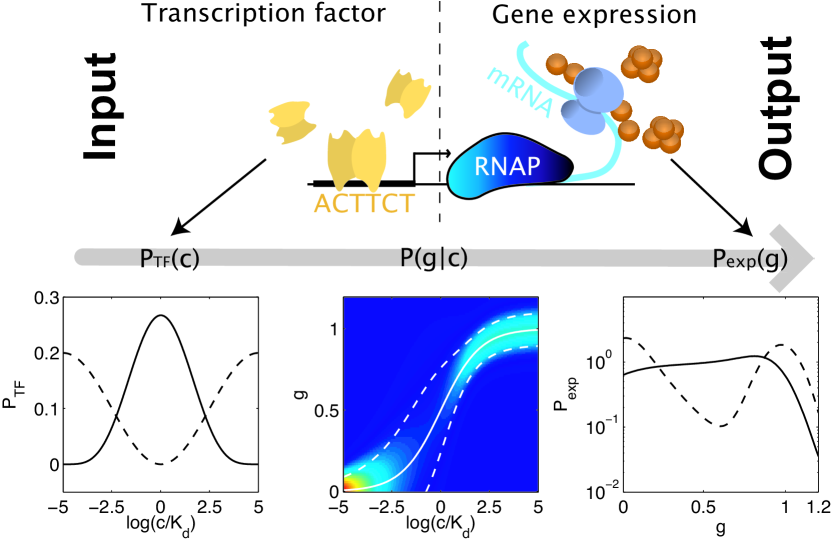
Gene expression levels () change in response to changes in transcription factor (TF) concentration (). These changes often are summarized by an input/output relation in which the mean expression level is plotted as a function of TF concentration (Fig 1). The average relationship is a smooth function but, because of noise, this does not mean that arbitrarily small changes in input transcription factor concentration are meaningful for the cell. The noise in expression levels could even be so large that reliable distinctions can only be made between (for example) “gene on” at high TF concentration and “gene off” at low TF concentration. To explore this issue, we need to quantify the number of reliably distinguishable regulatory settings of the transcription apparatus, a task to which Shannon’s mutual information shannon48 ; cover+thomas is ideally suited. While there are many ways to associate a scalar measure of correlation or control with a joint distribution of input and output signals, Shannon proved that mutual information is the only such quantity that satisfies certain plausible general requirements, independent of the details of the underlying distributions. Mutual information has been successfully used to analyze noise and coding in neural systems spikes , and it is natural to think that it may be useful for organizing our understanding of gene regulation; see also Ref ziv+al_06 .
Roughly speaking, the mutual information between TF concentration and expression level counts the (logarithm of the) number of distinguishable expression levels achieved by varying . If we measure the information in bits, then
| (1) |
where is the distribution of TF concentrations the cell generates in the course of its life, is the distribution of expression levels at fixed , and is the resulting distribution of expression levels,
| (2) |
The distribution, , of expression levels at fixed transcription factor concentration describes the physics of the regulatory element itself, from the protein/DNA interaction, to the rates of protein synthesis and degradation; this distribution describes both the mean input/output relation and the noise fluctuations around the mean output. The information transmission, or regulatory power, of the system is not determined by alone, however, but also depends on the distribution, , of transcription factor “inputs” that the cell uses, as can be seen from Eq (1). By adjusting this distribution to match the properties of the regulatory element, the cell can maximize its regulatory power.
Matching the distribution of inputs to the (stochastic) input/output relation of the system is a central concept in information theory cover+thomas , and has been applied to the problems of coding in the nervous system. For sensory systems, the distribution of inputs is determined by the natural environment, and the neural circuitry can adapt, learn or evolve (on different times scales) to adjust its input/output relation. It has been suggested that maximizing information transmission is a principle which can predict the form of this adaptation barlow_61 ; laughlin_81 ; atick+redlich_90 ; brenner_00 . In transcriptional regulation, by contrast, it seems more appropriate to regard the input/output relation as fixed and ask how the cell might optimize its regulatory power by adjusting the distribution of TF inputs.
It is difficult to make analytic progress in the general calculation of mutual information, but there is a simple and plausible approximation. The expression level at a fixed TF concentration has a mean value , which we can plot as an input/output relation (Fig 1). Let us assume that the fluctuations around this mean are Gaussian with a variance which will itself depend on the TF concentration. Formally this means that
| (3) |
Further let us assume that the noise level is small. Then we can expand all of the relevant integrals as a power series in the magnitude of :
| (4) | |||||
where are terms that vanish as the noise level decreases and is the probability distribution for the average levels of expression. We can think of this as the distribution that the cell is “trying” to generate, and would generate in the absence of noise:
| (5) | |||||
| (6) |
where is the TF concentration at which the mean expression level is ; similarly, by we mean evaluated at .
We now can ask how the cell should adjust these distributions to maximize the information being transmitted. In the low-noise approximation summarized by Eq (4), maximizing poses a variational problem for whose solution has a simple form:
| (7) | |||||
| (8) |
This result captures the intuition that effective regulation requires preferential use of signals that have high reliability or low variance— is large where is small. The actual information transmitted for this optimal distribution can be found by substituting into Eq (4), with the result .
Although we initially formulated our problem as one of optimizing the distribution of inputs, the low noise approximation yields a result [Eq (7)] which connects the optimal distribution of output expression levels to the variances of the same quantities, sampled across the life of a cell as it responds to natural variations in its environment. To the extent that the small noise approximation is applicable, data on the variance vs mean expression thus suffice to calculate the maximum information capacity; details of the input/output relation, such as its degree of cooperativity, do not matter except insofar as they leave their signature on the noise.
Recent experiments provide the data for an application of these ideas. Elowitz and coworkers have measured gene expression noise in a synthetic system, placing fluorescent proteins under the control of a lac–repressible promoter in E. coli elowitz+al_02 . Varying the concentration of an inducer, they determined the intrinsic variance of expression levels across a bacterial population as a function of mean expression level. Their results can be summarized as , where the expression level is normalized to have a maximum mean value of , and the constants are and . Across most of the dynamic range (), the small noise approximation should be valid and, as discussed above, knowledge of alone suffices to compute the optimal information transmission. We find bits: rather than being limited to on/off switching, these transcriptional control systems could in principle specify distinguishable levels of gene expression! It is not clear whether this capacity, measured in an engineered system, is available to or used by E. coli in its natural environment. The calculation does demonstrate, however, that optimal information transmission values derived from real data are more than one bit, but perhaps small enough to provide significant constraints on regulatory function.
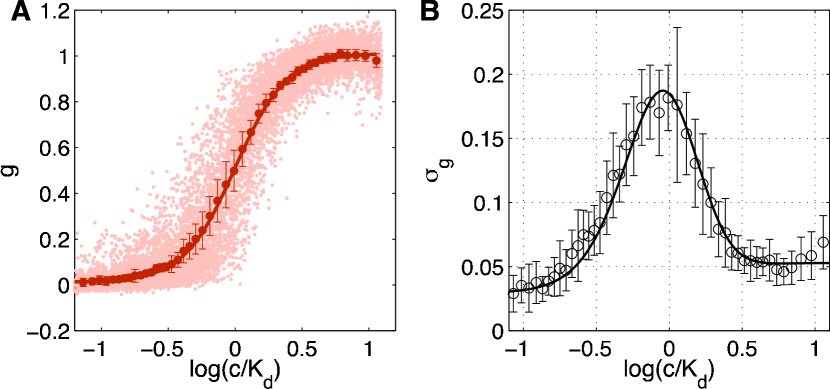
When the noise is not small, no simple analytic approaches are available. On the other hand, so long as is known explicitly, our problem is equivalent to one well–studied in communication theory, and efficient numerical algorithms are available for finding the input distribution that optimizes the information defined in Eq (1) blahut . In general we must extract from experiment and, to deal with finite data, we will assume that it has the Gaussian form of Eq (3). then is completely determined by measuring just two functions of : the mean input/output relation and the output variance . The central point is that, in the general case, solving the information optimization problem requires only empirical data on the input/output relation and noise.
The initial events of pattern formation in the embryo of the fruit fly Drosophila provide a promising testing ground for the optimization principle proposed here. These events depend on the establishment of spatial gradients in the concentration of various morphogen molecules, most of which are transcription factors wolpert_69 ; lawrence_92 . To be specific, consider the response of the hunchback (Hb) gene to the maternally established gradient of the transcription factor Bicoid (Bcd) driever+nusslein-volhard_88a ; driever+nusslein-volhard_88b ; driever+nusslein-volhard_89 ; struhl+al_89 . A recent experiment reports the Bcd and Hb concentrations in thousands of individual nuclei of the Drosophila embryo, using fluorescent antibody staining gregor+al_06b ; the results can be summarized by the mean input/output relation and noise level shown in Fig 2. These data can be understood in some detail on the basis of a simple physical model tkacik+al_07 , but here we use the experimental observations directly to make phenomenological predictions about maximum available regulatory power and optimal distribution of expression levels.
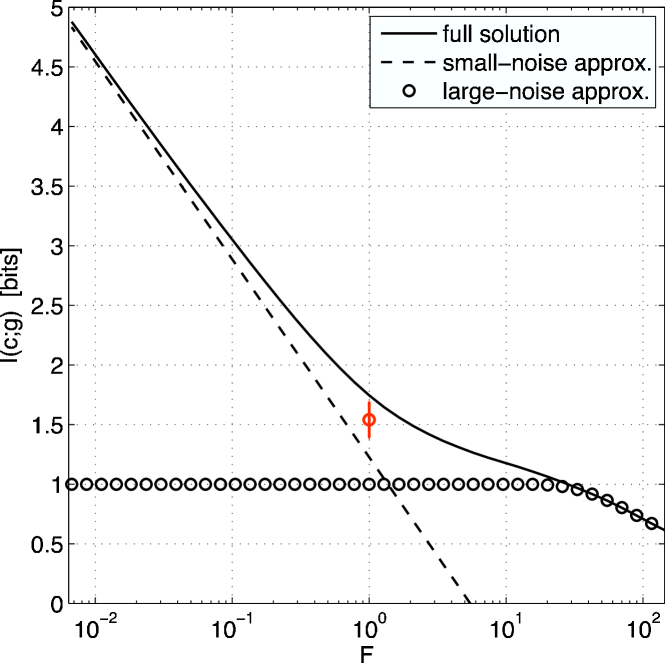
Given the measurements of the mean input/output relation and noise shown in Fig 2, we can calculate the maximum mutual information between Bcd and Hb concentrations by following the steps outlined above; we find . To place this result in context, we imagine a system that has the same mean input/output relation, but the noise variance is scaled by a factor , and ask how the optimal information transmission depends on . This is not just a mathematical trick: for most physical sources of noise, the relative variance is inversely proportional to the number of molecules, and so scaling the expression noise variance down by a factor of ten is equivalent to assuming that all relevant molecules are present in ten times as many copies. We see in Fig 3 that there is a large regime in which the regulatory power is well approximated by the small noise approximation. In the opposite extreme, at large noise levels, we expect that there are (at best!) only two distinguishable states of high and low expression, so that our problem approaches the asymmetric binary channel Silverman_55 . The exact result interpolates smoothly between these two limiting cases with the real system () lying closer to the small noise limit, but deviating from it significantly.
In the embryo, maximizing information flow from transcription factor to target gene has a very special meaning. Cells acquire “positional information,” and thus can take actions which are appropriate to their position in the embryo, by responding to the local concentration of morphogen molecules wolpert_69 . In the original discussions, “information” was used colloquially. But in the simplest picture of Drosophila development lawrence_92 ; rivera-pomar+jackle_96 , information in the technical sense really does flow from physical position along the anterior–posterior axis to the concentration of the primary maternal gradients (such as Bcd) to the expression level of the gap genes (such as Hb). Maximizing the mutual information between Bcd and Hb thus maximizes the positional information that can be carried by the Hb expression level.
More generally, rather than thinking of each gap gene as having its own spatial profile, we can think of the expression levels of all the gap genes together as a code for the position of each cell. In the same way that the four bases (two bits) of DNA must code in triplets in order to represent arbitrary sequences of 20 amino acids, we can ask how many gap genes would be required to encode a unique position in the rows of nuclei along the anterior–posterior axis. If the regulation of Hb by Bcd is typical of what happens at this level of the developmental cascade, then each letter of the code is limited to less than two bits () of precision; since , the code would need to have at least four letters. It is interesting, then, to note that there are four known gap genes—hunchback, krüppel, giant and knirps rivera-pomar+jackle_96 —which provide the initial readout of the maternal anterior–posterior gradients.
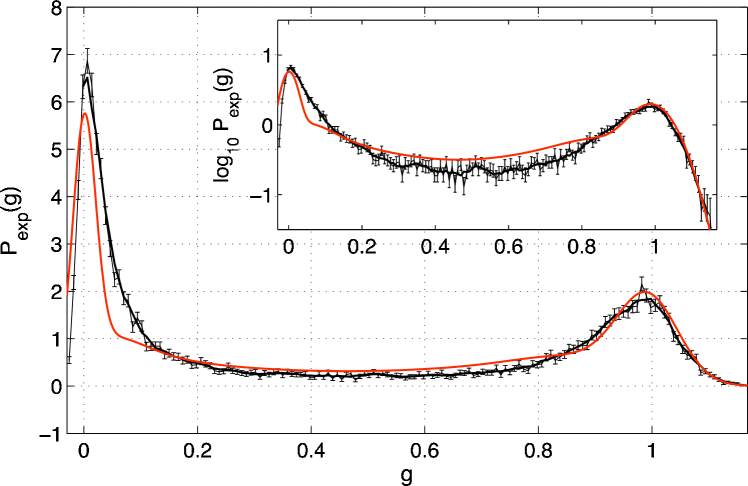
Instead of plotting Hunchback expression levels vs either position or Bcd concentration, we can ask about the distribution of expression levels seen across all nuclei, , as shown in Fig 4. The distribution is bimodal, so that large numbers of nuclei have near zero or near maximal Hb, consistent with the idea that there is an expression boundary—cells in the anterior of the emrbyo have Hb “on” and cells in the posterior have Hb “off.” But intermediate levels of Hunchback expression also occur with nonzero probability, and the overall distribution is quite smooth. We can compare this experimentally measured distribution with the distribution predicted if the system maximizes information flow, and we see from Fig 4 that the agreement is quite good. The optimal distribution reproduces the bimodality of the real system, hinting in the direction of a simple on/off switch, but also correctly predicts that the system makes use of intermediate expression levels. From the data we can also compute directly the mutual information between Bcd and Hb levels, and we find , or () of the theoretical maximum.
The agreement between the predicted and observed distributions of Hunchback expression levels is encouraging. We note, however, some caveats. Bicoid has multiple targets and many of these genes have multiple inputs Espinosa_05 , so to fully optimize information flow we need to think about a more complex problem than the single input, single output system considered here. Measurement of the distribution of expression levels requires a fair sampling of all the nuclei in the embryo, and this was not the intent of the experiments of gregor+al_06b . Similarly, the theoretical predictions depend somewhat on the behavior of the input/output relation and noise at low expression levels, which are difficult to characterize experimentally, as well as the (possible) deviations from Gaussian noise. A complete test of our theoretical predictions will thus require a new generation of experiments.
In summary, the functionality of a transcriptional regulatory element is determined by a combination of its input/output relation, the noise level, and the dynamic range of transcription factor concentrations used by the cell. In parallel to discussions of neural coding laughlin_81 ; brenner_00 , we have suggested that organisms can make maximal use of the available regulatory power by achieving consistency among these three different ingredients; in particular, if we view the input/output relation and noise level as fixed, then the distribution of transcription factor concentrations or expression levels is predicted by the optimization principle. Although many aspects of transcriptional regulation are well studied, especially in unicellular organisms, these distributions of protein concentrations have not been investigated systematically. In embryonic development, by contrast, the distributions of expression levels can literally be read out from the spatial gradients in morphogen concentration. We have focused on the simplest possible picture, in which a single input transcription factor regulates a single target gene, but nonetheless find encouraging agreement between the predictions of our optimization principle and the observed distribution of the Hunchback morphogen in Drosophila. We emphasize that our prediction is not the result of a model with many parameters; instead we have a theoretical principle for what the system ought to do so as to maximize its performance, and no free parameters.
References
- (1) F Jacob & J Monod, Genetic regulatory mechanisms in the synthesis of proteins. J. Mol. Biol. 3, 318–356 (1961).
- (2) MB Elowitz, AJ Levine, ED Siggia & PD Swain, Stochastic gene expression in a single cell. Science 297, 1183 (2002).
- (3) E Ozbudak, M Thattai, I Kurtser, AD Grossman & A van Oudenaarden, Regulation of noise in the expression of a single gene. Nature Gen 31, 69–73 (2002).
- (4) WJ Blake, M Kaern, CR Cantor & JJ Collins, Noise in eukaryotic gene expression. Nature 422, 633–637 (2003).
- (5) Y Setty, AE Mayo, MG Surette & U Alon, Detailed map of a cis-regulatory input function. Proc Nat’l Acad Sci (USA) 100, 7702–7707 (2003).
- (6) JM Raser & EK O’Shea, Control of stochasticity in eukaryotic gene expression. Science 304, 1811–1814 (2004).
- (7) N Rosenfeld, JW Young, U Alon, PS Swain & MB Elowitz, Gene regulation at the single cell level. Science 307, 1962–1965 (2005).
- (8) JM Pedraza & A van Oudenaarden, Noise propagation in gene networks. Science 307, 1965–1969 (2005).
- (9) I Golding, J Paulsson, SM Zawilski & EC Cox, Real–time kinetics of gene activity in individual bacteria. Cell 123, 1025–1036 (2005).
- (10) T Kuhlman, Z Zhang, MH Saier Jr & T Hwa, Combinatorial transcriptional control of the lactose operon of Escherichia coli. Proc Nat’l Acad Sci (USA) 104, 6043–6048 (2007).
- (11) T Gregor, DW Tank, EF Wieschaus & W Bialek, Probing the limits to positional information. Cell in press (2007).
- (12) CE Shannon, A mathematical theory of communication, Bell Sys. Tech. J. 27, 379–423 & 623–656 (1948). Reprinted in CE Shannon & W Weaver, The Mathematical Theory of Communication (University of Illinois Press, Urbana, 1949).
- (13) TM Cover & JA Thomas, Elements of Information Theory (John Wiley, New York, 1991).
- (14) F Rieke, D Warland, R de Ruyter van Steveninck & W Bialek, Spikes: Exploring the Neural Code (MIT Press, Cambridge, 1997).
- (15) E Ziv, I Nemenman & C Wiggins, Optimal signal processing in small stochastic biochemical networks. arXiv:q-bio.MN/0612041 (2006).
- (16) HB Barlow, Possible principles underlying the transformation of sensory messages. In Sensory Communication, W Rosenblith, ed, pp 217–234 (MIT Press, Cambridge, 1961).
- (17) SB Laughlin, A simple coding procedure enhances a neuron’s information capacity. Z Naturforsch 36c, 910–912 (1981).
- (18) JJ Atick & AN Redlich, Towards a theory of early visual processing. Neural Comp 2, 308–320 (1990).
- (19) N Brenner, W Bialek & R de Ruyter van Steveninck, Adaptive rescaling optimizes information transmission. Neuron 26, 695–702 (2000).
- (20) RE Blahut, Computation of channel capacity and rate–distortion functions. IEEE Trans Info Th 4, 460–473 (1972).
- (21) L Wolpert, Positional information and the spatial pattern of cellular differentiation. J Theor Biol 25, 1–47 (1969).
- (22) PA Lawrence, The Making of a Fly: The Genetics of Animal Design (Blackwell, Oxford, 1992).
- (23) W Driever & C Nüsslein–Volhard, A gradient of bicoid protein in Drosophila embryos. Cell 54, 83–93 (1988).
- (24) W Driever & C Nüsslein–Volhard, The bicoid protein determines position in the Drosophila embryo. Cell 54, 95–104 (1988).
- (25) W Driever & C Nüsslein–Volhard, The Bicoid protein is a positive regulator of hunchback transcription in the early Drosophila embryo. Nature 337, 138–143 (1989).
- (26) G Struhl, K Struhl & PM Macdonald, The gradient morphogen Bicoid is a concentration–dependent transcriptional activator. Cell 57, 1259–1273 (1989).
- (27) G Tkačik, T Gregor & W Bialek, The role of input noise in transcriptional regulation. arXiv:q-bio.MN/0701002 (2007).
- (28) R Silverman, On binary channels and their cascades. IEEE Trans Info Th 1, 19–27 (1955)
- (29) R Rivera–Pomar & H Jäckle, From gradients to stripes in Drosophila embryogenesis: Filling in the gaps. Trends Gen 12, 478–483 (1996).
- (30) A Ochoa–Espinosa et al, The role of binding site cluster strength in Bicoid-dependent patterning in Drosophila. Proc Nat’l Acad Sci USA, 102, 4960–4965 (2005).
We thank T Gregor, DW Tank & EF Wieschaus for many helpful discussions, as well as for sharing the raw data from Ref gregor+al_06b . This work was supported in part by NIH grants P50 GM071508 and R01 GM077599, by the Burroughs Wellcome Fund Program in Biological Dynamics (GT) and by US Department of Energy grant DE-FG02-91ER40671 (CC).