Thermodynamics of an Accretion Disk Annulus with Comparable Radiation and Gas Pressure
Abstract
We explore the thermodynamic and global structural properties of a local patch of an accretion disk whose parameters were chosen so that radiation pressure and gas pressure would be comparable in magnitude. Heating, radiative transport, and cooling are computed self-consistently with the structure by solving the equations of radiation MHD in the shearing-box approximation. Using a fully 3-d and energy-conserving code, we compute the structure and energy balance of this disk segment over a span of more than forty cooling times. As is also true when gas pressure dominates, the disk’s upper atmosphere is magnetically-supported. However, unlike the gas-dominated case, no steady-state is reached; instead, the total (i.e., radiation plus gas) energy content fluctuates by factors of 3–4 over timescales of several tens of orbits, with no secular trend. Because the radiation pressure varies much more than the gas pressure, the ratio of radiation pressure to gas pressure varies over the range –2. The volume-integrated dissipation rate generally increases with increasing total energy, but the mean trend is somewhat slower than linear, and the instantaneous dissipation rate is often a factor of two larger or smaller than the mean for that total energy level. Locally, the dissipation rate per unit volume scales approximately in proportion to the current density; the time-average dissipation rate per unit mass is proportional to , where is the horizontally-averaged mass column density to the nearer of the top or bottom surface. As in our earlier study of a gas-dominated shearing-box, we find that energy transport is completely dominated by radiative diffusion, with Poynting flux carrying less than of the energy lost from the box.
1 Introduction
In the years since the initial recognition that magneto-rotational instability (MRI) is the key to angular momentum transport, and therefore mass inflow, through accretion disks, simulations of accretion dynamics have become ever more sophisticated (e.g., Hawley & Balbus 1991; Stone et al. 1996; Brandenburg et al. 1995; Miller & Stone 2000; Hawley & Krolik 2001; De Villiers et al. 2003; McKinney & Gammie 2004). However, although it has long been understood that dissipation is inextricably tied to accretion (Novikov & Thorne 1973) and radiative cooling is what makes accretion astronomically interesting, nearly all these calculations have sidestepped a crucial physical issue: disk thermodynamics.
This neglect has numerous consequences: The temperature of gas in the disk is unphysical, making the computed gas pressure fictitious. In fact, estimates based on dimensional analysis (Shakura & Sunyaev 1973) suggest that the most luminous regions of accretion disks around neutron stars and black holes are dominated by radiation pressure. The equation of state in these conditions therefore depends in an essential way on both the heating–cooling balance of the gas and on the diffusion of radiation. If the local pressure is wrong, so are any phenomena involving compressibility, for example, magnetosonic waves. Moreover, as pointed out by Shakura & Sunyaev (1976), there are reasons to think that those regions of the disk in which radiation pressure dominates gas pressure are thermally unstable. If so, neglect of thermodynamics and radiation forces means that a major dynamical effect has been omitted. Lastly, we are primarily interested in accretion disks because they can be so luminous, but ignoring radiative cooling means that no connection between accretion and its observational manifestations can be drawn.
It is for all these reasons that we have embarked upon a program to introduce self-consistent simulations of accretion dynamics including dissipation and radiation effects. In Turner et al. (2003), we explored the local dynamical consequences of radiation forces on the development of the MRI. Turner (2004) published an illustrative calculation of a vertically-stratified disk segment, but with only partial energy conservation. Complete energy conservation in this context was achieved for the first time in the first paper in this series (Hirose et al. 2006), where we presented a study of a shearing-box model of an accretion disk annulus in which the radiation pressure was about of the gas pressure. Here we take the next step by examining an annulus chosen to have the radiation pressure comparable to the gas pressure. In this paper, we concentrate on the thermodynamic properties of this annulus; in a companion paper (Blaes et al. 2007), we focus on its surface structure and dynamics in the vicinity of the photosphere.
The primary reason we chose to look at this intermediate case before plunging into the fully radiation-dominated regime is the possibility of thermal instability when the radiation pressure is truly dominant. Assuming that the vertically-integrated dissipation rate is directly proportional to the vertically-integrated total pressure, Shakura & Sunyaev (1976) predicted linear instability when the radiation pressure is more than 0.6 of the total pressure. It will therefore be very useful to gather data capable of testing that fundamental assumption about the relation between dissipation rate and pressure.
There is also a second reason to study the borderline case first. In order to determine by numerical simulation whether any sort of equilibrium is stable or unstable requires construction of an initial state that is in equilibrium with respect to the relevant physical processes. When the issue is dynamical stability, finding such an equilibrium is usually straightforward, because the forces can often be written as explicit functions of the state variables and position. Here, however, thermal equilibrium is the result of a balance between diffusive radiative cooling and heating due to dissipation of turbulence. Turbulent dissipation is inherently chaotic and cannot therefore be written as an explicit function of anything. If the characteristic timescale of its fluctuations were short compared to the thermal equilibration timescale, one could obtain a good approximation by averaging over these fluctuations. For MRI-driven turbulence, though, this is not the case—previous work (e.g., Hirose et al. 2006) has shown that order unity fluctuations in the global heating rate can persist for as long as 1–2 cooling times. Thus, it may be intrinsically impossible to select an initial state whose thermal properties, absent instability, would remain even approximately steady for several cooling times.
By studying a disk at the edge of what might turn out to be a thermally unstable state, we hope to avoid some of these problems. A disk segment that goes through large amplitude fluctuations without exponential runaway will allow us to explore scaling relations between thermal properties and other physical parameters. We hope, too, that the range of states exhibited in these conditions will provide guidance for choosing an initial state (or states) for future simulations of genuinely radiation-dominated shearing boxes.
2 Calculational Method
Our basic tool is the code described in Hirose et al. (2006), although we have made certain technical changes to improve efficiency. This code solves the equations of 3-d Newtonian MHD in a shearing box. In order to detect when grid-scale dissipation occurs and capture it locally into heat, equations for both internal energy and total energy are solved in parallel. Any discrepancy detected when comparing these two equations we define as “dissipation”. Because the dependent variable updates are done in an operator-split fashion, we can distinguish several subcategories. Energy differences found during the step when both the magnetic field is updated via the Faraday equation and the velocity is updated for response to force we ascribe to “numerical resistivity”; similar discrepancies discovered during the velocity updates associated with gas pressure gradients and advection we call “numerical shear viscosity”; “numerical bulk viscosity” is the dissipation associated with the artificial viscosity necessary for a proper treatment of shocks. Note that because the fluid acceleration due to magnetic forces is considered together with the change in the field itself, the term in Poynting’s Theorem automatically identically cancels. Both “numerical resistivity” and “numerical shear viscosity” arise from discretization error and round-off error, not from any explicitly physical effect. On the other hand, we expect them to be correlated in location and time with physical dissipation because numerical errors tend to be largest where the gradients are least well-resolved, and true kinetic dissipation is often associated with sharp gradients. Radiation is coupled to the gas via both Thomson scattering and free-free opacity, the latter treated in a Rosseland-mean sense. We solve the radiation transfer problem in the gray flux-limited diffusion approximation. Because we treat radiation transfer directly (albeit approximately), the equations we solve incorporate dissipative effects associated with photon diffusion such as Silk damping.
The parameters characterizing the problem are the rotation rate at the center of the box and the surface density . We choose them on the basis of a Shakura-Sunyaev disk model with central black hole mass , a guessed accretion rate that would yield a luminosity 0.1 of the Eddington rate if the efficiency were 0.1, a radius , and a guessed Shakura-Sunyaev stress ratio . For these parameters, cm and s-1. The effective temperature of such a disk segment is K. We choose a surface density of gm cm-2, the value predicted by a Shakura-Sunyaev model in the gas pressure-dominated limit. Our unit of length cm is the (half)-disk thickness in the gas pressure-dominated limit, as given in Krolik (1999). The midplane optical depth is , varying slightly due to the temperature-dependence of the free-free contribution. At all times, the opacity is dominated by Thomson scattering.
Our initial condition is in approximate hydrostatic and radiative equilibrium, based upon the assumption that the dissipation is proportional to gas density, but normalized to the total flux emitted by the disk. To construct the initial state, we first solved for the equilibrium below the photosphere, describing the radiation density by the diffusion approximation. We then matched this solution to one above the photosphere in which the flux is held constant, the density is fixed at the density floor ( the initial midplane density), and the gas temperature is set at the effective temperature. Even though this region is optically thin, in our initial condition we let the radiation energy density decline linearly with height according to .
The magnetic field in the initial state is a twisted azimuthal flux tube with uniform interior magnetic field strength, similar to the initial magnetic field geometry used in Hirose et al. (2006). The radius of the flux tube is . The maximum poloidal component of the field is one quarter the magnitude of the total magnetic field, and the initial midplane plasma (the ratio of gas plus radiation pressure to magnetic energy density) is 25.
The computational box extends from the midplane, has thickness in radius, and in the azimuthal direction. We chose this height for the box so that the disk photosphere would nearly always be found within the problem volume, but we would not waste too many cells studying regions outside the photosphere. This box is divided into 32 cells in the radial direction, 64 in the azimuthal, and 512 in the vertical direction, so that , , and .
Boundary conditions at the azimuthal extremes of the problem area are purely periodic. The inner and outer radial surfaces are matched by shearing periodic boundary conditions (Hawley et al. 1995). At the top and bottom surfaces, the boundary conditions are outflow extrapolations. As described in Hirose et al. (2006), smooth extrapolation of the electric field followed by use of the induction equation to find the magnetic field ensures that even in the ghost cells, but permits discontinuities in . In order to curtail rare (roughly once every 50–100 orbits) magnetic field discontinuities strong enough to cause a code crash, Hirose et al. found it necessary to add a small amount of artificial resistivity to the ghost cells; in this simulation, we found it necessary to extend this artificial resistivity into the cells in the problem volume near the top and bottom boundaries. As for any diffusivity, the natural unit for this resistivity is the square of the grid-scale divided by the time-step; to keep the resistivity small, we set its maximum value (achieved only at the top and bottom surfaces of the box) to
The resistivity is then tapered into the box according to:
To test whether this artificial resistivity introduces any noticeable artifacts into the results, we ran a test simulation with a similar scheme extending only half as many cells from the boundary. Starting from our primary simulation’s state at orbits, this test ran for another 55 orbits. Because of the chaotic nature of MHD turbulence, there is no reason to expect the test simulation to reproduce exactly the original one. However, they are statistically very similar. Their time-averaged density and pressure profiles, for example, are nearly identical, and the character of their volume-integrated dissipation and radiation flux fluctuations are likewise qualitatively consistent.
Roughly 10 orbits were required for the MHD turbulence to saturate and to eliminate initial transients. The simulation ended after 318 orbits. As we will show in a later section, this duration amounted to cooling times.
3 Results
3.1 Global measures of the energy budget
The easiest way to obtain an overview of the simulation’s behavior is to look at the history of the volume-integrated energy stored in gas, radiation, and magnetic field (Fig. 1). As this figure shows, although the gas internal energy varies rather little (the maximum is only the minimum), the radiation and magnetic energies vary much more: their peak/trough ratios are 5.9 and 4.8, respectively. Compared to the initial energy content of the box, the time-average is greater, but the large fluctuations make that an ill-defined number. Typical durations of radiation energy fluctuations are –50 orbits; although the magnetic energy fluctuations have some power on timescales as long as this, they also have significant variations over times as short as orbits. All the energies are closely correlated: the cross-correlation between the radiation energy and the gas internal energy peaks at essentially zero lag; the magnetic energy leads the radiation energy by orbits. Both of these facts are easily understood: the gas and the radiation are very closely coupled, equilibrating in temperature throughout most of the disk very rapidly. On the other hand, increases in radiation energy follow very closely upon increases in the magnetic field energy, as dissipation of magnetic field provides the majority of the energy available for radiation.

Despite these large amplitude variations and the fact that the radiation energy can be as much as four times the gas energy for as long as several tens of orbits, there is no long-term trend or global runaway. Rather, the system appears to go through irregular limit-cycle oscillations. There are two episodes, each 30–40 orbits long, when the radiation pressure accounts for 0.6–0.7 of the total pressure. Contrary to the prediction of Shakura & Sunyaev (1976) that a radiation pressure fraction of 0.6 is the threshold for instability, what follows both peaks in radiation/gas pressure ratio is a return to lower energy content.
A similar story is told by the history of the dissipation rate and radiation flux (Fig. 2). On timescales of orbits or more, these two are nearly indistinguishable. This is, of course, because the thermal equilibration time is roughly this long. More precisely, if we define , where and are the gas and radiation energies, respectively, and is the radiation flux, its mean value is 7.4 orbits, and it varies only within a rather restricted range: after the initial transients decay, the instantaneous value of –10 orbits except for a couple of dozen times out of the time-steps whose data we recorded; even then, the maximum excursion is only to orbits. The variations within this factor of two range appear almost completely uncorrelated with the state of the disk as defined, for example, by its total energy. Thus, the periods during which the radiation pressure satisfied the nominal thermal instability criterion lasted for –5 cooling times, roughly one -folding time for the putative instability.

In the famous ansatz of Shakura & Sunyaev (1973), both stress and dissipation are assumed to be proportional to total pressure when all quantities are vertically-integrated. We find that the stress in our simulated volume varies on the thermal timescale and in rough terms increases with increasing total pressure. However, there are many order unity departures from simple instantaneous proportionality, so that the range of variation is somewhat greater: the maximum is roughly six times as great as the minimum. The radiated flux varies in closely-corresponding fashion, producing a time-averaged flux that is greater than that associated with the initial condition. Phrasing these results in language, we find that the nominal time-averaged parameter is , but its instantaneous value ranges from –0.055.
As illustrated in Figure 3, our simulation roughly—but only roughly—reproduces the -model expectation that the dissipation rate should be proportional to total pressure at all times. Discussing this relationship in terms of total energy rather than total pressure is advantageous because it slightly simplifies a point we are about to make. In the limit of either complete gas or radiation dominance, the distinction would make no difference; here, where the two are comparable, the total pressure and total energy are almost, but not quite proportional to one another: .
Over the entire span of energies and dissipation rates sampled, the single best-fit power-law relating the two is close to linear. However, there is also clear curvature, in the sense that the slope of the dissipation rate (or stress) with respect to the total energy becomes progressively shallower with increasing total energy. In addition, despite the overall correlation, there are many order unity (factor of 2) departures from the mean trend line. Placing the data from our earlier simulation (the one published in Hirose et al. 2006) on this plot, we find that its relatively small dynamic range in total energy occupies roughly the bottom in logarithmic range shown in these data, while its dissipation rate largely overlaps the range displayed by these new data at that total energy, albeit displaced to slightly lower values.

3.2 Internal Structure
The internal profiles of density and the various pressures (gas, radiation, magnetic) vary significantly depending on the total energy content of the disk. In order to illustrate how large the contrast is, we divide the data into two groups: those times when , which we designate “high total energy” and those times when , which we designate “low total energy”. In the following, whenever we show results averaged over “times of high total energy” and “times of low total energy”, we use this definition. For maximum contrast between instantaneous properties, we will use orbits, the time of highest total energy and orbits, the time of least total energy.
We begin by showing the density profile (Fig. 4). At times of high energy content, the disk’s matter can extend to higher altitude away from the midplane. As a result, its central density falls by while the density scaleheight () increases by nearly , from to .

Not surprisingly, the pressure profiles show a similar pattern of broadening at times of high energy content (Fig. 5). At all times, the magnetic pressure is roughly constant across the middle several scale-heights, while the gas and radiation pressures are centrally peaked. Consequently, the pressure becomes magnetically-dominated at high altitude. The height of the transition point rises with increasing total pressure, from – at times of low pressure to – at times of high pressure. In the midplane, the dominant contributor to the pressure changes as a function of total energy: at low total energy, the gas pressure is greater than the radiation pressure in the midplane, whereas it is the other way around at times of high energy content. This overall pattern, in which a combination of gas and radiation pressure dominates in the central several scale-heights, while the magnetic pressure has a profile that is flat in the body of the disk but declines slowly at higher altitudes so that it dominates the regions well away from the plane, is very much like what is seen in the purely gas-dominated case (Hirose et al. 2006).


This characteristic pattern for the magnetic field strength may be related to the way the magnitude of the fastest-growing MRI wavelengths depends on height. Both for axisymmetric and nonaxisymmetric MRI, the fastest growing modes have vertical wavelengths (Kim & Ostriker 2000), provided there is some nonzero poloidal field and the equilibrium background changes only over longer scales. We find that both and the gas scale-height are very nearly constant across the central disk region within which the magnetic field varies little with height, with ratio . Here is the sound speed of acoustic waves supported by both gas and radiation pressure. Just below the layer where the magnetic field begins to decline upward, the ratio starts to increase sharply with altitude (as we discuss immediately below, radiation pressure decouples from acoustic waves as the gas density falls; if our estimate were adjusted to account for the resulting diminution of , this effect would be enhanced). This pattern may indicate where the MRI can operate successfully and where it cannot.
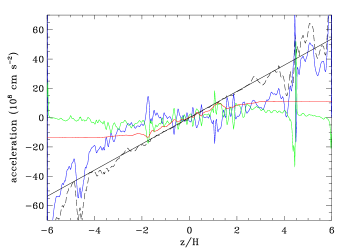
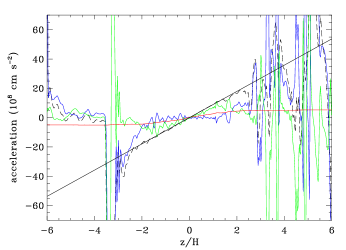
For a more detailed look at which forces support the gas, Fig. 6 shows the volume-weighted horizontally-averaged vertical force per unit mass from gas, radiation, and magnetic forces, at the highest and lowest total energy epochs. In the former case, hydrostatic balance is approximately established at all heights in the box, with magnetic forces dominating the gas and radiation pressure forces outside . In contrast, the outer regions are not in hydrostatic balance in the low energy epoch. At these times, there is no significant support against gravity for , and strong fluctuations in gas pressure and magnetic forces exist for . As can be seen from Figure 1, the two periods during which the energy content is particularly low are both relatively short-lived; the failure to achieve equilibrium is presumably due to the brevity of these episodes. During those times, matter that had formerly been at high altitude falls rapidly toward the midplane once radiation support of material closer to the midplane has been removed. Strong shocks form at intermediate altitudes where this gas strikes denser material.
In the central body of the disk, where magnetic pressure is less important than either gas or radiation pressure for support against gravity, dynamical perturbations can be understood primarily in terms of conventional fluid mechanics (as Fig. 6 shows, magnetic forces are the primary support against gravity where ). The only special complication is one due to the importance of radiation pressure: fluctuations behave differently according to whether photons can diffuse across a wavelength in a time long or short compared to a dynamical time. That the cooling time is orbits immediately implies that the diffusion time across a scale-length near the disk midplane is orbits. Because the characteristic timescale for buoyant motions is of order the orbital period (or rather longer, as shown by Fig. 7), long wavelength fluctuations of this variety near the midplane are in the long-diffusion time regime, while shorter wavelengths near the midplane and modes with all wavelengths at greater heights are in the short-diffusion time limit.
When the wavelength is long enough that the diffusion time is greater than the dynamical time, gas and radiation are closely coupled, and the effective Brunt-Väisälä frequency may be written as
| (1) |
where is the vertical component of genuine gravity, , and is Chandrasekhar’s generalized adiabatic constant,
| (2) |
On the other hand, radiation can quickly diffuse out of short wavelength fluctuations, eliminating any fluctuation in the radiation pressure on such small scales. When this is the case, buoyancy is strongly suppressed, partly because the upward radiation force partially cancels gravity, and partly because rapid thermal equilibration between gas and radiation enforces a single density for all gas parcels at a given height, independent of their initial specific entropy (Blaes & Socrates 2003). At the order of magnitude level, the growth rate of short wavelength buoyant modes is , where is the optical depth across a length . In this simulation, , so we expect such short wavelength fluctuations to play at most a minor dynamical role where the magnetic pressure is smaller than gas or radiation pressure.
Evaluating the long-wavelength in terms of horizontally-averaged quantities at individual times (as shown in Fig. 7), we find that near the midplane () at almost all times (around orbits, the time of greatest energy content, is slightly larger). In other words, in the deepest part of the disk, long wavelength dynamical perturbations are almost neutrally stable because the specific entropy is almost constant with height. At somewhat greater heights, but still within the central disk body as just defined, fluctuations with wavelengths long enough to be very optically thick can have larger and may have either sign. However, because the density falls with height, the long wavelength case applies to a smaller fraction of the range of possible wavelengths for than for . In this region, therefore, nearly all modes have very low frequencies, whether oscillatory, growing, or damped. Thus, through most of the disk body, where radiation and gas pressure combine to outweigh magnetic pressure in support against gravity, only occasionally do dynamical perturbations grow: for the most part, they are either truly or neutrally stable.
Our earlier simulation, in which radiation pressure was only times as great as the gas pressure, provides an interesting contrast: in those conditions, where radiation pressure is a minor effect, is likewise very close to zero in the inner few scale-heights, but rises smoothly toward at greater altitude. Thus, when gas pressure dominates, convectively unstable zones are still rarer than they are when gas and radiation pressure are comparable.
Because the gas and radiation pressure contributions lead to almost neutral buoyancy, magnetic forces are all that is left to drive fluctuating vertical motions in the disk body, particularly at altitudes 1– from the midplane. As has often been seen in previous simulations of stratified shearing boxes Miller & Stone (2000); Hirose et al. (2006), regions of locally strong magnetic field are generated a few scale-heights from the plane and rise another few scale-heights at a speed . Although this rise temporarily depletes the field at its altitude of origin, the field intensity is generally restored in 1–2 orbits, only to generate another rising current.
In the upper layers of the disk, where magnetic pressure predominates, the situation changes. There unstable Parker modes can become important. We discuss the dynamics of these surface layers in the companion paper.

3.3 Dissipation distributions
The vertical profile of dissipation per unit volume is also much like the gas-dominated case, provided one makes an adjustment for both the higher rate of dissipation that goes along with conditions of higher pressure and the greater thickness of the disk. Figure 8 shows this profile, averaged over the same selection of times used elsewhere in this paper for high total energy and low. At all times, the great majority of the dissipation takes place within 1.5– of the midplane, with the width increasing with total pressure. Because numerical resistivity is generally (but not always: see Fig. 10) the dominant dissipation mechanism, the characteristic scale for the dissipation profile is mostly a reflection of the scale of the magnetic field distribution (we will add further detail to this point below). Although several thousand sampled times were averaged to create the high total energy curve, its bumpiness, visible even in a logarithmic plot, demonstrates the strong intermittency of the dissipation. The small uptick in dissipation per unit volume just inside the outer boundaries is likely an artifact of the boundary conditions.

Despite the sharp fall with increasing height in the dissipation rate per unit volume, the dissipation rate per unit mass consistently rises outward (Fig. 9). This is a reflection of the fact that the dissipation profile exhibits a shallower slope than does the gas density profile. To a good approximation, , where (for , the limits on the integral are and , of course). Note that the gas density used in the column density integral is horizontally- and time-averaged in a fashion identical to that of the dissipation, selecting out those times of either particularly high or particularly low energy content. Put another way, the dissipation taking place outside a column density is , so that the total dissipation is dominated by the very optically thick central part of the disk, but a significant minority takes place relatively near the surface if distance is measured in mass units. Interestingly, unlike the distribution of dissipation per unit volume, for which there is a clear characteristic scale-height, the distribution of dissipation per unit mass displays at most only a weak signature of any special column density scale.
The fluctuations in both dissipation and density are great enough that it matters how one constructs time averages for . In Figure 9, the left-hand panel shows the time-average of the ratio of instantaneous horizontal averages of dissipation to density; the right-hand panel shows the ratio of time-averages. That is, if the instantaneous horizontal average of the dissipation per unit volume is and the instantaneous horizontal average of the gas density is , the former quantity is , while the latter quantity is . Here denotes a time-average of the quantity within angle-brackets. Near g cm-2 (generally , or the lowest region where magnetic pressure dominates gas and radiation pressure), at times of low total energy there are a few instances of such a high localized dissipation rate per unit mass that they color the entire time-average, even though they do not contribute substantially to the time-average of or separately. The origin of these episodes of exceptionally high dissipation per unit mass appears to lie in strong shocks driven by the vertical collapse of high altitude material when the radiation content has just been sharply reduced. Although the mean column density to the cells in which they take place is g cm-2, the actual column density at the time of the shock is often 2–3 orders of magnitude smaller.


As in our earlier simulation of gas-dominated conditions (Hirose et al. 2006), we find that most cells have both very low dissipation rate and very low current density. However, the total dissipation is dominated by the small number of cells with the highest dissipation rate, which tend also to have the highest current density. Roughly speaking, of the total dissipation comes from the cells with current densities above 1/3 the greatest current density found in the volume; these represent of the total number of cells.
The balance between our three different numerical dissipation mechanisms changes systematically both with total energy content and with height from the midplane. Although numerical resistivity always dominates the horizontal and time averages (ranging from 60– of the total at all heights, and taking the largest share in the disk body where the total dissipation rate is highest), the relative importance of artificial bulk viscosity, as compared to numerical viscosity, increases by almost a factor of two from the midplane to at times of high energy content and by roughly a factor of four at times of low energy content (Fig. 10). This shift signals the relative importance of shocks in the magnetically-dominated zone well away from the midplane, and also contributes to the trend toward greater dissipation per unit mass at lower column density to the surface.

Averaged over the entire simulation volume, the scaling between current density and mean dissipation rate in the simulation reported here resembles, but is slightly different from, the relation found in the gas-dominated case. We define the mean dissipation rate found at a given current density by
where is the number of grid cells having dissipation rate and current density . In the gas-dominated case, we found at moderate to high current densities (Fig. 11). Just as before, at small current density rises steeply with (roughly ), but at intermediate current levels the relation rolls over so that is approximately . Not surprisingly, given the concentration of dissipation to the central disk body, the different regions of these correlations are not equally well-sampled at all altitudes: cells in the densest part of the disk are much more likely to have high current densities—and therefore high dissipation rates—than cells at high altitude. In addition, cells with low current density near the midplane tend to have a rather greater dissipation rate than cells with the same current density nearer the disk surface.
Only subtle changes distinguish the mean current density—dissipation correlation at low total energies from those at high. When the total energy is higher, the range of current densities found extends to slightly higher values, and the mean dissipation at a given current density tends to be somewhat greater, but these contrasts are only at the tens of percent level. The slope of the dissipation–current density relationship is also slightly steeper at times of high total energy than at times of low: a linear least-squares fit to the relation over the upper factor of 50 in current density finds that the slope rises from at low total energy to at high. The main factor accounting for the greater dissipation at high energy than at low is a larger number of cells having high current densities and consequently high dissipation rates.
Although there is a clear correlation between current density and dissipation rate, the dissipation rate is by no means a function of current density alone. The rms logarithmic scatter around the mean relation corresponds to a factor of –4, declining slightly at the highest current densities.

It is interesting to contrast these results to those that might have been expected based on the thought, frequently voiced in older studies of accretion disk physics, that the stress is produced by some sort of dissipation process akin to conventional viscosity. If that were the case, the local dissipation rate and the local stress should be proportional to one another with a fixed ratio. Correlated MHD turbulence, the mechanism now known to produce the bulk of the stress in accretion disks, is not immediately dissipative, and therefore does not necessarily have this property. Our data strongly confirm the essentially non-dissipative nature of the stress, as seen in Figure 12. Although in the disk body the horizontally- and time-averaged dissipation and stress are related approximately in the way predicted for dissipative stress mechanisms (even after averaging, the ratio of dissipation to stress is about 10– less than this model would predict), their relationship changes strikingly with increasing distance from the midplane. Near the disk photosphere, their mean ratio is a full order of magnitude greater. The origin of this shift most likely lies in the increasing importance of shocks in that magnetically-dominated region (see the earlier discussion in this subsection and § 5 in the companion paper). Moreover, there is little difference between times of high and low energy content in the way the relative magnitudes of stress and dissipation change with altitude. The stress and dissipation data from the gas pressure-dominated simulation reported in Hirose et al. (2006) also show a very similar pattern.

As a final remark in this section, we caution that the mechanism of this dissipation is truly numerical, and not physical. Its association with current density might best be interpreted as an association with regions of strong magnetic field gradients. Where gradients are strongest, numerical error is greatest when the equations are discretized on a fixed-size grid. Our claim to some fidelity to the physics is based on the fact that many genuine physical dissipation mechanisms are also stronger in regions where the gradients are large, and on the very accurate energy conservation the code provides.
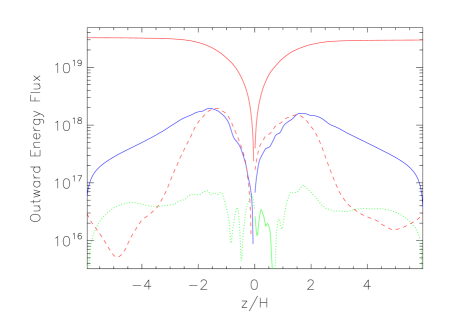
3.4 Vertical Energy Transport
Diffusive radiation flux dominates the transport of energy up and down (Fig. 13). In the spirit of our flux-limited diffusion approximation, for this discussion we label both truly diffusive radiation transport and free-streaming radiation outside the photosphere as “diffusive”. Only near are any other channels at all significant: there, advected radiative flux and Poynting flux both typically contribute of the total. At times when the energy content of the disk is rising, the high-pressure portion of the disk swells, so that the gas advects both magnetic field and radiation outward. The peak in advected radiative flux and Poynting flux occurs at because this is typically where the gradient in both magnetic field energy density and radiation energy density is greatest. Elsewhere in the disk, they and all other channels (e.g., advected gas energy flux) are very weak. In fact, through most of the disk, the time-averaged advected gas energy flux is inward, in contrast to all the other fluxes. Presumably, this is due to denser regions sinking, while less dense regions, perhaps with greater radiation energy density, rise. At particular instants, it is possible for Poynting flux, advected radiation flux, and advected gas energy to be comparable to diffusive radiation flux within of the midplane, but these instances are not long-lasting.
At the top and bottom boundaries, Poynting flux is the nearest competitor to diffusive radiation losses, and even it is responsible for at most (this estimate is made on the basis of the Poynting flux at in order to avoid possible artifacts due to the small artificial resistivity near the outer boundaries). If the magnetic field energy in the box were removed only by Poynting flux, it would take orbits to drain it completely. Because the magnetic field energy density can diminish on much shorter timescales (see Fig. 1), it is clear that Poynting flux plays only a minor role in determining the saturation amplitude of the magnetic field. Because magnetic flux is proportional to the square root of magnetic energy density and both quantities decrease outward, it is carried off through the outer boundaries at a somewhat greater rate (a characteristic loss time of orbits), but one that is still quite slow compared to the thermal time of orbits.
Study of the outgoing energy flux also reveals that it is systematically slightly smaller than the rate at which work is done on the radial walls. In terms of the integrated energy up to a given time, this ratio is –0.95 up to around 100 orbits, –0.99 from orbits until the end of the simulation. The reason for this small discrepancy from energy balance is, of course, that the time-averaged total energy in the volume is rather greater than in the initial condition, with the energy in the simulation volume building systematically up to the first big peak at orbits.
More interestingly, after orbits, the time-integrated dissipated energy is consistently only about 0.92–0.95 times the time-integrated outgoing flux. Because energy is conserved quite accurately in the code, this discrepancy signals that dissipation is not the only source of energy for radiation. Work can be done on the radiation pressure through bulk compression, raising its energy non-dissipatively. Similarly, compressive work done on the gas can raise its temperature, leading to a higher rate of radiation emission. These two mechanisms taken together account for 5– of the total emitted radiation.
4 Significance
4.1 Approximate linear thermal stability analysis
The crudest possible model for the thermal balance of a disk segment is
| (3) |
where is the total energy and the dissipation, both per unit area. Note that in the present context, all quantities should be regarded as time-averaged over a time-span ( orbits in this simulation) because there are sizable random fluctuations in everything over shorter times. We have already shown that is roughly with , although declines slowly as increases. As we will discuss shortly, in this simulation depends more weakly on ; we define .
Linearizing with respect to a perturbation about an equilibrium total energy per unit area , we find
| (4) |
because if the initial state was in equilibrium. Clearly, perturbations grow or decay according to whether is larger or smaller than . Over the dynamic range in spanned by our data (about a factor of four), declines with increasing energy from to .
A simple qualitative model explains why , the logarithmic derivative of with respect to , should change from being large and negative at small radiation content () to at intermediate levels (, the case treated in this simulation), to in the truly radiation-dominated limit (). Because the gas temperature is tightly coupled to the radiation temperature, the total thermal content of the disk is the sum of the two energies. Thus, the cooling time is
| (5) |
where is the radiation flux, is the characteristic thickness of the trapped radiation and is the typical optical depth photons must overcome to escape. With fixed column density, does not change. When , increasing leads to a diminishing cooling time, as the fraction of the total energy able to diffuse readily grows while the distance it needs to travel () hardly changes. In this gas-dominated regime, increasing radiation content makes cooling more rapid, enforcing thermal stability: in the extreme limit of , at fixed column density because and in hydrostatic balance. However, this trend slows when (the regime treated here), as cannot fall below unity. Formally, if is constant, as it more or less is in this simulation. Our time-averaged ratio of gas energy to radiation energy is . At the same time, in the regime treated here, where , increases slowly as the radiation begins to take a larger share of support against gravity. In fact, if we define the instantaneous radiation scale-height as , over the range of sampled by this simulation, is very well fitted by
| (6) |
Thus, this slow rise in as increases very nearly cancels the reduction in the cooling time due to the increased share of radiation in the total energy. The net result is that in this regime the cooling time becomes nearly independent of , or . When , the ratio , but , so . In other words, in this regime, the cooling time lengthens with increasing as higher radiation pressure causes the disk to expand outward, increasing the total path length photons must travel before escaping.
Assembling the pieces, we see that this model suggests and at low energy content, which is when . In that limit, , yielding strong thermal stability. As the energy content grows, so does . When approaches unity, falls slightly below 1, while climbs toward zero for the reasons given in the preceding paragraph. As a result, in this regime and the system is near marginal stability. If falls further with increasing while changes only slowly, the system returns to stability.
Behavior of this sort is exactly what we observe in this simulation. When the disk has total energy near the bottom of our range, it readily develops sizable fluctuations, but they do not grow exponentially with time. Large positive fluctuations in drive the disk into a regime in which there is weak negative feedback, so the disk’s energy drops back down. If it falls far enough, new fluctuations grow.
4.2 What is ?
As we have remarked several times already, the volume-integrated dissipation rate increases with increasing energy in the box, but somewhat more slowly than linearly. One possible explanation for this weaker-than-expected dependence on pressure was initially suggested by Turner et al. (2003): that in the radiation-dominated regime, MHD turbulence is not fully coupled to the pressure because photons can diffuse across a single wavelength of the fastest-growing MRI mode in less than an orbital time. When the magnetic field has a significant toroidal component (in fact, shear usually makes the toroidal component the largest), the MRI can be compressive. Photon diffusion can reduce the growth rate, or even lead to damping, for compressive modes. It is possible that lower growth rates lead to lower saturation amplitudes. Although Turner et al. gave an argument showing that radiation-coupling was marginal in the radiation-dominated regime, this connection between the photon diffusion time and the MRI in fact applies to all disk states, radiation-dominated or not.
If the angular momentum flux through the disk is small compared to , the time-averaged dissipation rate is , where is the vertically-integrated stress. Defining in the usual way as the ratio between and the vertically-integrated pressure, the thermal equilibration time is then , where is the effective adiabatic index. The distance photons can diffuse in any given time is . In particular, in thermal equilibrium, for , so
| (7) |
On the other hand, the growth time of the fastest-growing MRI mode is always , so we see that
| (8) |
Now the wavelength of the fastest-growing MRI mode is , where is the Alfvén speed taking into account only the vertical component of the magnetic field. We then find that the ratio of that wavelength to the distance photons can diffuse in its growth time is
| (9) |
Because and –0.5, we therefore find that in all circumstances, radiation-dominated or not. In other words, dynamical coupling between radiation pressure and the fastest-growing MRI mode is always marginal.
We speculate that the partial inability of the dissipation rate (and stress) to scale with the radiation pressure is due to this imperfect dynamical coupling between the basic driver of MHD turbulence (and therefore stress) and the radiation pressure. One way to estimate the magnitude of this effect is to use the formalism of Blaes & Socrates (2001,2003) to compute the MRI growth rate under these circumstances. In the limit of perfect thermal coupling between gas and radiation ( in their notation), we find that in the conditions of this simulation the maximum local linear growth rate can be moderately suppressed (generally speaking, by ). As already discussed, the degree of suppression increases with growing . In addition, because compressibility grows in importance with increasing , larger values of this ratio also reduce the growth rate when photon diffusion is important; in this simulation, typical values of in the disk body were 3–5.
4.3 Implications for hydrostatic balance and stability at higher radiation gas pressure ratios
There is a critical dissipation scale for radiation pressure-supported, geometrically-thin disks: . When the dissipation per unit volume matches this at all altitudes below the point of observation, the upward radiation force exactly matches the downward component of gravity; if the net force from gas pressure gradients and magnetic fields is upward, the disk matter must move away from the midplane. Measured in terms of this critical value, the mean dissipation rate within a few scale-heights of the midplane during times of high total energy in this simulation was ; during times of low total energy, it was only about half as large, . In other words, there are episodes as long as during which most of the disk mass derived of its support against vertical gravity from radiation forces, but for the remainder of the simulation the fractional support due to radiation was smaller. At higher altitudes, the magnetic pressure gradient replaces radiation as the primary source of vertical force at all times.
These mean values cover a great deal of fluctuation, however. Even after averaging over a cooling time (7 orbits) sampled every 0.01 orbits, there are sizable fluctuations in the horizontally-averaged dissipation rate within of the midplane, where most of the dissipation occurs. In that region, the instantaneous horizontally-averaged dissipation rate typically varies by factors of 3–4, with the scale of variation often as little as . If one considers fluctuations within individual planes relative to the instantaneous mean for that plane, the rms dispersion is typically 2–4 times the mean, but can be as much as 5–10 times the mean. Not surprisingly, dissipation features within a single plane tend to form radially sheared stripes stretched in the azimuthal direction.
Because the fluctuations are so large, it is also useful to consider the question of fractional radiation support in terms of the fraction of the time that the dissipation rate matches or exceeds the critical value. In the conditions of this simulation, this duty cycle was within of the midplane. Were it to rise above , one could no longer expect hydrostatic equilibrium in the central part of the disk because radiation force by itself would exceed gravity more often than not.
As a plausible guess, we might estimate that this duty cycle would be linearly proportional to the time-average of the dissipation rate. Thus, an increase in the mean dissipation rate per unit volume by a factor of 2–3 relative to what was seen in this simulation would lead to difficulties even in establishing hydrostatic equilibrium. Because the vertically-integrated dissipation rate is , whereas the disk thickness changes only slightly with radius when radiation dominates its vertical support, such an increase might be expected at radii only 0.7–0.8 times the one at which this simulation was conducted (i.e., at –). In addition, if we employ the toy-model of § 4.1, we might predict that the cooling time would begin to grow with increasing , perhaps to the point that . We know little about the dependence of the dissipation rate on in this regime; however, if and , it might be difficult to avoid a thermal instability similar to the one envisaged by Shakura & Sunyaev (1976).
On the other hand, it is also possible that photon bubbles (Gammie 1998, Begelman 2001) might sufficiently enhance the radiation transport rate relative to conventional diffusion through a more homogeneous substrate that thermal instability could be quenched. Put another way, photon bubbles might keep well below unity. As discussed in the companion paper (Blaes et al. 2007), we do not find any strong evidence for photon bubbles in the current simulation, even though linear theory predicts they should grow rapidly in the upper layers of this simulation, and we have adequate resolution to see the fastest-growing modes. Nonetheless, it remains possible that they could be more important at higher levels of radiation pressure support. This is because photon bubble growth rates are proportional to the radiative flux, so that they may be able to form and reform rapidly even in the presence of competing time-dependent phenomena. It may be challenging to find them in a simulation, however, as the expected characteristic wavelength of these instabilities is the gas pressure scale height, which can be very small in a radiation dominated disk.
4.4 A new high radiation pressure equilibrium?
These results may be combined to form a new approximate equilibrium for the radiation-dominated state. Such an equilibrium might be a suitable initial condition for future simulations exploring higher ratios of radiation to gas pressure than found here.
Let us begin with the supposition that the dissipation rate per unit mass continues to be , independent of the ratio of radiation to gas energy. If, in addition, the dissipation rate per unit volume is fixed to the critical value for pure radiation support in hydrostatic balance, then we have
| (10) |
for some proportionality constant . However, since , Equation 10 leads to the differential equation
| (11) |
which has the solution
| (12) |
where . The proportionality constant can be determined in terms of the total mass accretion rate; the result is that , just as in the usual Shakura & Sunyaev (1973) radiation-dominated equilibrium (neglecting correction factors due to the net flux of angular momentum through the disk and relativistic effects). Unlike that equilibrum, however, in which the density was supposed to be constant, here
| (13) |
This equilibrium neglects any magnetic support. From what we have learned from this simulation and our previous one, we now know that the upper layers of the disk are generally magnetically-supported. In reality, then, it is likely that, rather than going to zero at , the gas density actually stretches beyond and tapers more gradually to zero.
5 Summary
In this paper we have explored the interplay of MHD turbulence stirred by the magneto-rotational instability with radiation forces in a regime in which the radiation pressure is comparable to the gas pressure.
Several results stand out:
1) As in our previous simulation of a gas pressure-dominated shearing box, although a mix of radiation and gas pressure accounts for most of the material’s support against vertical gravity near the disk plane, the outer layers of the disk are held up primarily by magnetic pressure gradients. More than half of the disk’s volume inside the photosphere is magnetically-dominated, although these layers account for a much smaller fraction of its total mass.
2) The energy content of the disk undergoes large (factor of several) excursions, with typical episodes lasting –6 cooling times. These do not lead to runaway, despite the fact that radiation pressure can be several times as great as gas pressure for several cooling times. Both the large fluctuations and the absence of instability can be explained qualitatively by a combination of a slower-than-linear rise of dissipation rate with energy content and, when gas and radiation energies are comparable, the insensitivity of the cooling time to changes in total energy.
3) We extend the domain of applicability of our previous result, that the dissipation is correlated with the current density, rising in the mean , where , but with a very sizable scatter around this mean relationship. The time-average dissipation rate per unit mass appears also to depend on optical depth, scaling when considering time- and horizontally-averaged values. On the other hand, these trends apply only to averages: the dissipation is highly intermittent and time-variable, with a small fraction of the total cells () accounting for 3/4 of the total at any one time. In addition, a small part of the total radiated energy (5–8%) has its origin in non-dissipative processes, compressive work done on either the gas or the radiation.
We would like to thank Jim Stone for useful suggestions, and also for developing the simulation code we used. This work was supported in part by NSF Grants AST-0307657 (OB) and AST-0507455 (JHK). Numerical calculations were carried out on the SX8 at the Yukawa Institute for Theoretical Physics of Kyoto University and the VPP5000 at the Center for Computational Astrophysics of the National Astronomical Observatory of Japan.
References
- Begelman (2001) Begelman, M. C. 2001, ApJ, 551, 897
- Blaes & Socrates (2001) Blaes, O. & Socrates, A. 2001, ApJ, 553, 987
- Blaes & Socrates (2003) Blaes, O., & Socrates, A. 2003, ApJ, 596, 509
- Blaes et al. (2007) Blaes, O., Hirose, S., Krolik, J. H., & Stone, J. M. 2007, ApJ, submitted
- Brandenburg et al. (1995) Brandenburg, A., Nordlund, A., Stein, R.F. & Torkelsson, U. 1995, ApJ, 446, 741
- De Villiers et al. (2003) De Villiers J.-P., Hawley, J.F. & Krolik, J.H. 2003, ApJ, 599, 1238
- Gammie (1998) Gammie, C.F. 1998, MNRAS, 297, 929
- Hawley & Balbus (1991) Hawley, J.F. & Balbus, S.A. 1991, ApJ, 376, 223
- Hawley & Krolik (2001) Hawley, J.F. & Krolik, J.H. 2001, ApJ, 548, 348
- Hawley, Gammie, & Balbus (1995) Hawley, J.F., Gammie, C.F., & Balbus, S.A. 1995, ApJ, 440, 742
- Hirose et al. (2006) Hirose, S., Krolik, J.H. & Stone, J.M. 2006, ApJ, 640, 901
- Kim & Ostriker (2000) Kim, W.-T., & Ostriker, E. C. 2000, ApJ, 540, 372
- McKinney & Gammie (2004) McKinney, J. C. & Gammie, C. F. 2004, ApJ, 611, 977
- Miller & Stone (2000) Miller, K. A., & Stone, J. M. 2000, ApJ, 534, 398
- Novikov & Thorne (1973) Novikov, I.D. & Thorne, K.S. 1973, in Black Holes, ed. C. DeWitt & B. S. DeWitt (New York: Gordon & Breach), 343
- Shakura & Sunyaev (1973) Shakura, N.I. & Sunyaev, R.A. 1973, A&A, 24, 337
- Shakura & Sunyaev (1976) Shakura, N.I. & Sunyaev, R.A. 1976, MNRAS, 175, 613
- Stone et al. (1996) Stone, J.M., Hawley, J. F., Gammie, C. F., & Balbus, S. A. 1996, ApJ, 463, 656
- Turner (2004) Turner, N.J., 2004, ApJ, 605, L45
- Turner et al. (2003) Turner, N.J., Stone, J.M., Krolik, J.H., & Sano, T. 2003, ApJ, 593, 992